

Fluorescence tomographic imaging in turbid media using early-arriving photons and Laplace transforms
- PMID: 9238055
- PMCID: PMC23129
- DOI: 10.1073/pnas.94.16.8783
Fluorescence tomographic imaging in turbid media using early-arriving photons and Laplace transforms
Abstract
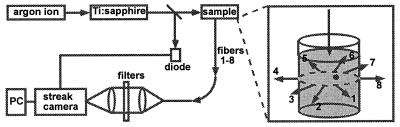
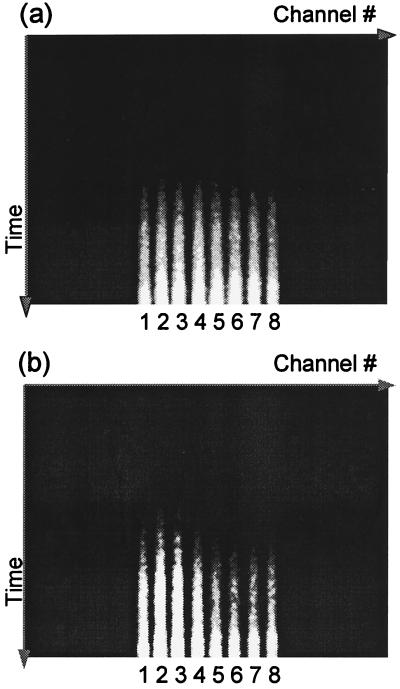
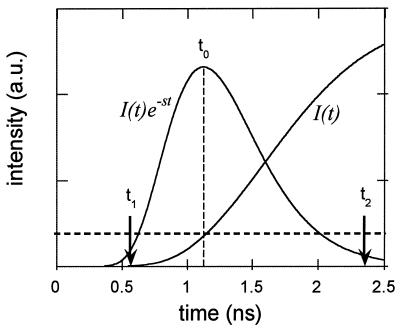
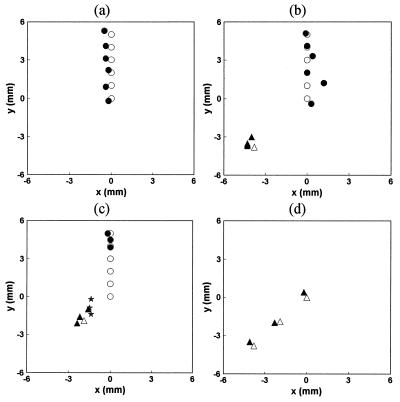
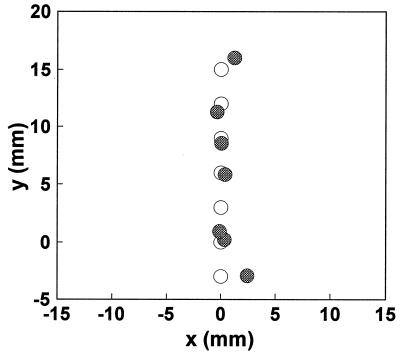
We present a multichannel tomographic technique to detect fluorescent objects embedded in thick (6.4 cm) tissue-like turbid media using early-arriving photons. The experiments use picosecond laser pulses and a streak camera with single photon counting capability to provide short time resolution and high signal-to-noise ratio. The tomographic algorithm is based on the Laplace transform of an analytical diffusion approximation of the photon migration process and provides excellent agreement between the actual positions of the fluorescent objects and the experimental estimates. Submillimeter localization accuracy and 4- to 5-mm resolution are demonstrated. Moreover, objects can be accurately localized when fluorescence background is present. The results show the feasibility of using early-arriving photons to image fluorescent objects embedded in a turbid medium and its potential in clinical applications such as breast tumor detection.
Figures
References
-
- Chance B. Proc SPIE Int Soc Opt Eng. 1995;2389:122–139.
-
- Patterson M S, Chance B, Wilson B C. Appl Opt. 1989;28:2331–2336. - PubMed
-
- Sevick E, Chance B. Proc SPIE Int Soc Opt Eng. 1991;1431:84–96.
-
- O’Leary M A, Boas D A, Chance B, Yodh A G. Phys Rev Lett. 1992;69:2658–2661. - PubMed
-
- Wang L M, Ho P P, Alfano R R. Appl Opt. 1993;32:535–540. - PubMed
Publication types
MeSH terms
Grants and funding
LinkOut - more resources
Full Text Sources
Other Literature Sources
