. 1997 Aug 5;94(16):8854-9.
doi: 10.1073/pnas.94.16.8854.

Nucleus reticularis neurons mediate diverse inhibitory effects in thalamus

Affiliations

Nucleus reticularis neurons mediate diverse inhibitory effects in thalamus

C L Cox et al. Proc Natl Acad Sci U S A. .

Abstract

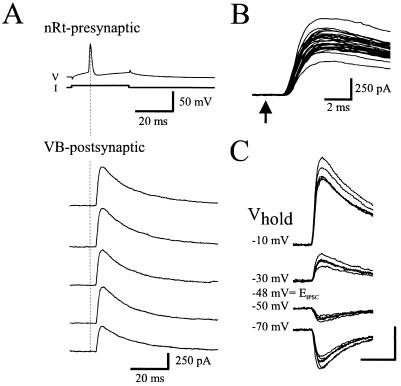
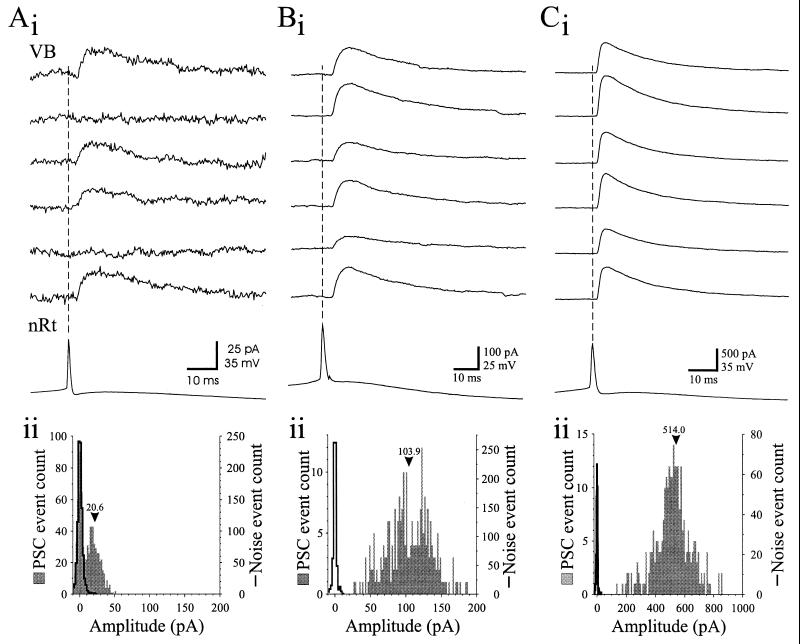
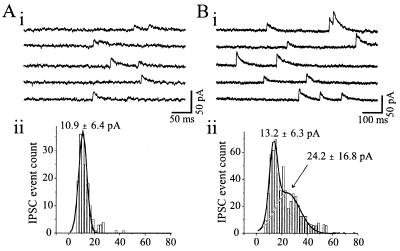
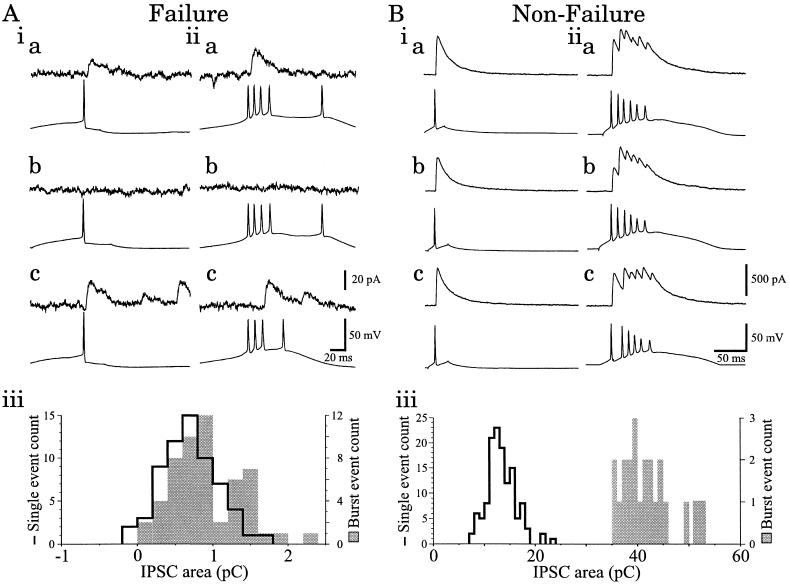
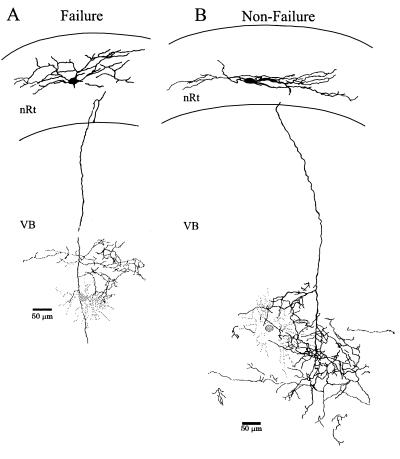
Detailed information regarding the contribution of individual gamma-aminobutyric acid (GABA)-containing inhibitory neurons to the overall synaptic activity of single postsynaptic cells is essential to our understanding of fundamental elements of synaptic integration and operation of neuronal circuits. For example, GABA-containing cells in the thalamic reticular nucleus (nRt) provide major inhibitory innervation of thalamic relay nuclei that is critical to thalamocortical rhythm generation. To investigate the contribution of individual nRt neurons to the strength of this internuclear inhibition, we obtained whole-cell recordings of unitary inhibitory postsynaptic currents (IPSCs) evoked in ventrobasal thalamocortical (VB) neurons by stimulation of single nRt cells in rat thalamic slices, in conjunction with intracellular biocytin labeling. Two types of monosynaptic IPSCs could be distinguished. "Weak" inhibitory connections were characterized by a significant number of postsynaptic failures in response to presynaptic nRt action potentials and relatively small IPSCs. In contrast, "strong" inhibition was characterized by the absence of postsynaptic failures and significantly larger unitary IPSCs. By using miniature IPSC amplitudes to infer quantal size, we estimated that unitary IPSCs associated with weak inhibition resulted from activation of 1-3 release sites, whereas stronger inhibition would require simultaneous activation of 5-70 release sites. The inhibitory strengths were positively correlated with the density of axonal swellings of the presynaptic nRt neurons, an indicator that characterizes different nRt axonal arborization patterns. These results demonstrate that there is a heterogeneity of inhibitory interactions between nRt and VB neurons, and that variations in gross morphological features of axonal arbors in the central nervous system can be associated with significant differences in postsynaptic response characteristics.


Figures

Figure 1
Figure 1
Unitary IPSCs recorded from the VB neuron of a synaptically connected pair of nRt and VB cells. (A) Single action potentials from a presynaptic nRt neuron (nRt-presynaptic, V) evoked by intracellular depolarizing current pulses (I) elicit unitary IPSCs in the postsynaptic VB neuron (VB-postsynaptic). Dotted line marks the peak of action potential in presynaptic neuron. (B) Expanded traces of 35 responses that illustrate the constant IPSC onset latency of 1.5 ms. Arrow, presynaptic action potential peak. (C) Five consecutive responses are superimposed at each indicated holding potential. Reversal potential of the evoked IPSC was −48 mV. Calculated ECl = −55 mV. Calibration: 250 pA, 10 ms.
Figure 2
Figure 2
Postsynaptic failure rate and IPSC amplitude vary among different nRt-VB pairs. (A, i) Recordings from a pair of neurons in which postsynaptic failures occurred. Single nRt APs evoked small amplitude IPSCs but could also result in postsynaptic failures (traces 2 and 5). (ii) Distribution of postsynaptic current (PSC) peak amplitudes (shaded bars) and noise (solid line) for 804 trials. The PSC distribution consists of two peaks; the first overlaps with the noise and indicates failures, and the second peak corresponds to evoked IPSCs. Bin size = 2 pA. (B, i) Recordings from a pair of neurons that lacked unitary IPSC failures in response to single nRt APs. (ii) Amplitude distribution of PSCs (shaded bars) and noise (solid line) for the neuron of B, i. Note the broad distribution and lack of overlap with the noise measurements. Bin size = 2 pA. (C, i) Recordings from a different “nonfailure” pair with a larger amplitude unitary IPSC than in the cell of B, i. Note the different calibration scales for amplitudes in AC. Bin size = 10 pA. Vertical dashed lines in A, i; B, i; and C, i mark peaks of nRt APs. Numbers above bars in A, ii; B, ii; and C, ii are mean PSC amplitude.
Figure 3
Figure 3
Miniature IPSCs recorded from VB neurons in presence of TTX (1 μM) and excitatory amino acid antagonists [6-cyano-7-nitroquinoxaline-2,3-dione (CNQX), 20 μM; D-3-(2-carboxypiperazine-4-yl)-1-propenyl-1-phosphonic acid (d-CPPene), 10 μM]. (A, i and B, i) mIPSCs recorded in five continuous segments from two different VB neurons. (A, ii) The amplitude distribution of mIPSCs for the cell of A, i is slightly skewed and is fitted by a single Gaussian distribution (solid line) with a mean and variance of 10.9 ± 6.4 pA. (B, ii) The amplitude distribution of mIPSCs for the neuron of B, i is more skewed than A, ii, and is better fit by two Gaussians of similar integral unitary size (solid line). The means and variance of these two Gaussians are 13.2 ± 6.3 and 24.2 ± 16.8 pA.
Figure 4
Figure 4
Effects of presynaptic firing mode upon unitary IPSCs. (A) A pair with high incidence of failures. (i) Range of IPSCs, including failures (Upper), evoked by single presynaptic nRt action potential (Lower). (ii) Upon membrane hyperpolarization, the nRt neuron generates bursts of action potentials in response to an intracellular current pulse. (b) Illustrates a response failure. (a and c) Single-peaked IPSCs are evoked by first (a) or third (c) spikes of the presynaptic volley, but other presynaptic spikes fail to elicit responses. Late IPSCs in i, c and ii, c are spontaneous events. (iii) Distribution of the integrated area (charge) of IPSCs evoked by single nRt APs (solid line) and nRt burst discharges (shaded bars). Bin size = 0.2 pC. (B) Recordings obtained from a “nonfailure” pair. (i) IPSCs (Upper) evoked by single nRt APs (Lower) are larger than those of A, i. (ii) Burst discharge from nRt neuron evokes multipeaked IPSCs. The individual peaks correspond to each presynaptic AP. (iii) Distribution of IPSC charge reveals that the burst-evoked response (shaded bars) is more than 3-fold greater than the single-spike evoked response (solid line). Bin size = 1 pC.
Figure 5
Figure 5
Camera-lucida reconstructions of biocytin-filled neurons in nRt and VB. (A) Reconstruction of nRt (black) and VB neuron (gray) in which postsynaptic failures occurred. Electrophysiological responses of this pair are illustrated in Fig. 2A, i. (B) This nonfailure-type pair has increased density of the nRt axonal branching compared with A. The shaded circle marks the location of the incompletely recovered VB neuron soma. Physiological responses of this pair are illustrated in Fig. 2C.

References

    1. Steriade M, McCormick D A, Sejnowski T J. Science. 1993;262:679–685. - PubMed
    1. von Krosigk M, Bal T, McCormick D A. Science. 1993;261:361–364. - PubMed
    1. Huguenard J R, Prince D A. J Neurosci. 1994;14:5485–5502. - PMC - PubMed
    1. Warren R A, Agmon A, Jones E G. J Neurophysiol. 1994;72:1993–2003. - PubMed
    1. Steriade M, Deschênes M, Domich L, Mulle C. J Neurophysiol. 1985;54:1473–1497. - PubMed

Publication types

LinkOut - more resources