. 1997 Aug;8(8):545-8.
doi: 10.1007/s003359900500.

Sucrose consumption in mice: major influence of two genetic loci affecting peripheral sensory responses

Affiliations

Sucrose consumption in mice: major influence of two genetic loci affecting peripheral sensory responses

A A Bachmanov et al. Mamm Genome. 1997 Aug.

Abstract

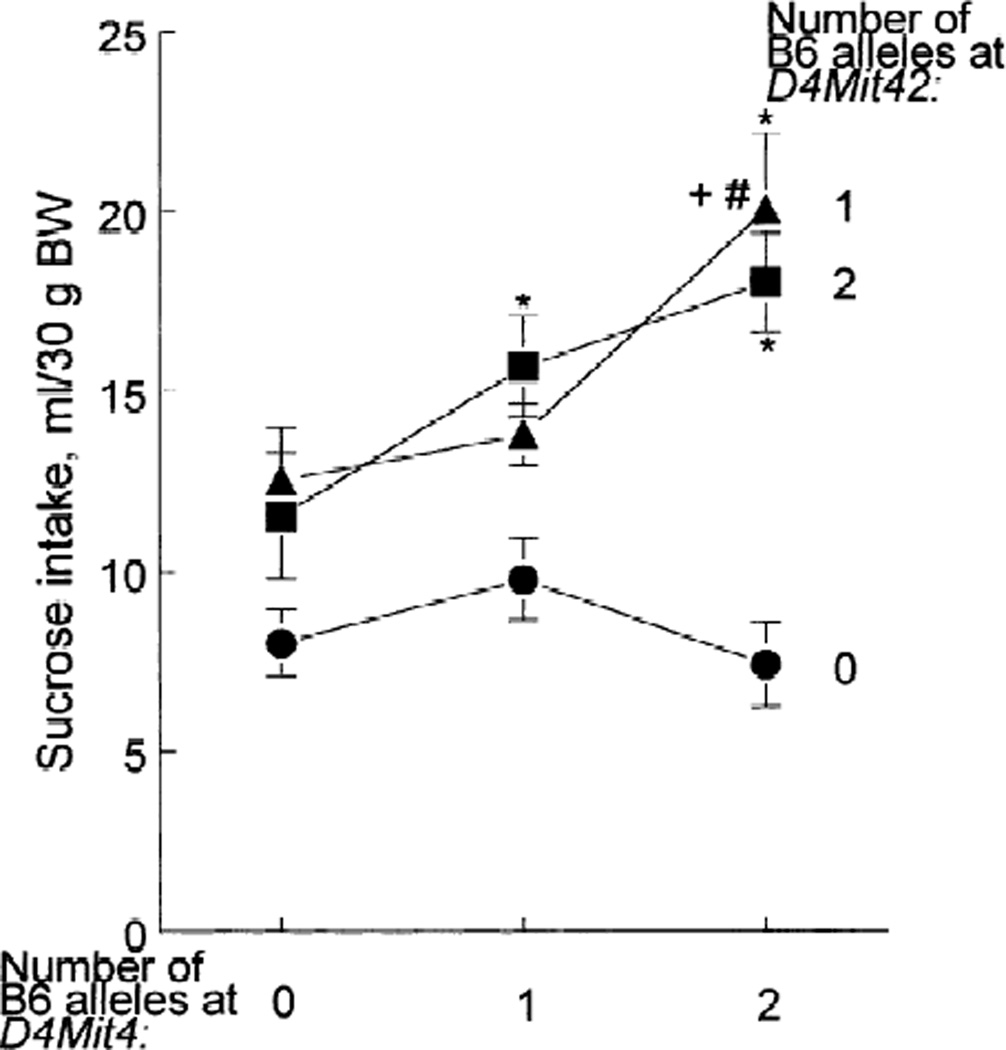
Individual variability in sucrose consumption is prominent in humans and other species. To investigate the genetic contribution to this complex behavior, we conducted behavioral, electrophysiological, and genetic studies, using male progeny of two inbred mouse strains (C57BL/6ByJ [B6] and 129/J [129]) and their F2 hybrids. Two loci on Chromosome (Chr) 4 were responsible for over 50% of the genetic variability in sucrose intake. These loci apparently modulated intake by altering peripheral neural responses to sucrose. One locus affected the response threshold, whereas the other affected the response magnitude. These findings suggest that the majority of difference in sucrose intake between male B6 and 129 mice is due to polymorphisms of two genes that influence receptor or peripheral nervous system activity.


Figures

Fig. 1
Fig. 1
Row 1. Average daily intake of 0.12 m (4%) sucrose solution in 96-h two-bottle tests expressed per 30 g of body weight (BW) in: (A) B6 (n = 14) and 129 (n = 13) mice; (B) their F2 hybrids with different genotypes for the D4Mit4 marker (B6/B6, n = 39; B6/129, n = 84; 129/129, n = 37); (C) their F2 hybrids with different genotypes for the D4Mit42 marker (B6/B6, n = 45; B6/129, n = 84; 129/129, n = 39). Row 2: Lowest sucrose concentration (threshold) that evoked chorda tympani response for: (D) B6 (n = 5) and 129 (n = 5) mice: (E) their F2 hybrids with different genotypes for the D4Mit4 marker (B6/B6, n = 8; B6/129, n = 4; 129/129, n = 8); (F) their F2 hybrids with different genotypes for the D4Mit42 marker (B6/B6, n = 7; B6/129, n = 7; 129/129, n = 7). Row 3: Magnitude of chorda tympani responses to different sucrose concentrations relative to 0.1 m NH4Cl in the same three groups as in the Row 2. Vertical bars represent standard errors. *p < 0.05 for effect of genotype by ANOVA.
Fig. 2
Fig. 2
(A) Chromosome 4 LOD scores for 0.12 m sucrose intake under free (unconstrained), B6 dominant, B6 recessive, and additive models. Dominance of the B6 allele is rejected for the locus on the proximal part of Chr 4 (the LOD score under the dominant model is more than 1.0 lower than that for the free model). The additive and recessive modes of inheritance are rejected for the B6 allele at the locus on the distal part of Chr 4. The dotted horizontal lines show thresholds for significant linkage (LOD = 4.3) and suggestive linkage (LOD = 2.8; Lander and Kruglyak 1995). (B) Correlations between the number of the B6 alleles (0, 1, 2) for the corresponding markers and threshold and relative magnitude of electrophysiological chorda tympani responses to different sucrose concentrations in selected F2 mice (n = 13 – 21). ns = p ≥ 0.05; * = p < 0.05; **p < 0.01; ***p < 0.001. The microsatellite markers and map distances between them in centimorgans (cM) are shown on the X axis. At the bottom of the figure, arrows show the loci positions at the peak of the LOD scores; the solid horizontal lines show confidence intervals for the loci (LOD Drops of 1.0).
Fig. 3
Fig. 3
Average daily 0.12 m sucrose intake in 96-h two-bottle tests expressed per 30 g of body weight (BW) in F2 hybrids with different genotypes for the D4Mit4 and D4Mit42 markers (7 ≤ n ≤ 37 in each of the nine groups). Lines correspond to D4Mit42 genotypes, with numbers of the B6 alleles shown to the right. Each marker genotype affected sucrose consumption [D4Mit4: F(2,151) = 4.14, p = 0.018; D4Mit42: F(2,151) = 14.4, p = 0.000002; two-way ANOVA]. Although interaction between the D4Mit4 and D4Mit42 genotypes was marginally nonsignificant when all nine genotypes were analyzed [F(4,151) = 2.13, p = 0.08], it was significant when analysis of only four homozygous genotypes (combinations of 129/129 and B6/B6 genotypes for the two markers) was conducted [F(1,32) = 5.89, p = 0.02]. The group differences significant at p < 0.05 in the post hoc Tukey tests are shown as * (compared with D4Mit42 = 0 within the same D4Mit4 group), + (compared with D4Mit4 = 0 within the same D4Mit42 group), and # (compared with D4Mit4 = 1 within the same D4Mit42 group). Vertical bars represent standard errors.

References

    1. Bachmanov AA, Reed DR, Tordoff MG, Price RA, Beauchamp GK. Intake of ethanol, sodium chloride, sucrose, critic acid and quinine hydrochloride solutions by mice: A genetic analysis. Behav Genet. 1996a;26:563–573. - PMC - PubMed
    1. Bachmanov AA, Tordoff MG, Beauchamp GK. Ethanol consumption and taste preferences in C57BL/6ByJ and 129/J mice. Alcohol Clin Exp Res. 1996b;20:201–206. - PMC - PubMed
    1. Belknap JK, Crabbe JC, Young ER. Voluntary consumption of ethanol in 15 inbred mouse strains. Psychopharmacol. 1993;112:503–510. - PubMed
    1. Berettini WH, Ferraro TN, Alexander RC, Buchberg AM, Vogel WH. Quantitative trait loci mapping of three loci controlling morphine preference using inbred mouse strains. Nature Genet. 1994;7:54–58. - PubMed
    1. Blass EM, Shah A. Pain-reducing properties of sucrose in human newborns. Chem Senses. 1995;20:29–35. - PubMed

Publication types