. 1997 Sep 1;17(17):6512-21.
doi: 10.1523/JNEUROSCI.17-17-06512.1997.

Slow recovery from inactivation of Na+ channels underlies the activity-dependent attenuation of dendritic action potentials in hippocampal CA1 pyramidal neurons

Affiliations

Slow recovery from inactivation of Na+ channels underlies the activity-dependent attenuation of dendritic action potentials in hippocampal CA1 pyramidal neurons

C M Colbert et al. J Neurosci. .

Abstract

Na+ action potentials propagate into the dendrites of pyramidal neurons driving an influx of Ca2+ that seems to be important for associative synaptic plasticity. During repetitive (10-50 Hz) firing, dendritic action potentials display a marked and prolonged voltage-dependent decrease in amplitude. Such a decrease is not apparent in somatic action potentials. We investigated the mechanisms of the different activity dependence of somatic and dendritic action potentials in CA1 pyramidal neurons of adult rats using whole-cell and cell-attached patch-clamp methods. There were three main findings. First, dendritic Na+ currents decreased in amplitude when repeatedly activated by brief (2 msec) depolarizations. Recovery was slow and voltage-dependent. Second, Na+ currents decreased much less in somatic than in dendritic patches. Third, although K+ currents remained constant during trains, K+ currents were necessary for dendritic action potential amplitude to decrease in whole-cell experiments. These results suggest that regional differences in Na+ and K+ channels determine the differences in the activity dependence of somatic and dendritic action potential amplitudes.


Figures
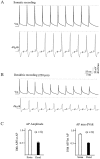
Fig. 1.
Fig. 1.
Dendritic action potential amplitude and rate of rise both decrease during repetitive activity. A, Membrane potential Vm and its temporal derivative dVm/dt during a 20 Hz train of action potentials recorded from a CA1 pyramidal soma. Action potential amplitude does not decrease although maximum rate of rise decreases slightly during the train (dashed line, dVm/dt of first spike).B, Membrane potential Vm and its temporal derivative dVm/dtduring the same train of action potentials recorded simultaneously from the dendrite of the same CA1 pyramidal neuron used inA. In the dendritic recording, both action potential amplitude and maximum rate of rise drop significantly during the train (dashed line, maximum dVm/dt of first spike).C, Grouped data comparing changes in somatic and dendritic action potential (AP) amplitudes and maximum rates of rise. Amount of change during the train is expressed by dividing the amplitude of the 10th action potential in the train by the amplitude of the first action potential (train frequency was 20–40 Hz). Note that derivative traces are on an expanded time scale compared with the voltage traces. Hash marks indicate where recordings between action potentials were removed to compress the trace. Error bars indicate SEM, and the numbers of recordings are shown inparentheses. All recordings were simultaneous somatic and dendritic recordings from the same neuron.
Fig. 2.
Fig. 2.
Repetitive activity decreases available Na+ current. A, To simulate trains of action potentials, we gave trains of 10 depolarizing steps 2 msec in duration to cell-attached patches at a frequency of 20 or 50 Hz. Between depolarizations, the patch was held at either the resting potential of the neuron or 20 mV hyperpolarized to the resting potential of the neuron. 4-AP (5 mm) and TEA (30 mm) were included in the patch pipette to block K+ channels. Soma waveform is a leak-subtracted ensemble average of currents evoked by trains applied to a somatic patch. The amplitude of the 10th evoked current is smaller than the amplitude of the first evoked current. Rest potential recorded after rupturing the patch was −63 mV. Dendrite waveform is a leak-subtracted ensemble average of currents evoked by trains applied to a dendritic patch. The amplitude of the 10th evoked current is greatly decreased compared with the first evoked current. Rest potential recorded after rupture of the patch was −67 mV. B, First, fourth, and 10th evoked currents from A at expanded (1 msec) time base. C, Group data. To quantify the decrease in current amplitudes during the train, we reported the amplitude of the current evoked by the 10th depolarizing step as a fraction of the amplitude of the current evoked by the first depolarizing step. Top, Group data for the 20 Hz train. Bottom, Group data for the 50 Hz train. Error bars indicate SEM, and the numbersabove each bar indicate the numbers of patches. Open bars correspond to trains from a hyperpolarized holding potential. Filled bars correspond to trains from rest. Note that the decrease in Na+ current was always greater in the dendrites. Note also that the decrease in both somatic and dendritic Na+ channels was dependent on the holding potential.
Fig. 3.
Fig. 3.
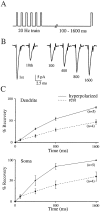
Recovery of Na+ current after a train is slow and voltage-dependent. A, To measure the rate of recovery of available Na+ current, we decreased Na+ current to −10 mV by a 20 Hz train of 10 depolarizing steps each of 2 msec duration. Each train was followed by a single test depolarization after a wait of 100, 400, 800, or 1600 msec. B, Waveforms are leak-subtracted ensemble currents during the recovery paradigm. The first evoked current in the train represents the maximum (control) amplitude of the evoked current. At the end of the train, the 10th evoked current is decreased in amplitude. The amplitude of the current recovers as the duration of the waiting period (100–1600) is increased. C, Group data for recovery from holding potentials at rest and at 20–30 mV hyperpolarized to rest. Top, Dendritic patches.Bottom, Somatic patches. Values of the test currents are scaled between the amplitude of the current evoked by the 10th depolarizing step in the train (0% recovery) and the amplitude of the current evoked by the first depolarizing step (100% recovery). Note that the recovery of currents in both somatic and dendritic patches was slow and voltage-dependent. Error bars indicate SEM, and the numbers of patches are in parentheses.
Fig. 4.
Fig. 4.
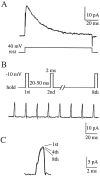
Repetitive activity does not alter available K+ current. A, Waveform is a leak-subtracted ensemble average of K+ current in a cell-attached dendritic patch (∼150 μm) evoked by a step to a depolarized command potential for 100 msec. The waveform demonstrates the early fast transient A-type current and a sustained DR-type current typical of dendritic patches. B, Top, To test whether repetitive activity alters available K+channels, we applied trains of brief depolarizations to a patch as described in A from a holding potential near rest to a potential of −10 mV. Bottom, Waveform is a leak-subtracted ensemble current during the train. Note that the currents rapidly inactivate at the end of each step and that there is no current between steps. C, First, fourth, and eighth evoked currents from B at expanded (2 msec) time base. Note in B and C that there is no alteration of current amplitude throughout the train. Note also that to account for a decrease in dendritic action potential amplitude during a train, the K+ currents would be expected toincrease in amplitude throughout the train.
Fig. 5.
Fig. 5.
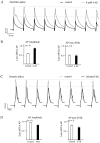
Membrane hyperpolarization modulates action potential amplitude decrement during trains. A, A train of action potentials (17 Hz) recorded from a CA1 dendrite (∼200 μm) with (light traces) and without (dark traces) the presence of membrane hyperpolarizations between the spikes. The largest hyperpolarizations (35–45 mV; 2.0 nA; 40 msec;arrow L) completely removed the decrease in action potential amplitude, whereas smaller hyperpolarizations (20–25 mV; 1.5 nA; 40 msec; arrow S) produced a graded effect on amplitude. The final action potential without interspersed hyperpolarizations is indicated by arrow C.B, Grouped data comparing changes in dendritic action potential amplitudes and maximum rates of rise with (open bars) and without (filled bars) ∼40 mV hyperpolarizations between action potentials. Amount of change during the train is expressed by dividing the amplitude of the last action potential in the train (8th–10th) by the amplitude of the first action potential (train frequency was 20–40 Hz). Records were truncated between action potentials to compress the length of thetrace. Error bars indicate SEM, and the numbers of recordings are shown in parentheses.
Fig. 6.
Fig. 6.
Manipulation of the Na+/K+ permeability ratio modulates action potential decrement during trains. A, A train of action potentials (33 Hz) recorded from a CA1 dendrite (∼240 μm) before (dark traces) and after (light traces) bath application of 8 mm 4-AP showing that high concentrations of 4-AP allowed action potential amplitude to remain fairly constant during repetitive stimulation. B, Grouped data showing that with a reduced K+permeability (filled bars) dendritic action potential amplitude remains fairly constant during a train, although the substantial decrease in maximum rate of rise remains unchanged (control, open bars). C, A train of action potentials (20 Hz) recorded from a CA1 soma before (light traces) and after (dark traces) bath application of 100 nm TTX showing that low concentrations of TTX increased the amount of action potential amplitude decrement during repetitive stimulation. D, Grouped data showing that with a reduced Na+ permeability (filled bars) somatic action potential amplitude is substantially reduced during a train of repetitive activity, although the decrease in the maximum rate of rise is only slightly greater (control, open bars). Amount of change during the train is expressed by dividing the amplitude of the last action potential in the train (8th–10th) by the amplitude of the first action potential (train frequency was 20–40 Hz). Records between action potentials were truncated to compress the length of thetrace. Error bars indicate SEM, and the numbers of recordings are shown in parentheses.

References

    1. Andreasen M, Lambert JDC. Regenerative properties of pyramidal cell dendrites in area CA1 of the rat hippocampus. J Physiol (Lond) 1995;483:421–441. - PMC - PubMed
    1. Callaway JC, Ross WN. Frequency dependent propagation of sodium action potentials in dendrites of hippocampal CA1 pyramidal neurons. J Neurophysiol. 1995;74:1395–1403. - PubMed
    1. Cannon SC. Slow inactivation of sodium channels: more than just a laboratory curiosity. Biophys J. 1996;71:5–7. - PMC - PubMed
    1. Cantrell AR, Ma JY, Scheurer T, Catterall WA. Muscarinic modulation of sodium current by activation of protein kinase C in rat hippocampal neurons. Neuron. 1996;16:1019–1026. - PubMed
    1. Catterall WA. Cellular and molecular biology of voltage-gated sodium channels. Physiol Rev. 1992;72:S15–S48. - PubMed

Publication types

LinkOut - more resources