. 1997 Sep 1;17(17):6597-610.
doi: 10.1523/JNEUROSCI.17-17-06597.1997.

Quantitative single-cell-reverse transcription-PCR demonstrates that A-current magnitude varies as a linear function of shal gene expression in identified stomatogastric neurons

Affiliations

Quantitative single-cell-reverse transcription-PCR demonstrates that A-current magnitude varies as a linear function of shal gene expression in identified stomatogastric neurons

D J Baro et al. J Neurosci. .

Abstract

Different Shaker family alpha-subunit genes generate distinct voltage-dependent K+ currents when expressed in heterologous expression systems. Thus it generally is believed that diverse neuronal K+ current phenotypes arise, in part, from differences in Shaker family gene expression among neurons. It is difficult to evaluate the extent to which differential Shaker family gene expression contributes to endogenous K+ current diversity, because the specific Shaker family gene or genes responsible for a given K+ current are still unknown for nearly all adult neurons. In this paper we explore the role of differential Shaker family gene expression in creating transient K+ current (IA) diversity in the 14-neuron pyloric network of the spiny lobster, Panulirus interruptus. We used two-electrode voltage clamp to characterize the somatic IA in each of the six different cell types of the pyloric network. The size, voltage-dependent properties, and kinetic properties of the somatic IA vary significantly among pyloric neurons such that the somatic IA is unique in each pyloric cell type. Comparing these currents with the IAs obtained from oocytes injected with Panulirus shaker and shal cRNA (lobster Ishaker and lobster Ishal, respectively) reveals that the pyloric cell IAs more closely resemble lobster Ishal than lobster Ishaker. Using a novel, quantitative single-cell-reverse transcription-PCR method to count the number of shal transcripts in individual identified pyloric neurons, we found that the size of the somatic IA varies linearly with the number of endogenous shal transcripts. These data suggest that the shal gene contributes substantially to the peak somatic IA in all neurons of the pyloric network.


Figures
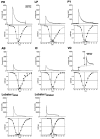
Fig. 2.
Fig. 2.
The family of IAs in the pyloric network and the lobster shal andshaker currents. The six pyloric cell types and the number of cells in each cell type are PD, pyloric dilator (2); LP, lateral pyloric (1); PY, pyloric constrictor (8); AB, anterior burster (1);IC, inferior cardiac (1); and VD, ventricular dilator (1). The top panel for each cell type illustrates the IA waveform and amplitude activated by a depolarizing voltage step to +20 mV (PD, LP, PY, and VD) or +25 mV (AB and IC). The A-conductances activated at these voltages experience a nearly identical driving force and are >96% activated in PD, PY,IC, and VD and 72 and 82% activated inLP and AB, respectively. LobsterIshal and lobsterIshaker are voltage-clamp recordings of Xenopus oocytes injected with either lobster shal or lobster shaker RNA. Thebottom panel for each cell is the peak conductance/voltage relationship for activation (filled squares) and inactivation (filled circles) of the IA. The activation and inactivation curves are least-squares best fits to third- and first-order Boltzmann equations, respectively. Each set ofpoints is the average ± SEM from 5 (PD, AB, IC, VD), 7 (LP, PY), or 17 (lobsterIshaker) cells. The lobsterIshal curves were taken from Baro et al. (1996a). The steady-state IA is the small window representing the subset of the area under both the activation and inactivation curves.
Fig. 1.
Fig. 1.
Theoretical conductance traces for a simulated voltage-clamp experiment starting from a strongly hyperpolarized state (fully deinactivated) and stepping to a strongly depolarized state (fully activated). The time constants of inactivation and the fraction of fast and slow channels were derived from Table 1, using the parameters for the PD cell (A) or the VD cell (B). In both cases the activation time constant was 1.5 msec. Time courses for activation and inactivation are displayed also. The scale on theleft ordinate is for the conductance (solid line), whereas the scale on the right ordinate is for the dimensionless activation and inactivation variables (dashed lines). The topinactivation curve is the sum of the two lower inactivation curves for the fast and slow channels. Note that the ratio of the peak conductance (Gpeak) to the true maximal conductance (true Gmax) is ∼85% for the PD cell and 43% for the VD cell.
Fig. 3.
Fig. 3.
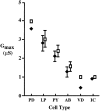
The effect of the correction factor varies among pyloric cell types. The measured averageGmax (filled diamonds) and the corrected average Gmax (open squares) are plotted for each of the six pyloric cell types. Error bars indicate the SEM when it is larger than the symbols. Note that the corrected Gmax is approximately twice the measured Gmax in theVD cell, whereas the corrected and measuredGmax do not vary greatly in the other cell types.
Fig. 4.
Fig. 4.
Results from a typical SC-RT-PCR experiment. Eachlane represents one SC-RT-PCR. The template in each SC-RT-PCR was cloned shal DNA (+), 1000 Δshal RNA standard molecules (B), or 1000 Δshal RNA standard molecules plus a single identified neuron lacking a glial cap (PY, LP, PD, PD*, and VD). Data from the cell PD* were not used because of obvious RNase degradation (see Results).
Fig. 5.
Fig. 5.
The relative amplification efficiency of Δshal over shal. Six representative PCRs are shown. Equal numbers of Δshal andshal DNA molecules were added to each PCR. PCRs were performed for (A) 20, (B) 25, or (C) 30 cycles. The PCR products were electrophoresed and phosphorimaged, and the digitized 32P signals were quantitated. The amplification efficiency per cycle of a Δshal relative to a shal DNA template was determined from the following equation: X = (cpm Δshal/cpmshal)1/n, whereX is the relative amplification efficiency per cycle andn is the number of cycles.
Fig. 6.
Fig. 6.
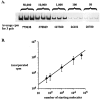
Determining the linear range of amplification.A, Fifteen shal RT-PCRs were performed for 35 cycles. The templates in each of three RT-PCRs were 5 × 10⁴, 104, 103, 102, or 50 Δshal RNA molecules. Ten microliters of the completed RT-PCRs were run on each of three gels (only one gel is shown) and phosphorimaged. The average incorporated counts per minute in the nine resulting bands were determined for each of the five templates. B, The experiment inA was repeated three times, and the average incorporated counts per minute for the five templates were determined. The average incorporated counts per minute were plotted against the number of starting molecules on a log/log scale. The error bars represent the SEM. The line represents a linear regression to the first four data points (from 50 to 104molecules).
Fig. 7.
Fig. 7.
The average number of shaltranscripts varies significantly among pyloric cell types. The average number of shal transcripts is plotted for each cell type; the error bars represent the SEM. The number of cells examined in each cell type was PD, 9; LP, 6;PY, 14; AB, 4; VD, 9; andIC, 6. Asterisks represent significant difference (p < 0.05): PY (*); AB, VD, IC (**); PD, LP (***); PD (****).
Fig. 8.
Fig. 8.
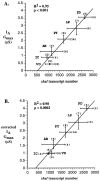
The maximum size of the somaticIA varies as a function ofshal gene expression. The average uncorrected (A) or corrected (B) Gmax was plotted against the mean number of shal transcripts for each of the six pyloric cell types. The lines represent linear regressions of the data points. The error bars on each data point represent the SE. The numbers inparentheses represent the number of cells used to measure either the Gmax or the number ofshal transcripts.

Similar articles

Cited by

References

    1. Baker K, Salkoff L. The Drosophila shaker gene codes for a distinctive K+ current in a subset of neurons. Neuron. 1990;2:129–140. - PubMed
    1. Banks MI, Haberly LB, Jackson MB. Layer-specific properties of the transient K current (IA) in piriform cortex. J Neurosci. 1996;16:3862–3876. - PMC - PubMed
    1. Baro DJ, Coniglio LM, Cole CL, Rodriguez HE, Lubell JK, Kim MT, Harris-Warrick RM. Lobster shal: comparison with Drosophila shal and native potassium currents in identified neurons. J Neurosci. 1996a;16:1689–1701. - PMC - PubMed
    1. Baro DJ, Cole CL, Harris-Warrick RM. RT-PCR analysis of shaker, shab, shaw, and shal gene expression in single neurons and glial cells. Receptors Channels. 1996b;4:149–159. - PubMed
    1. Barrantes FJ. Structural–functional correlates of the nicotinic acetylcholine receptor and its lipid microenvironment. FASEB J. 1993;7:1460–1467. - PubMed

Publication types