. 1997 Sep 1;17(17):6745-60.
doi: 10.1523/JNEUROSCI.17-17-06745.1997.

Spatial and temporal expression of the period and timeless genes in the developing nervous system of Drosophila: newly identified pacemaker candidates and novel features of clock gene product cycling

Affiliations

Spatial and temporal expression of the period and timeless genes in the developing nervous system of Drosophila: newly identified pacemaker candidates and novel features of clock gene product cycling

M Kaneko et al. J Neurosci. .

Abstract

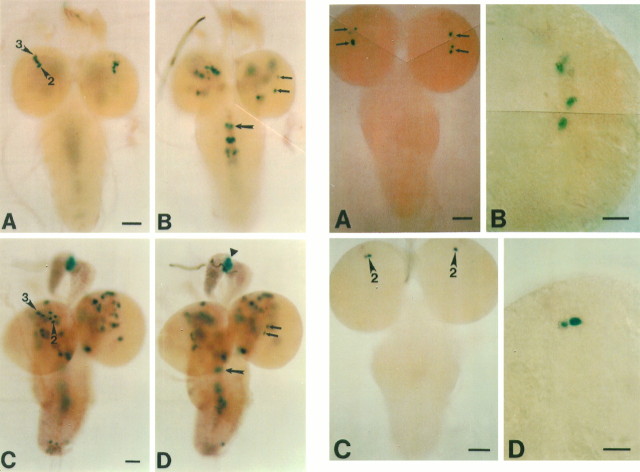
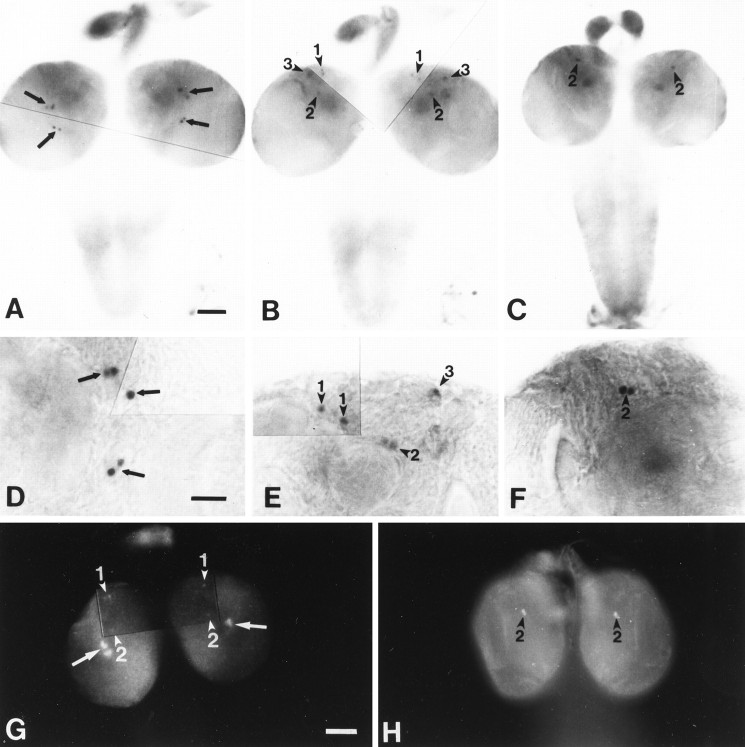
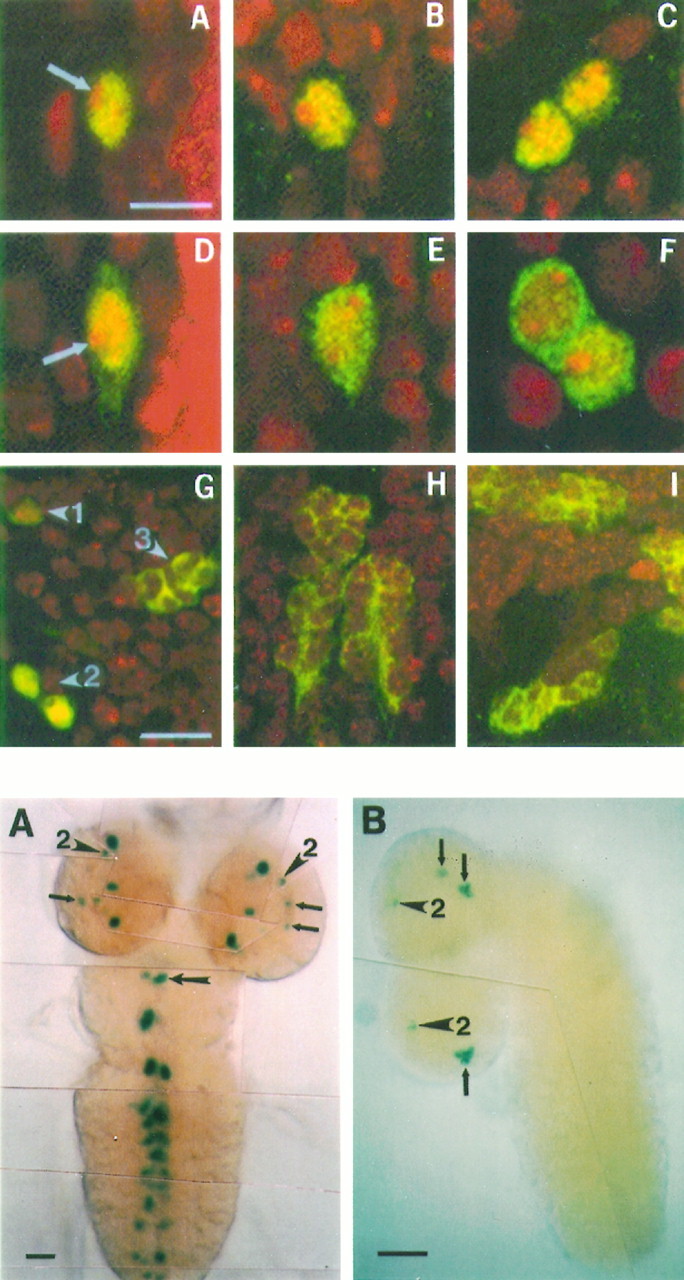
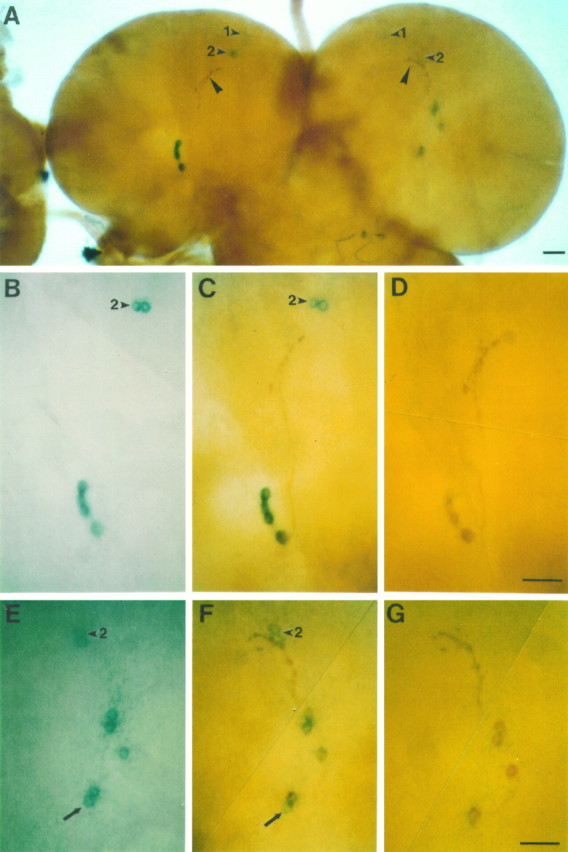
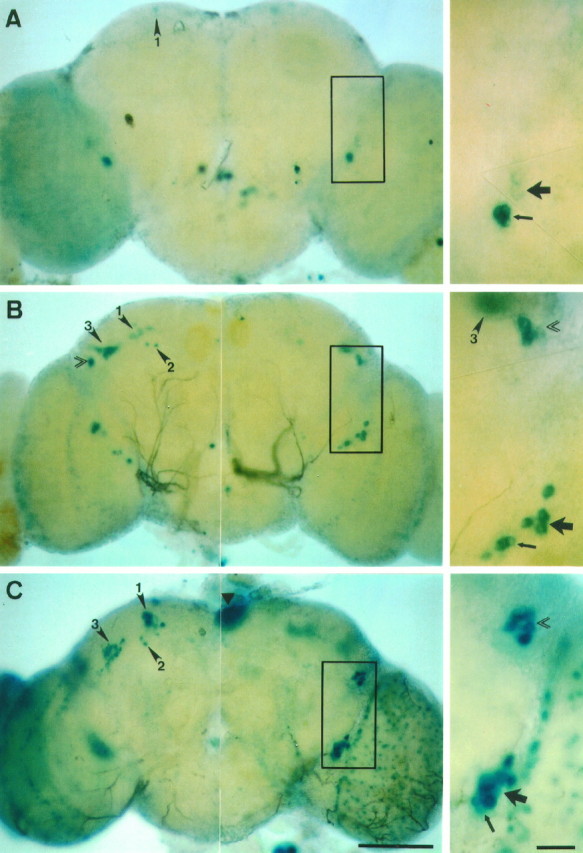
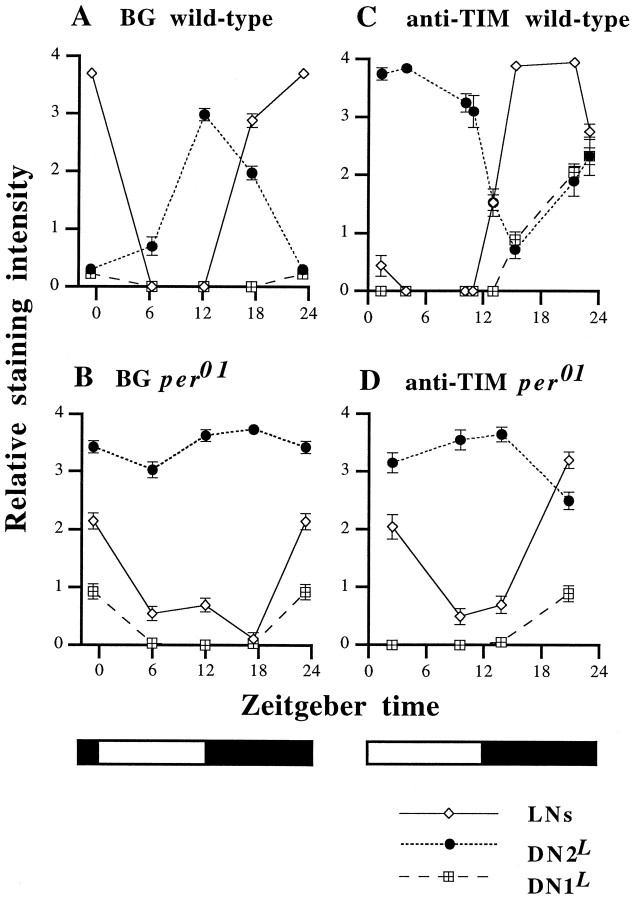
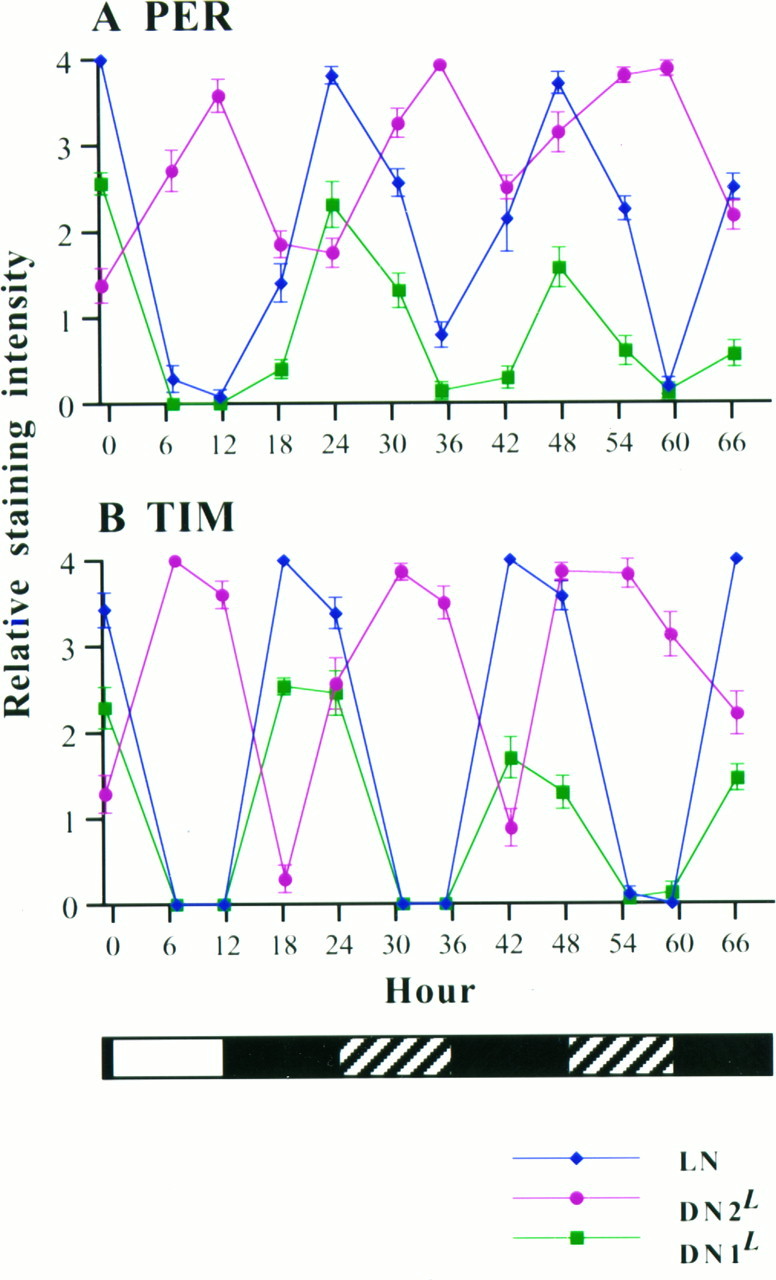
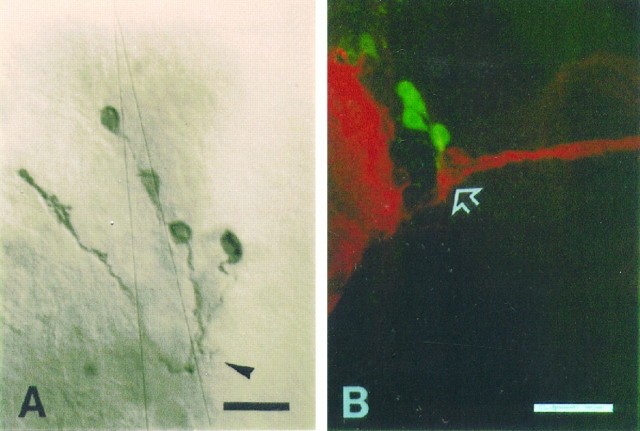
The circadian timekeeping system of Drosophila functions from the first larval instar (L1) onward but is not known to require the expression of clock genes in larvae. We show that period (per) and timeless (tim) are rhythmically expressed in several groups of neurons in the larval CNS both in light/dark cycles and in constant dark conditions. Among the clock gene-expressing cells there is a subset of the putative pacemaker neurons, the "lateral neurons" (LNs), that have been analyzed mainly in adult flies. Like the adult LNs, the larval ones are also immunoreactive to a peptide called pigment-dispersing hormone. Their putative dendritic trees were found to be in close proximity to the terminals of the larval optic nerve Bolwig's nerve, possibly receiving photic input from the larval eyes. The LNs are the only larval cells that maintain a strong cycling in PER from L1 onward, throughout metamorphosis and into adulthood. Therefore, they are the best candidates for being pacemaker neurons responsible for the larval "time memory" (inferred from previous experiments). In addition to the LNs, a subset of the larval dorsal neurons (DNLs) expresses per and tim. Intriguingly, two neurons of this DNL group cycle in PER and TIM immunoreactivity almost in antiphase to the other DNLs and to the LNs. Thus, the temporal expression of per and tim are regulated differentially in different cells. Furthermore, the light sensitivity associated with levels of the TIM protein is different from that in the heads of adult Drosophila.


Figures

Fig. 1.
Fig. 1.
Left. CNS expression pattern in third-instar larvae of per-lacZ transgenics (SG) revealed by X-gal histochemistry. The staining pattern for the SG3 line is shown inA and B and for SG10 in Cand D. A, Dorsoanterior clusters; this dorsal cluster of labeled neurons could be divided into two subclusters corresponding to PER-immunoreactive DN2L(arrowhead marked by 2) and DN3L (arrowhead marked by3). Scale bar, 50 μm. B, Staining in the ventral region of the brain is shown on the left hemisphere and the LNs (arrows) on the right. Cells near the midline of the ventral ganglion are stained (large arrow points to the staining in the first thoracic neuromere). Smaller stained clusters in the abdominal neuromeres are out of focus here. Scale bar, same as inA. C, Dorsal clusters; the clusters corresponding to PER-immunoreactive DN2L and DN3L are indicated witharrowheads (marked with 2 and3, respectively). More cells are stained in this line than in SG3. Cells at the tip of the ventral ganglion are shown as well. Scale bar, 50 μm. D, Focus on the LNs (arrow); stained cells in the ventral region are slightly out of focus in this image; strong staining in the ring gland (filled triangle) and staining in the ventral ganglion (large arrow pointing to the first thoracic neuromere) also are shown. Scale bar, same as inC.
Fig. 3.
Fig. 3.
PER- and TIM-immunoreactive cells in the CNS of third-instar larvae. PER-immunoreactive cells at ∼ZT 0 (the time of lights on) are shown in A, B,D, and E and at ∼ZT 12 inC and F; TIM-immunoreactive cells are shown at ∼ZT 21 in G and at ∼ZT 10 inH. A, Five PER-immunoreactive LNs are shown in both hemispheres; the right-most LN in the right hemisphere is slightly out of focus; scale bar, 50 μm. B, Weakly stained DNL clusters, DN1L (arrowhead marked by1), DN2L(arrowheads marked by 2), and DN3L (arrowhead marked by3); scale bar, same as in A.C, DN2Ls (arrowhead marked by 2) are shown; they are slightly out of focus in the right hemisphere and thus display weaker than in the left hemisphere; scale bar, same as inA. D, Higher magnification of LNs in the right hemisphere in A; scale bar, 20 μm.E, Higher magnification of B; two cells are stained for each of DN1L and DN2L clusters. DN3L seems to be composed of two to three subclusters. Only one of the subclusters of DN3L is in focus here; scale bar, same as inD. F, Higher magnification of the left hemisphere in C; note that DN2Ls are stained more strongly in F than in E; scale bar, same as in D. G, TIM immunoreactivity in DN1L(arrowheads marked by 1), DN2L (arrowheads marked by2), and LNs (arrows); scale bar, 50 μm.H, DN2L(arrowheads marked by 2) is stained more strongly here than in G; scale bar, same as inG.
Fig. 4.
Fig. 4.
Top. Confocal images showing subcellular localizations of PER, TIM, and SG. A–C, Wild-type L3 brains stained by anti-PER (green) also were stained by propidium iodide (red) to reveal nuclei. A, An LN at ZT 23; B, a DN1L at ZT 23;C, two DN2Ls at ZT 12. Anti-PER signals overlap with red DNA staining except in nucleoli, where there is no PER staining (an arrow in A points to a nucleolus). This indicates that PER is predominantly nuclear in these cells at their peak time points. D–F, Anti-TIM staining (green) on wild-type L3brains counterstained by propidium iodide (red).D, An LN at ZT 21; E, a DN1L at ZT 21; F, two DN2Ls at ZT 10. Unlike PER, TIM is localized both in nuclei and cytoplasm but is excluded from nucleoli (anarrow in D points to a nucleolus). This cytoplasmic (and nuclear as well) staining also was observed in LNs at ZT 23 and DN2Ls at ZT 13 (data not shown).G–I, L3 brains from the SG3 transformant strain were double-labeled by anti-β-gal (green) and anti-ELAV (red). All of the SG-expressing cells were double-labeled, indicating that they are neurons. G, Dorsal region of the brains showing the three dorsal neuronal clusters, DN1L, DN2L, and DN3L(arrowheads marked by 1, 2, and3, respectively). SG is expressed predominantly in nucleus in DN1L and DN2Lclusters but is excluded from nuclei in DN3Ls. The anti-β-gal staining in DN1L is very weak; therefore, it appears almost orange here. Contrastingly, anti-β-gal staining in DN2Ls is so strong that it appears as yellow-green. H, SG signals near the midline of the first segment of the ventral ganglion. They are predominantly cytoplasmic. I, Ventral region of the brain, showing cytoplasmic staining of β-gal. Scale bars: 5 μm inA–F; 10 μm in G–I.
Fig. 9.
Fig. 9.
X-gal and anti-PDH double-labeling in the brain of a third-instar larva carrying a per-lacZ fusion gene. The transgenic strain was BG6a. A, Cells in both brain hemispheres labeled by X-gal and by an antibody against pigment-dispersing hormone at relatively low magnification; four and five LNs are prominently stained in the left and right brain hemispheres, respectively; the arrowheads point to the DNLs that are stained in the dorsoanterior brain hemispheres; the DN1Ls (arrowheads marked by 1) are stained only faintly and are slightly out of focus; the DN2Ls (arrowheads marked by 2) are located close to the terminals (large arrowheads) of the LNs, especially in the right brain hemisphere.BD, LNs and DN2Ls in the left brain hemisphere inA at higher magnification; this brain region was first photographed after X-gal histochemistry had been performed (B), then rephotographed after anti-PDH immunohistochemistry was performed (C), and photographed for a third time after the blue X-gal stain had been dissolved by methylbenzoate (D); all four LNs were marked by X-gal. EG, LNs and DN2Ls in the right brain hemisphere, marked by X-gal staining only (E), by X-gal and anti-PDH (F), and by anti-PDH only (G); four of five LNs stained by X-gal also were labeled by anti-PDH; the fifth LN (arrows inE and F) and both DN2Ls (marked by 2) were not PDH-immunoreactive; scale bars, 20 μm.
Fig. 6.
Fig. 6.
per-lacZ expression pattern in pupal brains revealed by X-gal histochemistry. The transgenic strain used was BG6a. For all of these late developmental stages the left brain hemispheres are shown from a posterior view and reveal the DNs; the right ones are anterior views and reveal the LNs. A, Brain at 50% of pupal development; the arrowhead(marked by 1) in the left brain hemisphere points to two faintly stained DN1s; one of them is slightly out of focus and thus is difficult to see in this image; in the right brain hemisphere four prominently stained small ventral LNs (small LNvs) can be seen, which correspond to the larval LNs; dorsally to them two large LNvs have begun to express the BG-encoded reporter; theboxed section of the brain is shown to theright at higher magnification; the large arrow marks the two faintly stained large LNvs, and the small arrow marks the prominently stained small LNvs. B, Brain at 70% of pupal development; the arrowheads in the left brain hemisphere point to the DN1s, DN2s, and DN3s (marked by 1, 2, and3, respectively); the DN3s are in close vicinity to the dorsolateral neurons (LNds; double arrowhead); in the right hemisphere four small and four large LNvs are stained (small and large arrows in the magnification of the boxed section); furthermore, the more dorsally situated LNds (double arrowhead) are now prominently stained; as in the left brain hemisphere, they are in close vicinity to the DN3s (arrowhead marked by 3).C, Brain of a newly emerged adult fly; all three groups of DNs can be seen in the left brain hemisphere, and the LNds as well as the small and large LNvs can be seen in the right one (also note the higher magnification of theboxed brain section); the LNds (double arrowhead) and the DN1s (arrowhead marked by1) are now clearly separated from each other and cannot be seen in the same plane of focus; in addition to the DNs and LNs, the photoreceptor cells of the compound eyes (data not shown) and the ocelli (filled triangle) were stained prominently; furthermore, numerous glial cells on the surface of the optic lobe and central brain are revealed by X-gal. Scale bars: 100 μm for the pictures of the whole brains; 20 μm for the higher magnifications.
Fig. 7.
Fig. 7.
BG cycling revealed by X-gal histochemistry and TIM cycling revealed by immunofluorescent staining in LD cycles. LN signals, solid lines and diamonds; DN2Ls, dotted lines andcircles; DN1Ls, broken lines and squares. Error bars represent SEM of 0.1 or larger. (SEMs smaller than 0.1 do not appear in the graphs because of the artifact in the plotting program, but these are quite small errors in any case.) All of the data points are an average of multiple samples. Open and black bars at the bottom of graphs B andD represent the 12 hr light phase and the 12 hr dark phase, respectively. The method for scoring staining intensities reported by Stanewsky et al. (1997a) was used to generate these graphs (see Materials and Methods). A, BG in aper+ genetic background at four time points (∼ZT 6, 12, 17, and 23); four such experiments were performed, in each of which at least 34 brain hemispheres per time point were scored. In one of these experiments a more qualitative scoring procedure (scoring method 1) was used (see Materials and Methods); because all four experiments gave similar results, the one with largest sample sizes (34–42 brain hemispheres per time point) is presented here. B, BG in aper01 background at four time points (∼ZT 6, 12, 17, and 23); similar to BG-mediated staining in per+, two experiments with similar results were performed, in one of which the aforementioned scoring method 1 was applied. The second experiment, in which 38–40 brain hemispheres were scored for each time point, is presented here.C, TIM immunoreactivity in a clock gene normal genetic background; six experiments were performed in which two to eight time points were taken. Because similar results were obtained in each experiment, the one with largest number of time points is presented here; 16, 20, 20, 10, 15, 18, 20, and 12 brain hemispheres were scored at times ZT 1.3, 3.9, 10.1, 10.9, 13, 15.3, 21.4, and 23.D, Anti-TIM immunoreactivity inper01 background; one experiment was done in which 20 brain hemispheres were scored for each of four time points, ∼ZT 2, 10, 14, and 21.
Fig. 8.
Fig. 8.
PER and TIM cycling revealed by immunohistochemistry in an LD cycle, followed by 2 d of DD. Fluctuation of PER immunoreactivity is shown in A, and TIM immunoreactivity is shown in B. LN signals,blue lines and diamonds; DN2Ls, pink lines andcircles; DN1Ls, green lines and squares. Error bars represent SEM of 0.09 or larger. The light regime is shown at the bottomof B, where the white bar indicates the last period when lights were on, the black bars indicate when the lights were off, and the hatched bars indicate when the lights would have been on had the LD cycle been continued. For all of the data points, 5–10 (mean = 7.8) samples (10–20 brain hemispheres) were scored. Larvae were raised in LD cycles for 4 d after 24 hr of egg laying. Starting on the fourth day, 10–20 larvae were dissected at ∼ZT 23, 6, 12, 18, and 23 in an LD cycle (first day in the graphs, as indicated by the black and open bars at the bottom). Therefore, 0 hr on theabscissa corresponds to ZT 0 on the fourth day. Then the remaining larvae were maintained in constant darkness (DD) for 2 further days (in particular, 42 hr of DD subsequent to the end of the “D” portion of the LD cycle), and 10–20 larvae were dissected every ∼6 hr. By the seventh day many of the larvae had completed pupariation. One-half of the brains dissected at each time point were stained for PER immunoreactivity, and the other half were stained for TIM immunoreactivity. After brains from all of the time points were stained, PER and TIM immunoreactivities were blindly scored simultaneously by the second such method (see Materials and Methods). The resulting mean and SEM values for each time point were plotted: inA, PER immunoreactivity; in B, TIM immunoreactivity.
Fig. 10.
Fig. 10.
Spatial relationship between LNs and Bolwig’s nerve. A, Anti-PDH immunohistochemistry on anL3 CNS of a wild-type larva revealed four LNs sending fine dendritic processes (arrowhead) as well as axons.B, Confocal image of an L3 CNS of a BG transgenic larva, double-labeled with anti-β-gal (green) and mAb 22C10 (red). mAb 22C10 revealed Bolwig’s nerve terminating near the border between the central brain and the optic lobe primordium (arrow). The neuropile of the central brain also is strongly labeled by mAb 22C10 on the left side. Five LNs and their short processes were revealed by anti-β-gal. One of the LNs, located anterior to the others, was stained weakly. The processes of the LNs run toward the terminal of the Bolwig’s nerve. Scale bars, 20 μm.

References

    1. Amrein H, Axel R. Genes expressed in neurons of adult male Drosophila. Cell. 1997;88:459–469. - PubMed
    1. Bargiello TA, Young M. Molecular genetics of a biological clock in Drosophila. Proc Natl Acad Sci USA. 1984;81:2142–2146. - PMC - PubMed
    1. Bargiello TA, Saez L, Baylies MK, Gasic G, Young MW, Spray DC. The Drosophila clock gene per affects intercellular junctional communication. Nature. 1987;328:686–691. - PubMed
    1. Bier E, Ackerman L, Barbel S, Jan L, Jan YN. Identification and characterization of a neuron-specific nuclear antigen in Drosophila. Science. 1988;240:913–916. - PubMed
    1. Bodenstein D. The postembryonic development of Drosophila. In: Demerec M, editor. Biology of Drosophila. Wiley; New York: 1950. pp. 275–367.

Publication types

MeSH terms

LinkOut - more resources