. 1997 Sep 1;17(17):6783-97.
doi: 10.1523/JNEUROSCI.17-17-06783.1997.

Cellular-synaptic generation of sleep spindles, spike-and-wave discharges, and evoked thalamocortical responses in the neocortex of the rat

Affiliations

Cellular-synaptic generation of sleep spindles, spike-and-wave discharges, and evoked thalamocortical responses in the neocortex of the rat

A Kandel et al. J Neurosci. .

Abstract

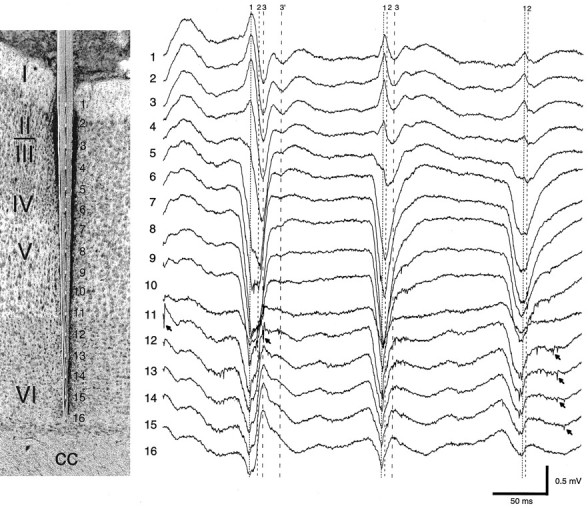
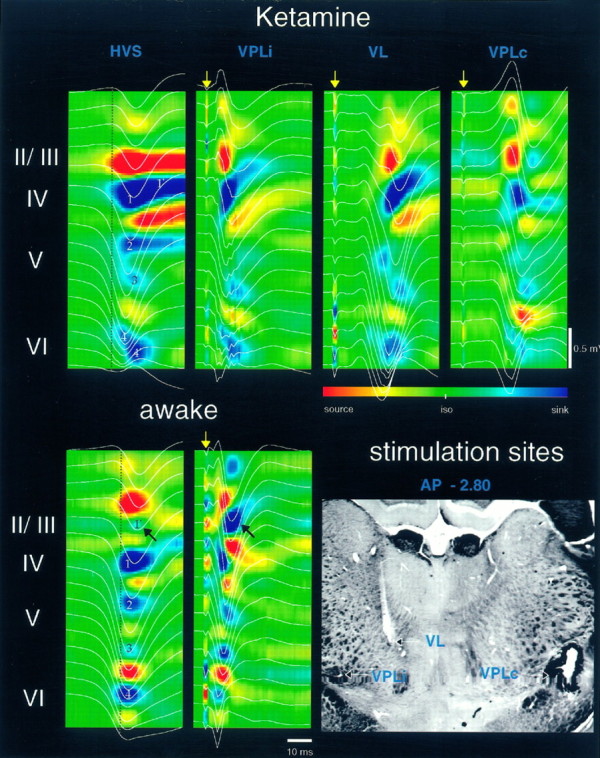
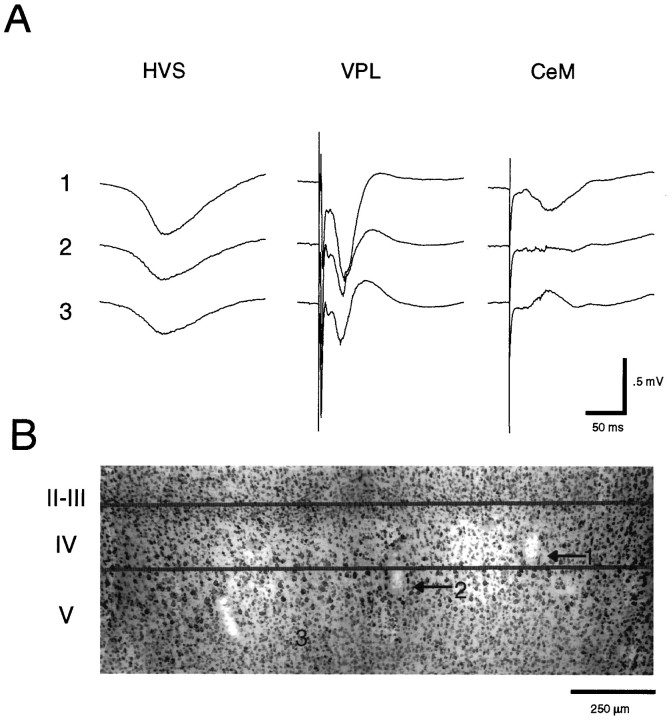
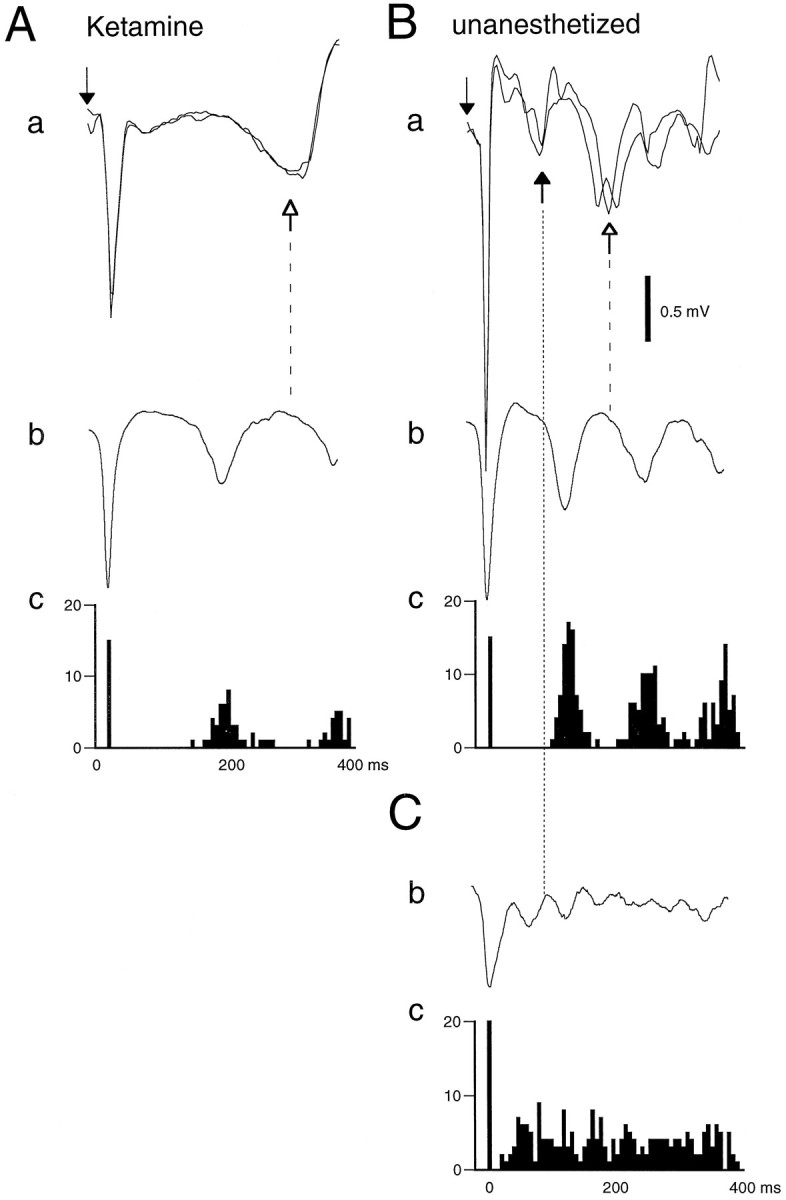
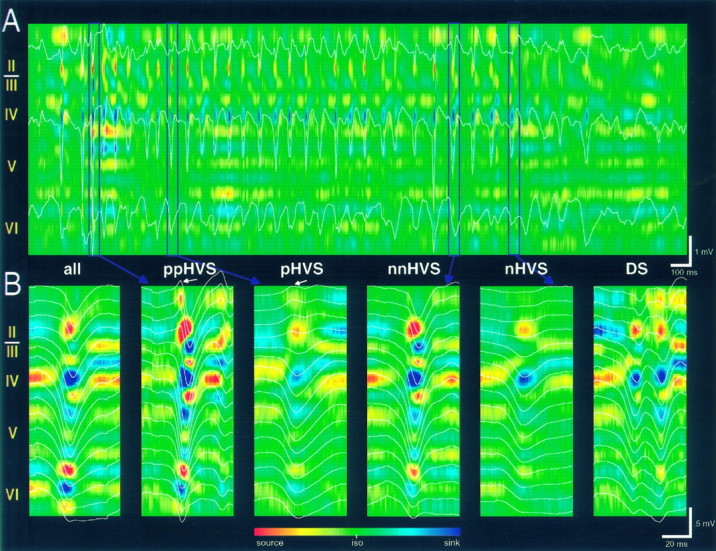
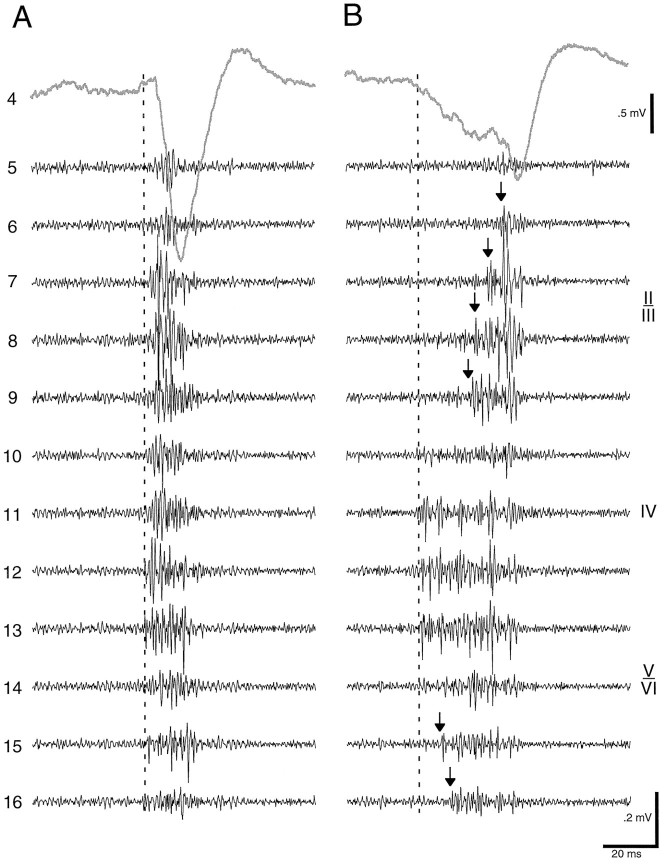
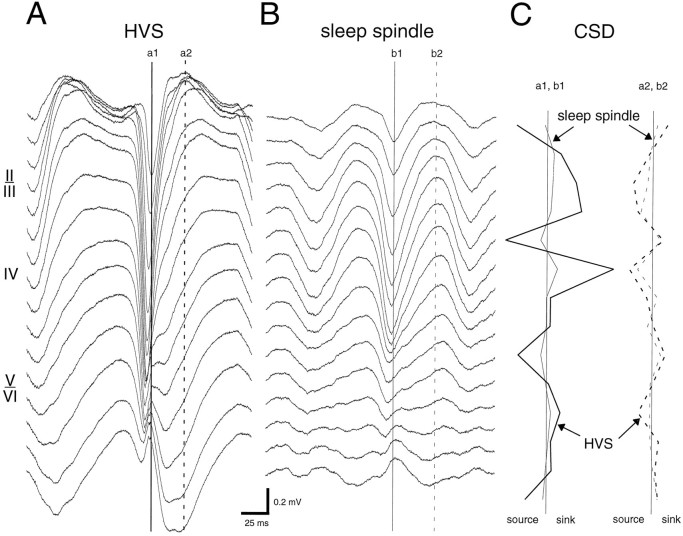
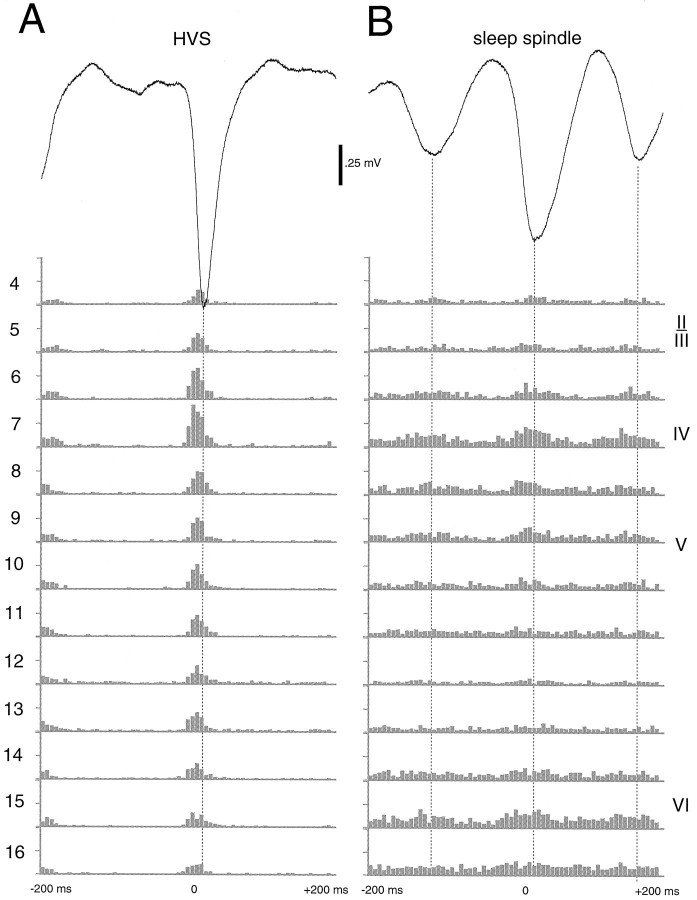
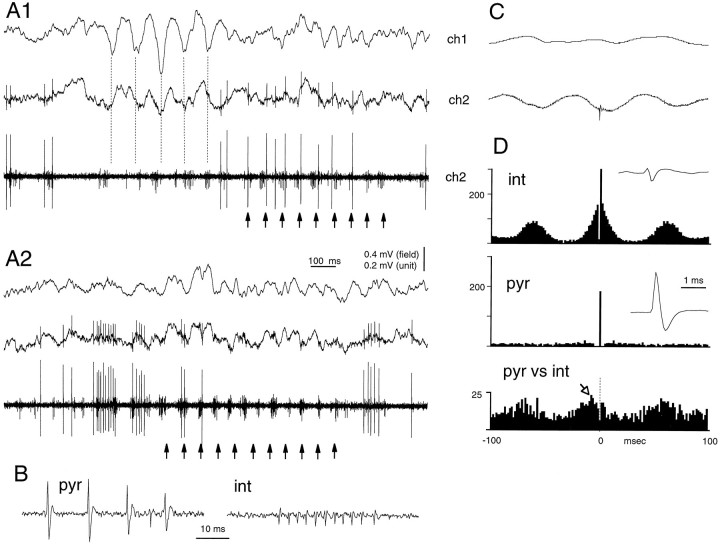
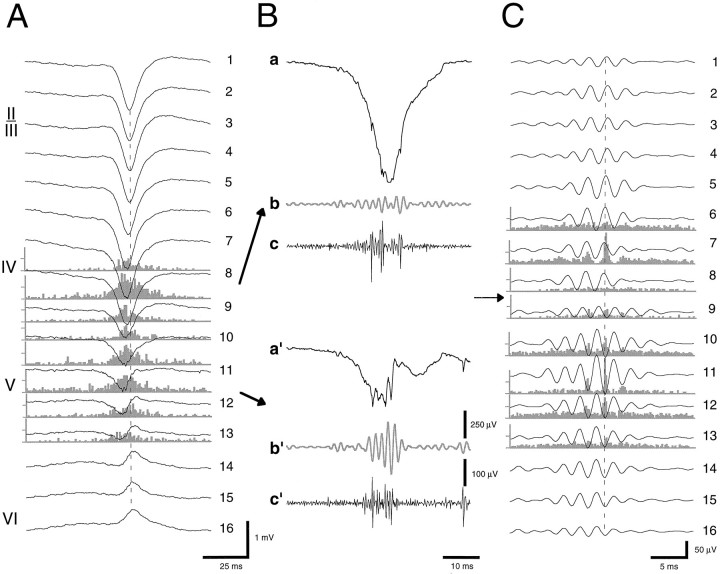
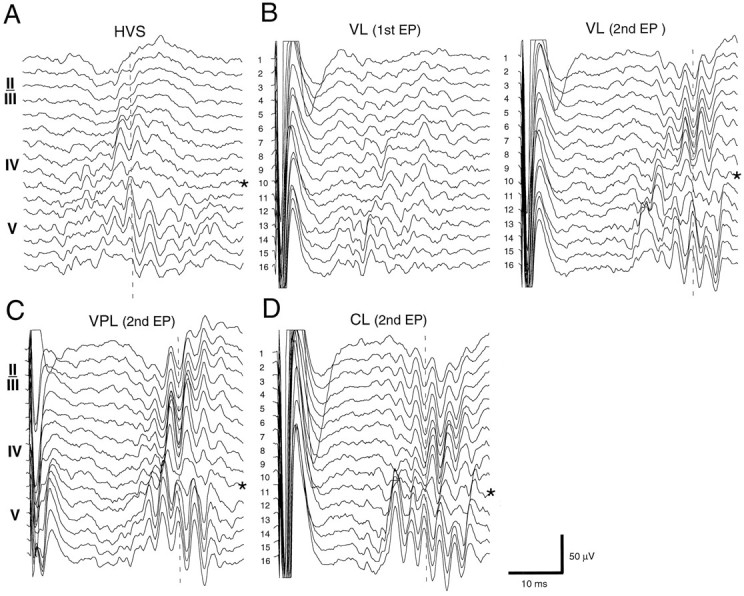
Thalamocortical neuronal oscillations underlie various field potentials that are expressed in the neocortex, including sleep spindles and high voltage spike-and-wave patterns (HVSs). The mechanism of extracellular current generation in the neocortex was studied in the anesthetized and awake rat. Field potentials and unit activity were recorded simultaneously along trajectories perpendicular to the cortical layers at spatial intervals of 100 microm by multiple-site recording silicon probes. Current source density (CSD) analysis revealed that the spatial positions of sinks in layers IV, V-VI, and II-III and of the accompanying sources were similar during sleep spindles, HVSs, and thalamic-evoked responses, although their relative strengths and timings differed. The magnitude and relative timing of the multiple pairs of sinks and sources determined the amplitude variability of HVSs and sleep spindles. The presence of temporally shifted dipoles was also supported by the time distribution of unit discharges in different layers. Putative interneurons discharged with repetitive bursts of 300-500 Hz. The spike component of HVSs was associated with fast field oscillations (400-600 Hz "ripples"). Discharges of pyramidal cells were phase-locked to the ripples. These findings indicate that the major extracellular currents underlying sleep spindles, HVSs, and evoked responses result from activation of intracortical circuitries. We hypothesize that the fast field ripples reflect summed IPSPs in pyramidal cells resulting from the high frequency barrage of interneurons.


Figures

Fig. 1.
Fig. 1.
Multiple-site recording of field and unit activity in the awake rat. Histological section, The in situ location of the silicon probe and the recording sites in relation to the different cortical layers of the somatosensory area.Traces 1–16 (1 Hz–5 kHz), Three cycles of an HVS episode. Vertical lines indicate the presence of three putative dipoles contributing to the spike component of the HVS: dipole1, early surface-positive component; dipole 2, maximum negative potential in layer IV; and dipole 3, delayed surface-negative component. Dipole 3′ was occasionally observed as a separate event. Note both temporal and amplitude variation of the dipoles during successive spike-and-wave events. Arrows denote unit activity. cc, Corpus callosum.
Fig. 2.
Fig. 2.
Voltage versus depth profiles superimposed onto CSD maps of HVSs and thalamic-evoked responses in rats under ketamine anesthesia and in the awake rat. The 16-site recording probe was located in the somatosensory area. The approximate positions of the different layers are indicated left of the CSD maps. Note the overall similarity of the major sinks and sources of the averaged HVSs (n = 50) and evoked responses (n = 8). Major sinks are numbered (1–4 in HVSs). Vertical dashed lineshelp identify the earliest sinks and sources. VPLi, Primary response; VL and VPLc, augmenting responses 200 msec after the primary response (data not shown). InVL, weak early sinks can be identified in layers VI and V, followed by major sinks at locations similar to those of sinks in the other CSD maps. Delayed sinks in layers II and III are marked byblack arrows. Stimulating sites are shown in thehistological section (arrows). The tip of the ipsilateral VPL (VPLi) was two sections (120 μm) posterior to the VL site. An electrolytic lesion was produced at the contralateral VPL (VPLc) stimulating site. Voltage and current calibrations are identical in all panels.iso, Baseline isopotential. Yellow arrows, Thalamic stimulus.
Fig. 3.
Fig. 3.
Localization of amplitude maxima of HVSs and evoked potentials. A, Traces1–3 are averages of HVSs (n = 100) and evoked potentials in response to VPL and CeM stimulation (n = 8). B, The histological section indicates the tips of the recording electrodes 1–3 (20 μm tungsten wires). The amplitude maxima of both HVSs and VPL-evoked potentials were found in layer IV. Note that at these depth levels (1, 2, and 3) the CeM-evoked response was already fully reversed in phase, suggesting that current generators responsible for this response are more superficial to the VPL-induced potential.
Fig. 4.
Fig. 4.
Relationship between thalamic stimulation-induced late potential and HVSs and sleep spindles in the anesthetized (Ketamine) and awake rat. A,a, Two superimposed averages (n = 8) of VPL-evoked responses. Open arrow with dashed line, late potential. b, Averaged HVSs (n = 50). c, Interval histogram of the spike components of HVSs. Note that the average interspike interval is shorter than the latency of peak negativity of the late potential.B, ac, Same rat used inA analyzed under the same conditions in the unanesthetized state. a, Black andopen arrows with dotted and dashed lines; Late potentials at ∼ 100 and 200 msec, respectively. Note that in the unanesthetized animal both the interspike interval and the latency of the late potential (200 msec) were shorter. C, Averaged sleep spindle (b) and interpeak interval histogram (c) of the sleep spindles. Note that the interpeak interval is shorter than the latency of the first late potential (100 msec). Downward arrows, Thalamic stimulus.
Fig. 5.
Fig. 5.
Variations in the voltage-versus-depth profiles and CSD maps of HVSs in the awake rat. A, CSD map of a single HVS episode (3 sec sweep). The superimposed field traces were recorded from layers II, IV, and VI, respectively. Note the consistent presence of the layer IV sink but the large variability of sinks and sources at other depth locations. B, Selected averages of HVS traces and corresponding CSD maps. all, Averages of 200 successive events; ppHVS, average HVS with prominent surface-positive spike component; pHVS, average HVS with less pronounced surface-positive component;nnHVS, average HVS with dominant surface-negative spike component and large sink in layers II–III; nHVS, average HVS with negative spike component in layer IV; andDS, average HVS with double spike components at short interspike intervals. Note a prominent delayed sink in layers II–III in ppHVS and nnHVS. Averages from 40 to 50 traces were selected from a 5 min recording session. Representative single events of the averages are indicated by vertical lines in A. iso, Baseline isopotential.
Fig. 6.
Fig. 6.
Vertical spread of unit recruitment during HVS. Simultaneous recording of unit activity from 12 recording sites (5–16) during two field spike events (Aand B) of an HVS episode. Ketamine anesthesia. Field activity was recorded from layers II–III (site 4). Recruitment of neurons in different layers could occur virtually simultaneously (A) or recruitment of neurons in superficial and deep layers can be delayed (B).Arrows, Onset of multiple-unit discharge. The late discharge of neurons in layers II–III corresponded to the late surface-negative potential in the field (Fig. 1, dipole3).
Fig. 7.
Fig. 7.
Averages of simultaneously recorded HVSs (A) and sleep spindles (B) in different layers at the same electrode position. C, One-dimensional CSD depth profiles of the spike and wave components of HVSs and corresponding surface-negative and surface-positive components of sleep spindles (continuous and dashed lines, respectively). Note the similar position but different magnitude of sinks and sources during the two different patterns.a1, a2, Spike and wave components of HVSs, respectively;b1, b2, surface-negative and surface-positive components of sleep spindle, respectively.
Fig. 8.
Fig. 8.
Relationship between field and simultaneously recorded unit activity in different layers during HVSs (A) and sleep spindles (B). Field responses are from layer IV. Note the stronger recruitment of neurons during HVSs compared with sleep spindles and the virtually complete suppression of unit discharges during the wave component of HVSs. Note also the relatively weaker modulation of cell discharges in deeper layers during sleep spindles.
Fig. 9.
Fig. 9.
Sleep spindle-associated entrainment of network activity may be spatially limited. A1,A2, Two epochs of spatially circumscribed sleep spindle oscillations. Electrode ch2 was 300 μm deeper (layer V) than electrode ch1 (layer IV). The bottom trace is a high-passed (0.5–5 kHz) derivative of trace ch2. B, A larger putative pyramidal cell (pyr) and a smaller putative interneuron (int) were recorded simultaneously. Note a well developed sleep spindle in layer IV in A1(vertical dashed line). Note, however, that rhythmicity in layer V neurons is better expressed after rather than during the layer IV spindle (arrows). Rhythmicity of the interneuron was more often overt than was the rhythmicity of the field potentials (e.g., A2). The pyramidal neuron occasionally discharged action potentials of decreasing amplitude (complex spike burst in B, pyr). The interneuron fired rhythmic bursts (arrows), often with a 300–500 Hz intraburst frequency (B). C, Fields ch1 and ch2 are spike-triggered averages by the interneuron. D, The autocorrelograms of the interneuron (int) and pyramidal cell (pyr) and cross-correlogram between the interneuron and pyramidal cell (pyr vs int). Note the better phase correlation of the interneuron with the local spindlech2 than with activity recorded from ch1. Note also that the discharge of the interneuron (arrowin pyr vs int) precedes the firing of the pyramidal cell (time 0). Insets, Wide-band (1 Hz–5 kHz) averages of the putative interneuron and pyramidal cell, respectively. Note the short duration action potential of the interneuron.
Fig. 10.
Fig. 10.
HVS-induced fast field oscillations (400–500 Hz ripple). A, Averaged HVS and associated unit firing histograms from layers IV–VI. B, Wide-band (a and a′; 1 Hz–5 kHz), filtered field (b and b′; 200–800 Hz), and filtered unit (c and c′; 0.5–5 kHz) traces from layers IV and V, respectively. C, Averaged fast waves and corresponding unit histograms. The field ripples are filtered (200–800 Hz) derivatives of the wide-band signals recorded from 16 sites. Note the sudden phase-reversal of the oscillating waves (arrows) but the in-phase locking of unit discharges (dashed lines).
Fig. 11.
Fig. 11.
HVS and thalamic stimulation-induced fast field oscillations. A, Filtered trace (200–800 Hz) of a single spike event of an HVS. B–D, Averages of filtered (200–800 Hz; n = 8) evoked responses to double pulse stimulation of VL, VPL, and CLnuclei of the thalamus (100 msec intervals). In C andD, only the second, augmented responses are shown. Note the sudden phase-reversal of the oscillation in both HVSs and evoked responses (EP) (vertical dashed lines) at recording site 11 (asterisks).

References

    1. Amstrong-James M, Welker E, Callahan CA. The contribution of NMDA and non-NMDA receptors to fast and slow transmission of sensory information in the rat SI barrel cortex. J Neurosci. 1993;13:2149–2160. - PMC - PubMed
    1. Andersen P, Andersson SA. Physiological basis of the alpha rhythm (Towe A, ed). Appleton-Century-Crofts; New York: 1968.
    1. Bal T, von Krosigk M, McCormick DA. From cellular to network mechanisms of a thalamic synchronized oscillation. In: Buzsáki G, Llinás R, Singer W, Berthoz A, Christen Y, editors. Temporal coding in the brain. Springer; Berlin: 1994. pp. 129–143.
    1. Bode-Greuel KM, Singer W, Aldenhoff JB. A current source density analysis of field potentials evoked in slices of visual cortex. Exp Brain Res. 1987;69:213–219. - PubMed
    1. Bragin A, Jandó G, Nádasdy Z, Hetke J, Wise K, Buzsáki G. Gamma (40–100 Hz) oscillation in the hippocampus of the behaving rat. J Neurosci. 1995;15:47–60. - PMC - PubMed

Publication types

LinkOut - more resources