. 1997 Aug 19;94(17):9114-8.
doi: 10.1073/pnas.94.17.9114.

A micromachined device provides a new bend on fibroblast traction forces

Affiliations

A micromachined device provides a new bend on fibroblast traction forces

C G Galbraith et al. Proc Natl Acad Sci U S A. .

Abstract

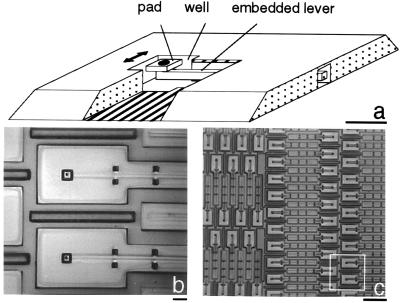
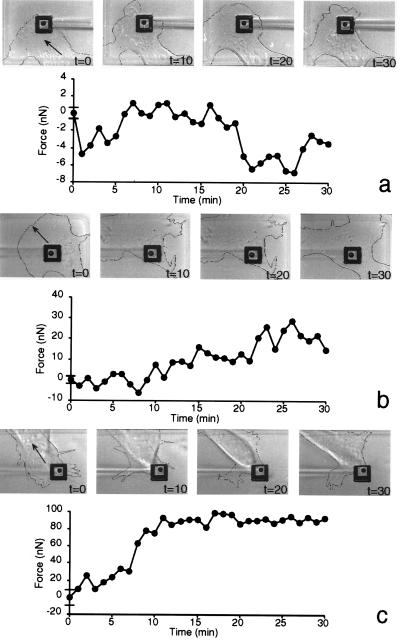
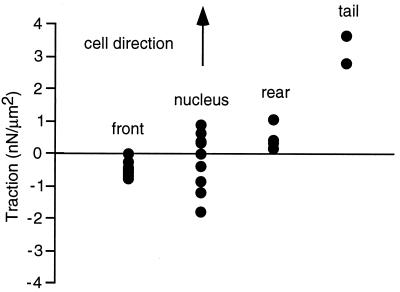
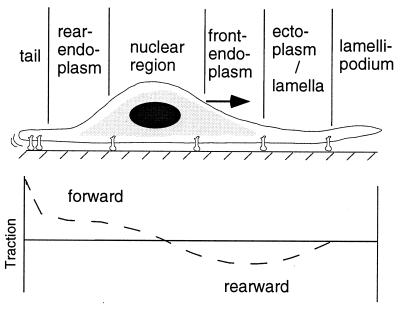
We have measured the traction forces generated by fibroblasts using a novel micromachined device that is capable of determining the subcellular forces generated by individual adhesive contacts. The front of migrating fibroblasts produced intermittent rearward forces whereas the tail produced larger forward directed forces. None of the forces were steady; they all had periodic fluctuations. The transition between forward and rearward traction forces occurred at the nucleus, not at the rear of the cell or the border between the endoplasm and the ectoplasm. We propose that the coupling of lamella extensions to fluctuating rearward tractions in front of the nuclear region move the front of a fibroblast forward, while force-facilitated release of rear adhesive contacts and anterior-directed tractions allow the region behind the nucleus to advance.


Figures

Figure 1
Figure 1
Different magnifications of the micromachined substrate. (a) A cut-away drawing showing the lever, the pad, and the well. (Bar = 10 μm.) (b) The two largest pads. (Bar = 10 μm.) (c) The 0.18-mm beams. (Bar = 1 mm.) Only the 0.18-mm-long beam was used to measure traction forces in this study. The white square indicates the region of this photo that is presented in b.
Figure 2
Figure 2
Force calculations and measurement noise. (a) A force vector diagram explaining the calculation of the maximum force generated by the cell by dividing the measured force by the sine of the angle the cell makes with the beam. Note that when a broad lamella crosses the beam, the angle perpendicular to the leading edge that crosses the pad is used. (b) A typical trace showing fluctuations in force and the level of measurement noise. Measurement noise was calculated as apparent movement of the beam along its long axis. Fluctuations in force are several-fold greater than measurement noise.
Figure 3
Figure 3
Regional variations in traction forces generated by CEFs migrating on 5-μm pads. Positive forces are oriented with the direction of cell motion, and negative forces are oriented opposite the direction of cell motion. The bars on the ordinate axis indicate the standard deviation of the measurement noise. (a) A series of images of the front leading edge and lamella of a fibroblast moving across a pad on the micromachined silicon substrate displayed at 10-min intervals. The contour of the cell has been outlined for better contrast. (b) Micrographs and traction force generated by the ectoplasm and nuclear region of a fibroblast. (c) Micrographs and traction force generated by the tail region of a fibroblast.
Figure 4
Figure 4
The maximum tractions in different regions of the cells are calculated and plotted according to the sign convention discussed in the text. Tractions generated by the front of the cell are opposite the direction of migration (−0.87 ± 0.43 nN/μm2, mean ± SD, n = 10). The maximum tractions oriented opposite to (−1.50 ± 0.75 nN/μm2, n = 4) and with (0.79 ± 0.41 nN/μm2, n = 5) the direction of cell migration were recorded under the nuclear region of the cell. The tractions under the rear (0.99 ± 0.47 nN/μm2, n = 4) and tail (3.91 ± 1.37 nN/μm2, n = 2) of the cell are oriented in the same direction as cell movement.
Figure 5
Figure 5
Immunofluorescent images of integrin and actin-myosin distribution in CEFs on micromachined devices. (a) CEF plated on a laminin coated micromachined substrate and stained for anti-β-1 integrin. The image was taken at the plane where the pad was in focus. The pad “bleeds through” the fluorescent image and is enclosed in a gray square. Only a few punctate spots are present over the pad. (Bar = 5 μm.) (b) CEF plated on a laminin-coated micromachined substrate and stained for F-actin. A reflection image of the substrate has been added to the image to indicate the position of the pad in the upper left hand corner of the cell. The pad has also been enclosed by a gray square. (c) Nonmuscle myosin image of the same cell taken at the same plane of focus as b. Myosin is organized into ribbon-like structures in the front of the cell, is absent from the perinuclear region, and is present in the rear of the cell. (Bar = 5 μm.)
Figure 6
Figure 6
Traction distribution in fibroblasts as measured by the micromachined measuring device. Tractions are negative, indicating that they are against the direction of migration, in the front of the cell, and they increase at the endoplasm/ectoplasm border. Tractions change direction at the nucleus, and in the rear they are positive, indicating that they are along the direction of migration. Large tractions can be generated at the tail region.

References

    1. Wang Y-L. J Cell Biol. 1985;101:597–602. - PMC - PubMed
    1. Abercrombie M, Heaysman J, Pegrum S. Exp Cell Res. 1970;62:389–398. - PubMed
    1. Lee J, Leonard M, Oliver T, Ishihara A, Jacobson K. J Cell Biol. 1994;127:1957–1964. - PMC - PubMed
    1. Oliver T, Dembo M, Jacobson K. Cell Motil Cytoskeleton. 1995;31:225–240. - PubMed
    1. Harris A, Stopak D, Wild P. Nature (London) 1981;290:249–251. - PubMed

Publication types

LinkOut - more resources