. 1997 Aug 19;94(17):9197-201.
doi: 10.1073/pnas.94.17.9197.

Detecting immigration by using multilocus genotypes

Affiliations

Detecting immigration by using multilocus genotypes

B Rannala et al. Proc Natl Acad Sci U S A. .

Abstract

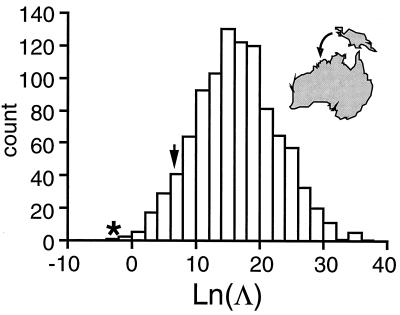
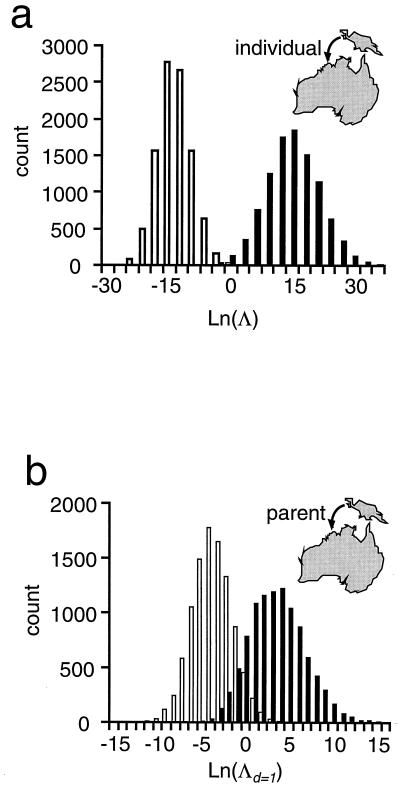
Immigration is an important force shaping the social structure, evolution, and genetics of populations. A statistical method is presented that uses multilocus genotypes to identify individuals who are immigrants, or have recent immigrant ancestry. The method is appropriate for use with allozymes, microsatellites, or restriction fragment length polymorphisms (RFLPs) and assumes linkage equilibrium among loci. Potential applications include studies of dispersal among natural populations of animals and plants, human evolutionary studies, and typing zoo animals of unknown origin (for use in captive breeding programs). The method is illustrated by analyzing RFLP genotypes in samples of humans from Australian, Japanese, New Guinean, and Senegalese populations. The test has power to detect immigrant ancestors, for these data, up to two generations in the past even though the overall differentiation of allele frequencies among populations is low.


Figures

Figure 1
Figure 1
Illustration of Monte Carlo method for examining significance of test statistic ln Λ for comparison of Australian (sample) and New Guinean (potential source) populations. Histogram of 1,000 values of the ln-probability difference generated by simulating genotypes given the allele counts observed for the Australian (sample) population. A total of 72 markers, for which the individual Australian 1 has been typed, were used to generate the distribution. See Eqs. 23–25. The critical region for the test statistic (α = 0.05) is that portion of the distribution to the left of the arrow. The posterior probability ratio (ln Λ = −2.76) for the individual Australian 1 is indicated by an asterisk.
Figure 2
Figure 2
Histograms indicating the power of the immigration tests for two cases. (a) The hypothesis that an Australian individual is an immigrant (d = 0) from New Guinea is considered. The shaded columns represent the distribution of ln Λ generated given the alleles observed for the Australian sample, while the unshaded columns represent the distribution of ln Λ generated given the alleles observed for the New Guinean sample. (b) The hypothesis that one parent of an Australian individual was an immigrant (d = 1) from New Guinea is considered. The shaded columns represent the distribution of ln Λ generated given the alleles observed for the Australian sample, while the unshaded columns represent the distribution of ln Λ generated given the alleles observed for the Australian and New Guinean samples and assuming that the individual received one allele at each locus from each population.

References

    1. Wright S. Genetics. 1931;16:97–159. - PMC - PubMed
    1. Kimura M. Annu Rep Natl Inst Genet. 1953;3:63.
    1. Maruyama T. Theor Pop Biol. 1970;1:273–306. - PubMed
    1. Slatkin M. Annu Rev Ecol System. 1985;16:393–430.
    1. Slatkin M, Barton N H. Evolution. 1989;43:1349–1368. - PubMed

Publication types

LinkOut - more resources