

doi: 10.1073/pnas.94.17.9440.
Orderly cortical representation of vowels based on formant interaction
Affiliations
- PMID: 9256501
- PMCID: PMC23209
- DOI: 10.1073/pnas.94.17.9440
Item in Clipboard
Orderly cortical representation of vowels based on formant interaction
Proc Natl Acad Sci U S A.
.
Abstract
Psychophysical experiments have shown that the discrimination of human vowels chiefly relies on the frequency relationship of the first two peaks F1 and F2 of the vowel's spectral envelope. It has not been possible, however, to relate the two-dimensional (F1, F2)-relationship to the known organization of frequency representation in auditory cortex. We demonstrate that certain spectral integration properties of neurons are topographically organized in primary auditory cortex in such a way that a transformed (F1,F2) relationship sufficient for vowel discrimination is realized.
Figures
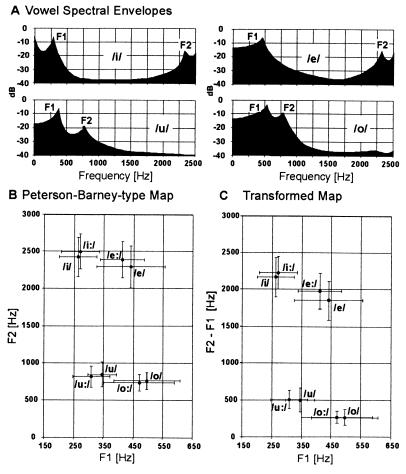
Spectral envelopes (A), Peterson–Barney type map (B), and F2−F1 transformed map (C) for the German vowels/i/,/i:/,/e/, /e:/,/o/,/o:/,/u/, and/u:/. Averages and standard deviations of F1, F2, and F2−F1 across the 50 samples of each vowel were plotted. The transformed map (interaction principle) not only has a gross structure similar to the original Peterson–Barney type map (extraction principle) but also specifically shows a comparable amount of separation of the individual vowels demonstrating the usefulness of the parameter F2−F1 for vowel identification.
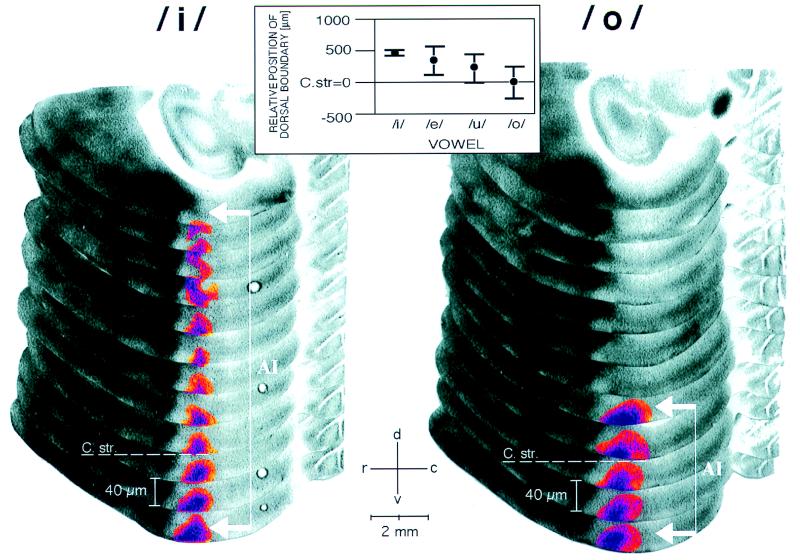
Activity patterns in dorsal auditory cortex evoked by vowels/i/and/o/demonstrated with FDG mapping and reconstruction procedures (26). Autoradiographs of every second serial horizontal section (40 μm per section) of the left hemisphere are mounted in a partially overlapping fashion. Vowel representation in field AI appeared as a dorso-ventral stripe along the isofrequency axis and was highlighted by using a pseudo-color transformation relative to the optical density of the corpus callosum. The dorso-ventral boundary of the labeling was determined as the position where the acitivity peak had completely vanished, measured relative to the dorsal roof of the corpus striatum (C str. dashed line), which serves as a reliable topographic anatomical reference (26). Large formant distances F2−F1, as in/i/, led to stripes that extended far dorsally (white bracket with arrows), whereas stripes obtained with small formant distances, as in/o/, ended close to the dorso-ventral level of the roof of the corpus striatum. r, Rostral; c, caudal; d, dorsal; v, ventral. (Inset) Topographic representation of formant distance F2−F1 along the isofrequency axis in AI. The dorsal boundary of the vowel-evoked FDG labeling was located more ventrally with decreasing formant distance in the sequence/i/,/e/,/u/, and/o/(cf. Fig. 1) and, therefore, provided a topographic measure of the formant distance (ANOVA, P < 0.05).
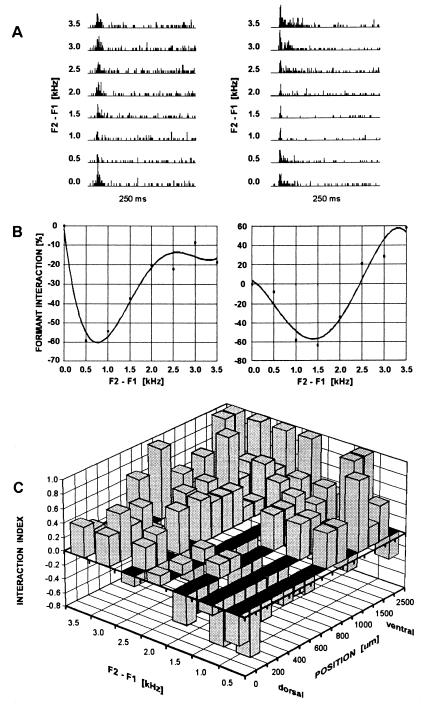
Illustration of neuronal sensitivity to formant interaction and topographic distribution of proportion of summational and inhibitory interactions along the isofrequency axis. (A) Peristimulus time histograms (250 ms; bin width, 1 ms; 10 repetitions) of spike counts from a dorsal unit (Left) and a more ventral unit (Right) responding to eight synthetic 2-formant vowels with variable formant distance F2−F1. At 0.0, responses to F1 alone are shown. (B) Formant interaction profiles of the same units with fourth-order polynomial data fit. Formant interaction at a given formant distance F2−F1 was defined as [r(F2−F1) − r(F1)]/r(F1) × 100%, where r(F1) is the spike count after stimulation with F1 alone and r(F2−F1) is the spike count after addition of F2 at a frequency distance F2−F1. (C) Topographic distribution of summational and inhibitory responses to formant interaction based on 87 units. An interaction index I = (sum − in)/(sum + in), where sum and in are the numbers of occurrences of summational and inhibitory formant interaction, respectively, was plotted as a function of formant distance F2−F1 (0.5-kHz bins) and dorso-ventral position along the isofrequency axis (100-μm bins dorsal to 1000 μm and 250-μm bins ventral to 1000 μm). An I value of +1 corresponds to summational interactions only and an I value of −1 corresponds to inhibitory interactions only. Inhibitory formant interaction occurred most abundantly in dorsal parts of the isofrequency contour for vowels with small formant distances.
Similar articles
-
Neural representation of vowel formants in tonotopic auditory cortex.Neuroimage. 2018 Sep;178:574-582. doi: 10.1016/j.neuroimage.2018.05.072. Epub 2018 May 31. Neuroimage. 2018. PMID: 29860083 Free PMC article.
-
Perception and neural representation of size-variant human vowels in the Mongolian gerbil (Meriones unguiculatus).Hear Res. 2010 Mar;261(1-2):1-8. doi: 10.1016/j.heares.2009.12.016. Epub 2009 Dec 21. Hear Res. 2010. PMID: 20004713
-
Neural Representation of Concurrent Vowels in Macaque Primary Auditory Cortex.eNeuro. 2016 Jun 10;3(3):ENEURO.0071-16.2016. doi: 10.1523/ENEURO.0071-16.2016. eCollection 2016 May-Jun. eNeuro. 2016. PMID: 27294198 Free PMC article.
-
Neural processing and representation of periodicity pitch.Acta Otolaryngol Suppl. 1997;532:68-76. doi: 10.3109/00016489709126147. Acta Otolaryngol Suppl. 1997. PMID: 9442847 Review.
-
Auditory plasticity: vocal output shapes auditory cortex.Curr Biol. 2005 Jul 12;15(13):R503-5. doi: 10.1016/j.cub.2005.06.027. Curr Biol. 2005. PMID: 16005282 Review.
Cited by
-
Neural representation of vowel formants in tonotopic auditory cortex.Neuroimage. 2018 Sep;178:574-582. doi: 10.1016/j.neuroimage.2018.05.072. Epub 2018 May 31. Neuroimage. 2018. PMID: 29860083 Free PMC article.
-
Speech discrimination after early exposure to pulsed-noise or speech.Hear Res. 2012 Jul;289(1-2):1-12. doi: 10.1016/j.heares.2012.04.020. Epub 2012 May 2. Hear Res. 2012. PMID: 22575207 Free PMC article.
-
Cortical activity patterns predict speech discrimination ability.Nat Neurosci. 2008 May;11(5):603-8. doi: 10.1038/nn.2109. Epub 2008 Apr 20. Nat Neurosci. 2008. PMID: 18425123 Free PMC article.
-
Different timescales for the neural coding of consonant and vowel sounds.Cereb Cortex. 2013 Mar;23(3):670-83. doi: 10.1093/cercor/bhs045. Epub 2012 Mar 16. Cereb Cortex. 2013. PMID: 22426334 Free PMC article.
-
A neurophysiological study into the foundations of tonal harmony.Neuroreport. 2009 Feb 18;20(3):239-44. doi: 10.1097/wnr.0b013e32831ddebf. Neuroreport. 2009. PMID: 19444945 Free PMC article.
References
-
- Delattre P, Libermann A M, Cooper F S, Gerstman L J. Word. 1952;8:195–210.
-
- Pickett J M J. Acoust Soc Am. 1957;29:613–620.
-
- Hose B, Langner G, Scheich H. Hear Res. 1983;9:13–25. - PubMed
-
- Rosner B S, Pickering J B. Vowel Perception and Production. Oxford: Oxford Univ. Press; 1994.
-
- Peterson G E, Barney H L. J Acoust Soc Am. 1952;24:175–184.
Publication types
MeSH terms
LinkOut - more resources
Full Text Sources
Miscellaneous
