. 1997 Sep 2;94(18):9520-4.
doi: 10.1073/pnas.94.18.9520.

Linking topography of its potential surface with the dynamics of folding of a protein model

Affiliations

Linking topography of its potential surface with the dynamics of folding of a protein model

R S Berry et al. Proc Natl Acad Sci U S A. .

Abstract

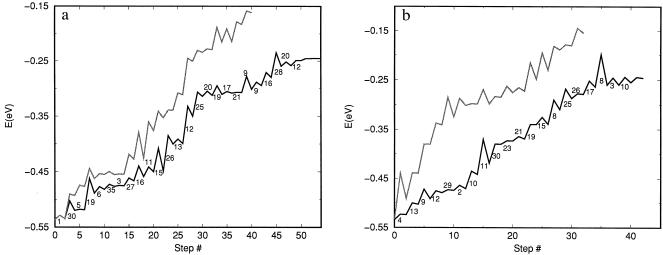
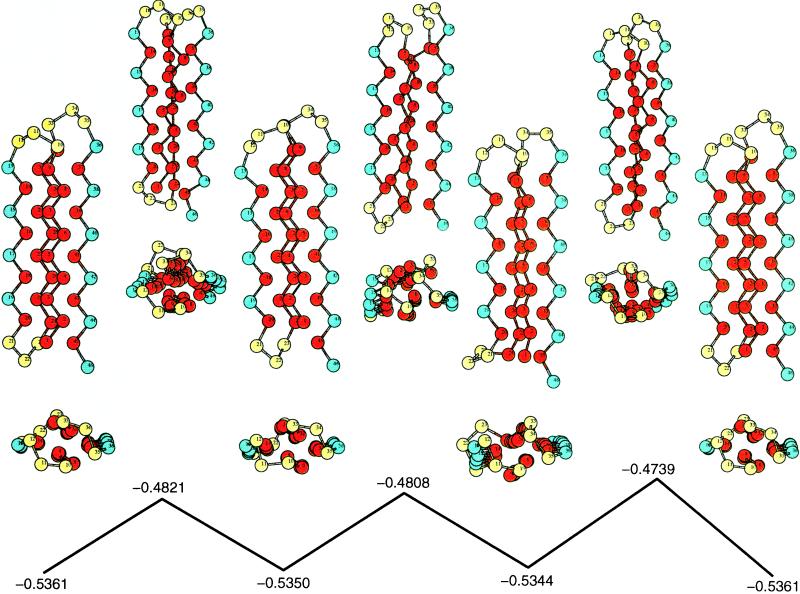
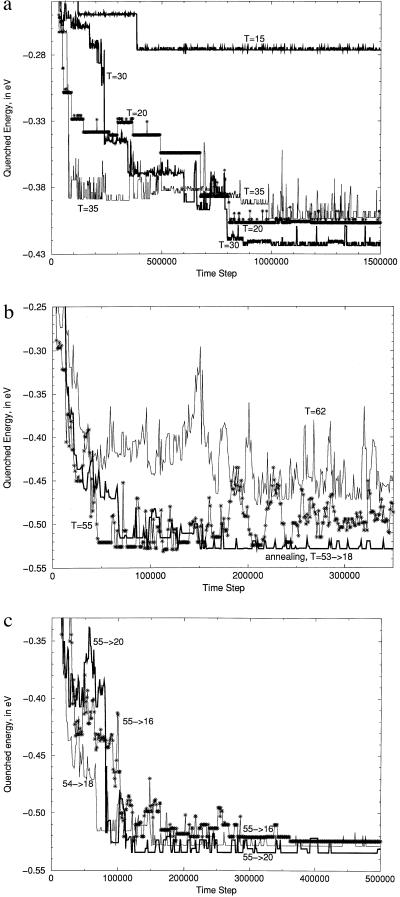
The "3-color, 46-bead" model of a folding polypeptide is the vehicle for adapting to proteins a mode of analysis used heretofore for atomic clusters, to relate the topography of the potential surface to the dynamics that lead to formation of selected structures. The analysis is based on sequences of stationary points-successive minima, joined by saddles-that rise monotonically in energy from basin bottoms. Like structure-seeking clusters, the potential surface of the model studied here is staircase-like, rather than sawtooth-like, with highly collective motions required for passage from one minimum to the next. The surface has several deep basins whose minima correspond to very similar structures, but which are separated by high energy barriers.


Figures

Figure 1
Figure 1
Typical sequences of minima, with their linking saddles, rising monotonically from basin bottoms. (a) Sequences from the global minimum (primary basin). (b) Sequences from the third structure shown in the following figure (secondary basin). The numbers shown for one example in each panel are collectivity indices, the effective number of particles that move as the system passes from one local minimum to the next, along the sequences shown as solid lines.
Figure 2
Figure 2
Structures and energies of the global minimum geometry and two other low-lying, basis-bottom structures of this model, and of the saddles that link them; beneath each “side” view is an “end-on” view, showing how passage between one basin bottom and another occurs by screw-like rotation and translation of one of the strands.
Figure 3
Figure 3
Time histories of quenched energies along typical molecular dynamics pathways taken in the folding process, showing (a) relaxation and descent when the vibrational temperature is relatively low; (b) two isothermal histories showing descent but followed by failure to remain in a single well, if the temperature is relatively high, and a contrasting example of an annealing history from approximately the same initial condition; and (c) three typical annealing histories, each leading to a different deep basin bottom. The time scale is of course scaled; if the masses of all the particles are set at m = 40 da, one time step corresponds to 1 × 10⁻¹⁴ s; the scale increases as formula image.

References

    1. Ball K D, Berry R S, Proykova A, Kunz R E, Wales D J. Science. 1996;271:963–966.
    1. Kunz R E, Berry R S. J Chem Phys. 1995;103:1904–1912.
    1. Kunz R E, Berry R S, Astakhova T. Surf Rev Lett. 1996;3:307–312.
    1. Kunz, R. E., Blaudeck, P., Hoffmann, K. H. & Berry, R. S. (1997), in press.
    1. Vekhter B, Ball K D, Rose J, Berry R S. J Chem Phys. 1997;106:4644–4650.

Publication types

LinkOut - more resources