. 1997 Sep 2;94(18):9797-801.
doi: 10.1073/pnas.94.18.9797.

The Syk and ZAP-70 SH2-containing tyrosine kinases are implicated in pre-T cell receptor signaling

Affiliations

The Syk and ZAP-70 SH2-containing tyrosine kinases are implicated in pre-T cell receptor signaling

A M Cheng et al. Proc Natl Acad Sci U S A. .

Abstract

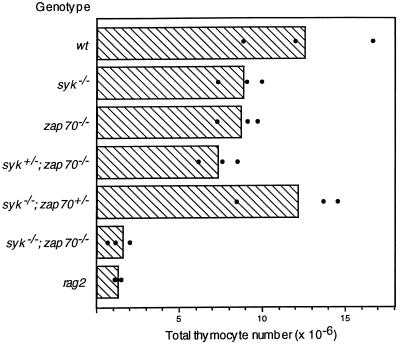
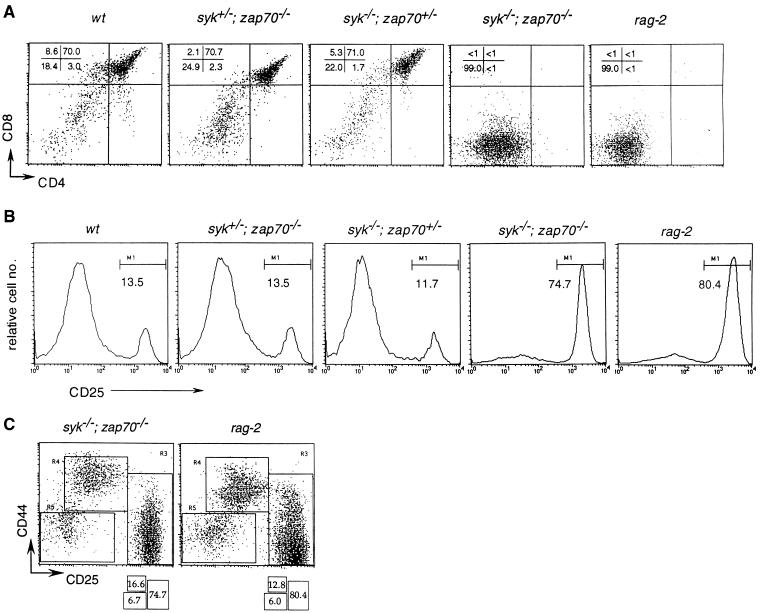
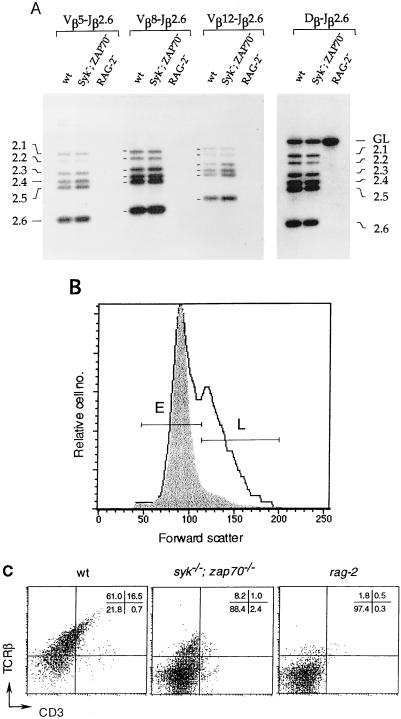
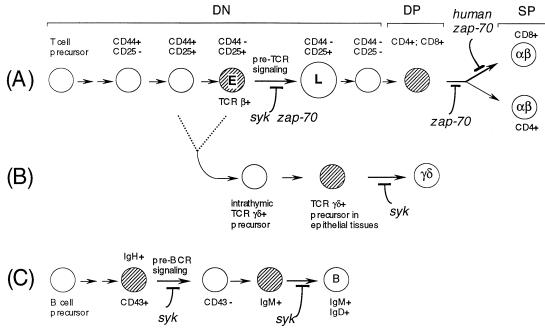
An early stage in thymocyte development, after rearrangement of the beta chain genes of the T cell receptor (TCR), involves expression of the pre-TCR complex and accompanying differentiation of CD4(-)CD8(-) double negative (DN) cells to CD4(+)CD8(+) double positive (DP) cells. The ZAP-70 and Syk tyrosine kinases each contain two N-terminal SH2 domains that bind phosphorylated motifs in antigen receptor subunits and are implicated in pre-T receptor signaling. However, mice deficient in either ZAP-70 or Syk have no defect in the formation of DP thymocytes. Here we show that, in mice lacking both Syk and ZAP-70, DN thymocytes undergo beta chain gene rearrangement but fail to initiate clonal expansion and are incapable of differentiating into DP cells after expression of the pre-TCR. These data suggest that the ZAP-70 and Syk tyrosine kinases have crucial but overlapping functions in signaling from the pre-TCR and hence in early thymocyte development.


Figures

Figure 1
Figure 1
Thymocyte numbers in neonatal mice. The averaged numbers of thymocytes from 1-day-old wild-type (wt) and mutant neonates are plotted in the bar graph as shown. Black dots indicate the actual thymocyte count of each sample.
Figure 2
Figure 2
Arrested thymocyte development in syk−/−; zap-70−/− double mutants. (A) FACScan analysis of thymocytes from 1-day-old neonates with anti-CD4 (fluorescein isothiocyanate) and anti-CD8 (phycoerythrin) antibodies. The percentage of cells in the four quadrants are indicated in the top right-hand corner. (B) FACScan analysis of thymocytes with anti-CD25 (fluorescein isothiocyanate) and anti-CD44 (phycoerythrin) antibodies. Only histograms of CD25 expression are depicted, and the percentage of the CD25+ population in each group is shown under the bar denoted M1. (C) FACScan analysis of thymocytes with anti-CD25 (fluorescein isothiocyanate) and anti-CD44 (phycoerythrin) antibodies. The percentage of cells in the three regions, R3, R4, and R5, are shown in the boxes beneath.
Figure 3
Figure 3
Arrested development of DN thymocytes in syk−/−; zap-70−/− mutant mice. (A) Comparison of the gene rearrangement activity of the TCR β chain locus in wild-type (wt), syk−/−; zap-70−/− mutant, and rag-2 mice. The products of rearrangement, as detected by PCR, between the Vβ or the Dβ gene segments and the Jβ2.1–Jβ2.6 gene segments are indicated. GL marks the PCR products of germ line sequence between Dβ and Jβ2.6 segments. (B) Cell size distribution of CD25+ thymocytes. Total thymocytes stained with CD25 and CD44 antibodies (as described in Fig. 2B) were gated for CD25 expression and analyzed for cell-size distribution base on the forward scatter values. The results from a wild-type (solid line) mouse and a syk−/−; zap-70−/− mutant mouse (shaded area) are overlaid in the histogram as shown. The smaller “E” and the larger “L” subsets are marked. (C) FACScan analysis of thymocytes with anti-CD3 (fluorescein isothiocyanate) and anti-TCR β antibodies. The percentages of thymocytes in the four quadrants are shown in the top right-hand corner.
Figure 4
Figure 4
The roles of Syk and ZAP-70 in B and T cell development. The roles of Syk and ZAP-70 at different points in the development of the αβ T lineage (A), the γδ T lineage (B), and the B cell lineage (C) are depicted. The development of the γδ lineage is derived from the common intermediate T cell precursors as shown in A at a point before pre-TCR signaling (CD44CD25+ “E”). The cell types whose development is most obviously affected by mutations in syk or zap-70 are shaded. This summary is based on the present study and others reported (, –12, 29).

References

    1. Fehling H J, Krotkova A, Saint-Ruf C, von Boehmer H. Nature (London) 1995;375:795–798. - PubMed
    1. Groettrup M, Ungewiss K, Azogui O, Palacios R, Owen M J, Hayday A C, von Boehmer H. Cell. 1993;75:283–294. - PubMed
    1. Saint-Ruf C, Ungewiss K, Groettrup M, Bruno L, Fehling H J, von Boehmer H. Science. 1994;266:1208–1212. . O. N. - PubMed
    1. Iwashima M, Irving B A, Chan A C, Weiss A. Science. 1994;263:1136–1139. - PubMed
    1. Chan, A. C. & Shaw, A. S. (1996) Curr. Opin. Immunol. 394–401. - PubMed

Publication types

MeSH terms