. 1997 Sep;110(3):217-28.
doi: 10.1085/jgp.110.3.217.

Adrenaline stimulates glucagon secretion in pancreatic A-cells by increasing the Ca2+ current and the number of granules close to the L-type Ca2+ channels

Affiliations
Free PMC article

Adrenaline stimulates glucagon secretion in pancreatic A-cells by increasing the Ca2+ current and the number of granules close to the L-type Ca2+ channels

J Gromada et al. J Gen Physiol. 1997 Sep.
Free PMC article

Abstract

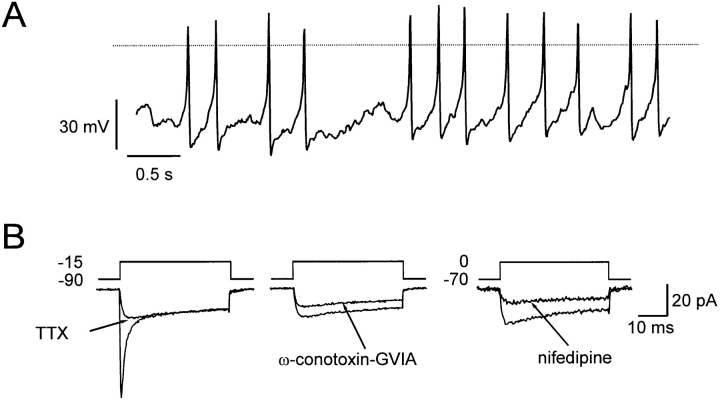
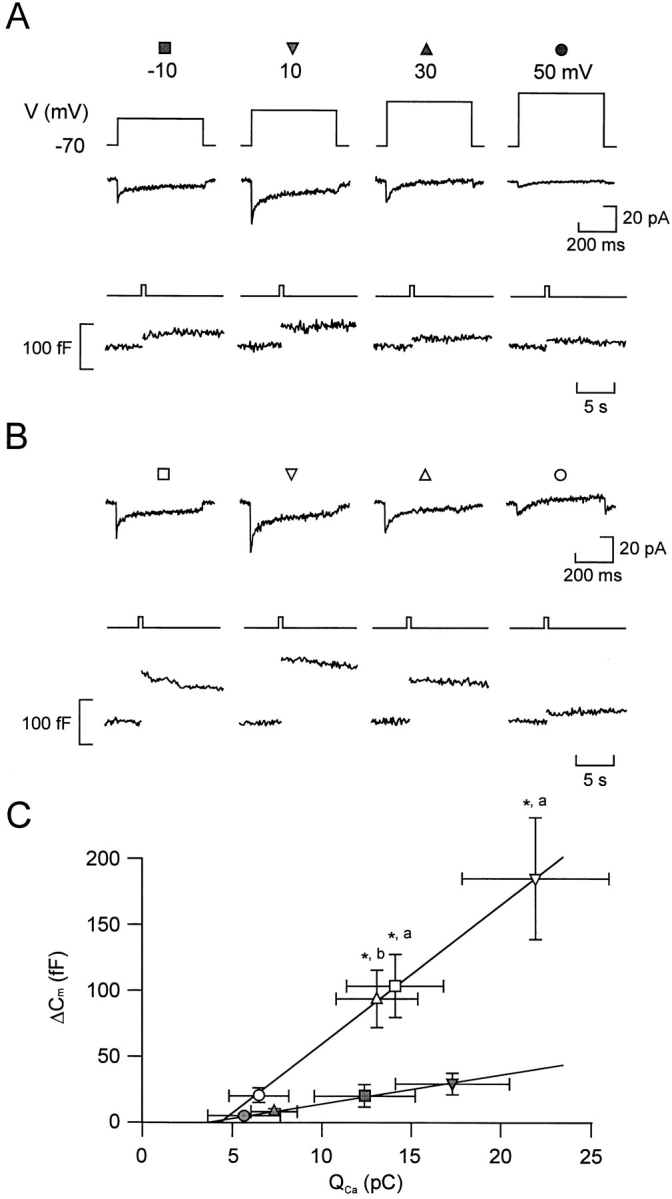
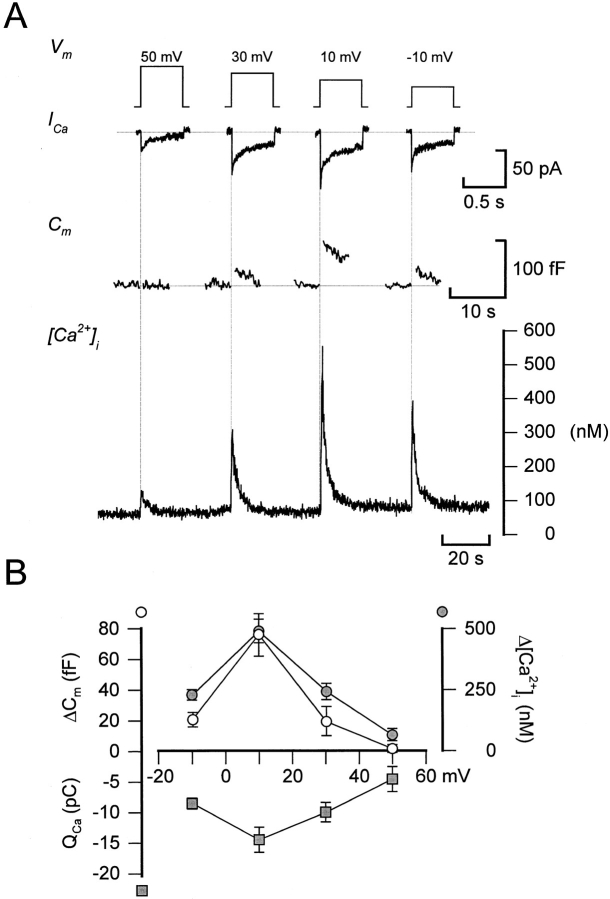
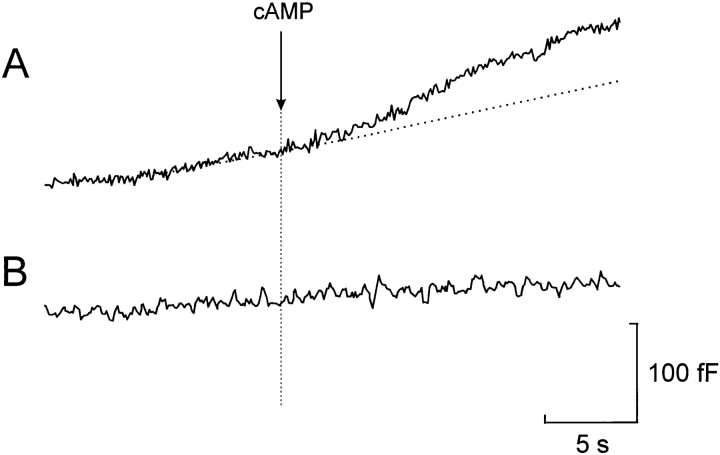
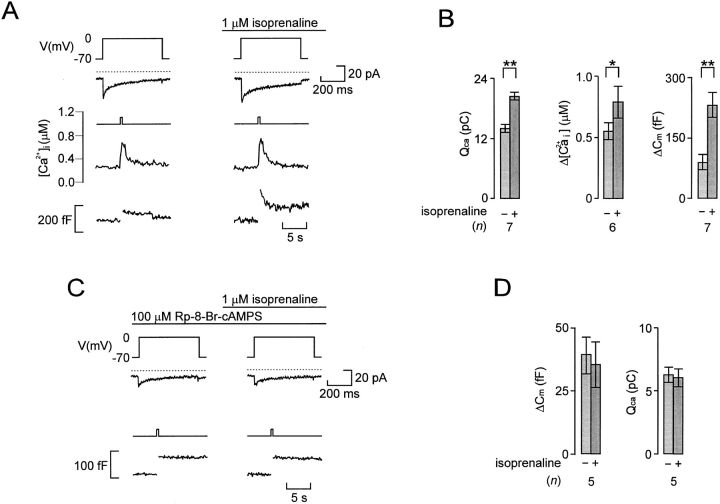
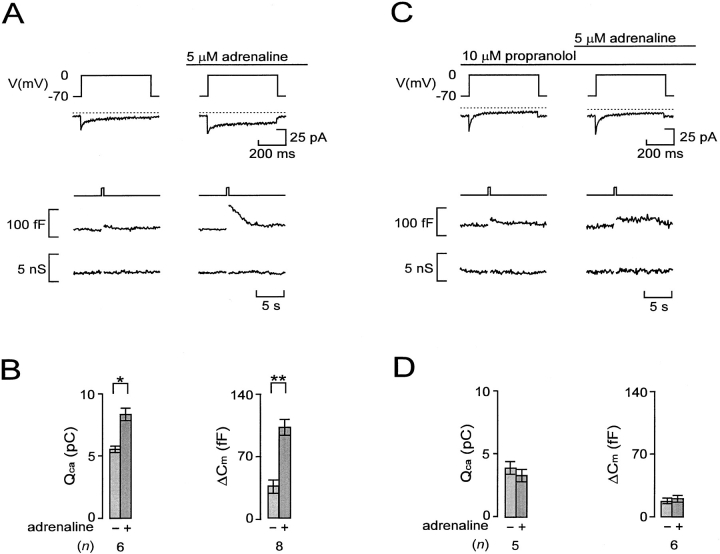
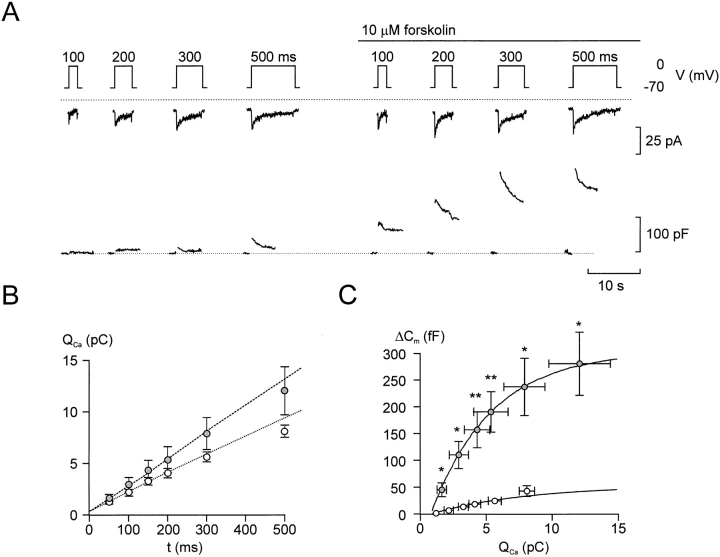
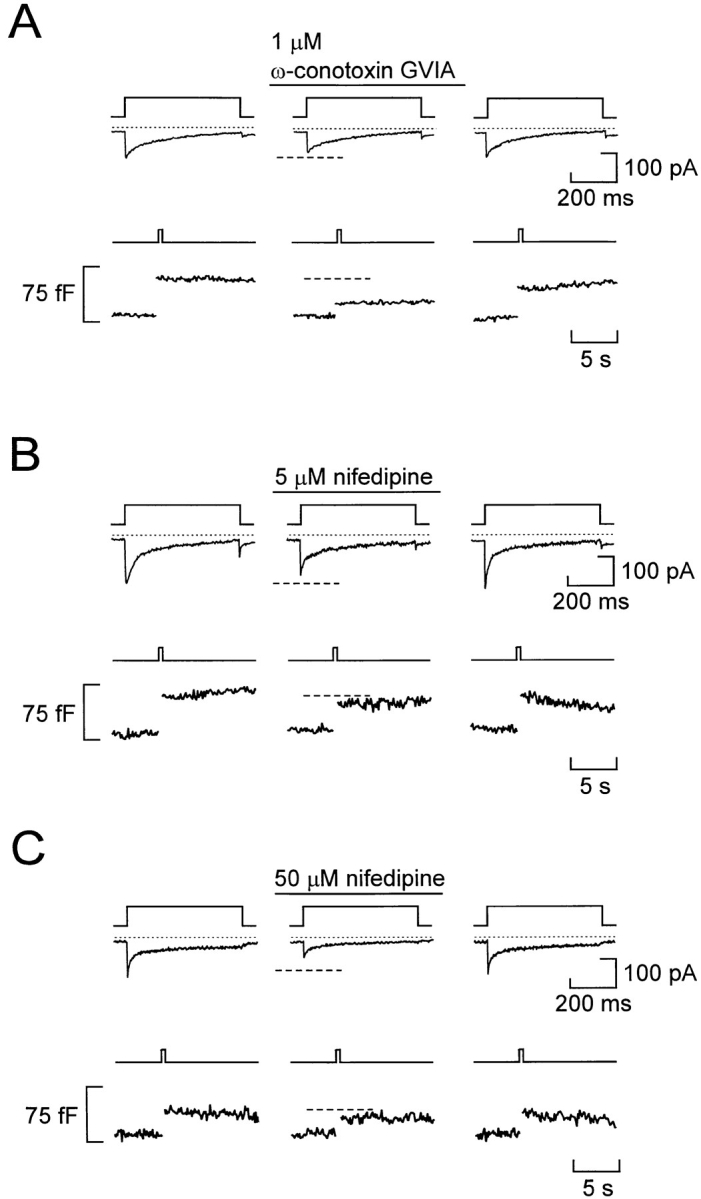
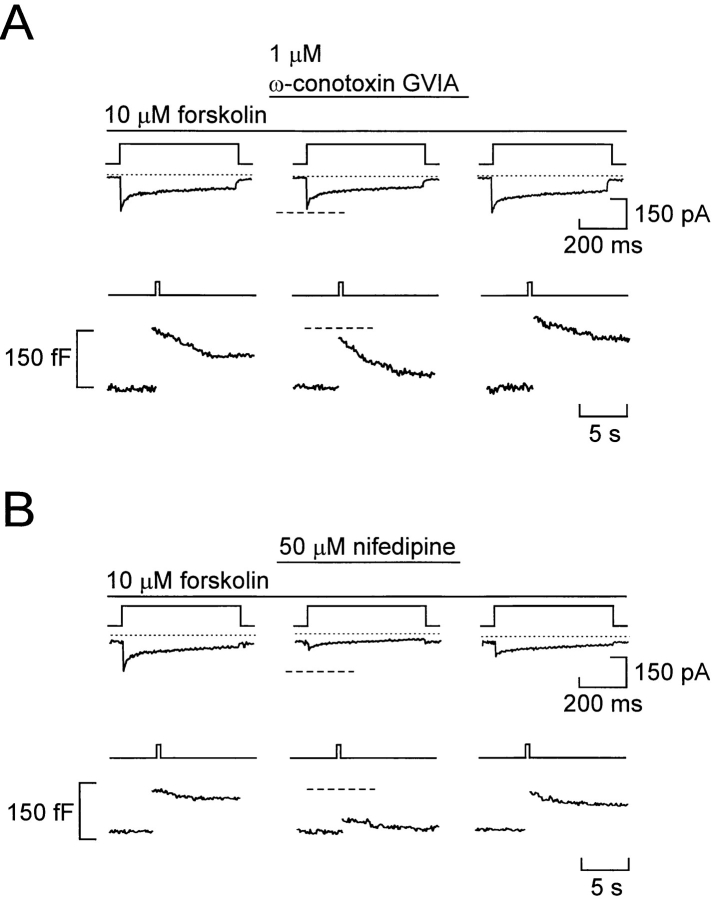
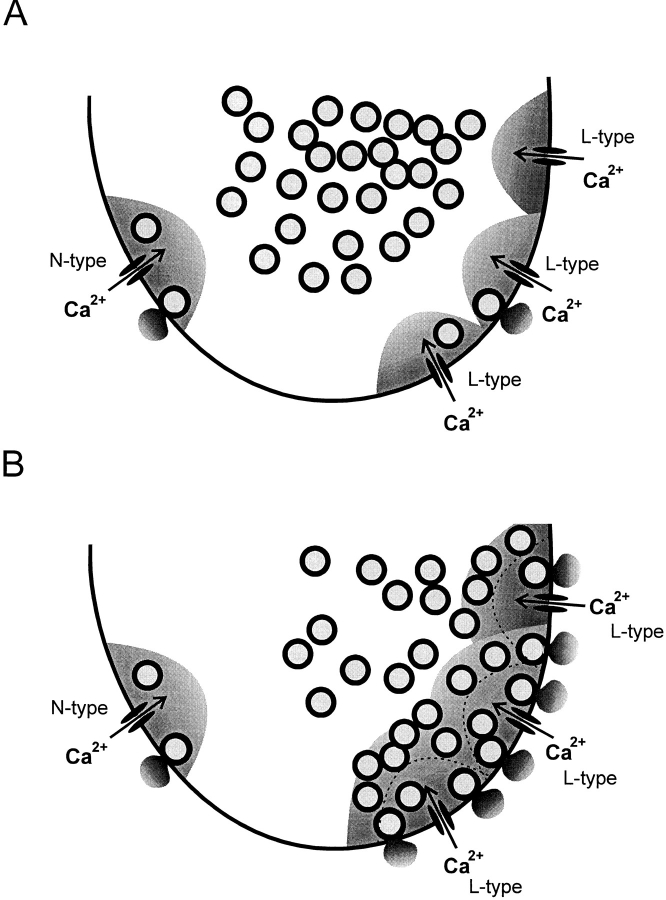
We have monitored electrical activity, voltage-gated Ca2+ currents, and exocytosis in single rat glucagon-secreting pancreatic A-cells. The A-cells were electrically excitable and generated spontaneous Na+- and Ca2+-dependent action potentials. Under basal conditions, exocytosis was tightly linked to Ca2+ influx through omega-conotoxin-GVIA-sensitive (N-type) Ca2+ channels. Stimulation of the A-cells with adrenaline (via beta-adrenergic receptors) or forskolin produced a greater than fourfold PKA-dependent potentiation of depolarization-evoked exocytosis. This enhancement of exocytosis was due to a 50% enhancement of Ca2+ influx through L-type Ca2+ channels, an effect that accounted for <30% of the total stimulatory action. The remaining 70% of the stimulation was attributable to an acceleration of granule mobilization resulting in a fivefold increase in the number of readily releasable granules near the L-type Ca2+ channels.


Figures

Figure 1
Figure 1
Spontaneous electrical activity in isolated rat pancreatic A-cells. (A) Overshooting action potentials generated by single A-cell in the absence of glucose. The dotted horizontal line indicates the zero-voltage level. (B) Voltage-gated inward currents evoked by membrane depolarizations from −90 to −15 mV or −70 to 0 mV as indicated. Presence of voltage-gated Na+ currents and N- and L-type Ca2+ channels revealed by inhibition by tetrodotoxin (0.3 μM) and ω-conotoxin-GVIA (1 μM) observed in the same cell and the inhibition by nifedipine (50 μM) observed in a different cell. Effects of ω-conotoxin-GVIA and nifedipine were tested in the presence of tetrodotoxin.
Figure 4
Figure 4
Relationship between Ca2+ entry and exocytosis. Ca2+ currents (middle) and changes in cell capacitance (bottom) evoked by 500-ms depolarizations from −70 to −10, +10, +30, and +50 mV applied at 30-s intervals before (A) and 2 min after (B) the addition of forskolin. (C) Increases in cell capacitance (ΔCm) displayed against the integrated Ca2+ current (Qca) in the absence (filled symbols) and presence (open symbols) of forskolin. The different symbols refer to the responses evoked by 500-ms depolarizations from −70 to −10 (Δ, ▴), +10 (▿, ▾), +30 (□, ▪), and +50 mV (○, •). Data are presented as mean ± SEM of six separate experiments. The lines represent least-squares fit to the mean values. *P < 0.01 (vs. capacitance increase evoked by the depolarization to the same voltage under control conditions) and a P < 0.01 and b P < 0.02 (vs. integrated Ca2+ current elicited by the same depolarization under control conditions).
Figure 5
Figure 5
Voltage dependence of Ca2+ current amplitude, cytoplasmic Ca2+ transients, and exocytosis. (A). Ca2+ currents (ICa ,, second from top), increases in cell capacitance (Cm ,, second from bottom), and changes in the cytoplasmic Ca2+ concentration ([Ca2 + ]i ) elicited by voltage-clamp depolarizations going from −70 to +50, +30, +10, and −10 mV (top). Depolarizations were 500-ms long and were applied at ∼40-s intervals. (B) Depolarization-evoked integrated Ca2+ currents (QCa  ;, ▪), increases in cell capacitance (ΔCm  ;, ○), and cytoplasmic Ca2+ (Δ[Ca2 + ]i  ;, •) plotted against the voltage during the depolarizing commands.
Figure 7
Figure 7
Stimulation of exocytosis by photorelease of cAMP at fixed internal [Ca2+]i. Effects of photoreleasing ∼30 μM cAMP from a caged precursor at 0.4 μM (A) and 0.17 μM (B) free intra-cellular Ca2+. The dotted line indicates the extrapolated rate of capacitance increase before the photorelease of cAMP in the presence of 0.4 μM [Ca2+]i. The time at which photolysis of caged cAMP was effected is indicated by the vertical line.
Figure 3
Figure 3
β-adrenergic stimulation of Ca2+-dependent glucagon release involves activation of protein kinase A. (A) Simultaneous recordings of Ca2+ currents (second from top) and changes of [Ca2+]i (second from bottom) and membrane capacitance (bottom) evoked by 500-ms depolarizations from −70 to 0 mV (top) before and 2 min after addition of the β-adrenergic agonist isoprenaline. (B) Histograms summarizing the effects of isoprenaline on the amplitude of the [Ca2+]i-transient, the integrated Ca2+-current (QCa), and the depolarization-evoked increase in cell capacitance (ΔCm). (C) Ca2+ currents (middle) and changes in cell capacitance (bottom) evoked by 500-ms depolarizations from −70 to 0 mV before and 2 min after the addition of isoprenaline in the presence of Rp-8-Br-cAMPS (100 μM). In addition, the A-cell had been pretreated with PKA inhibitor for >20 min before the experiment. (D) Lack of effects of isoprenaline on the integrated Ca2+ current (QCa) and the depolarization-evoked increase in cell capacitance (ΔCm) in cells pretreated with Rp-8-Br-cAMPS. In A and C, the dotted lines above the current traces indicate the zero-current level. Data in B and D are mean ± SEM of indicated number (n) of experiments. *P < 0.05; **P < 0.01.
Figure 2
Figure 2
β-adrenergic stimulation of Ca2+-dependent exocytosis in A-cells. (A) Ca2+ currents (second from top), capacitance increases (second from bottom), and membrane conductance (bottom) evoked by 500-ms depolarizations from −70 to 0 mV before and 2 min after the addition of adrenaline. (B) Histograms summarizing the average effects of adrenaline on the integrated Ca2+ current (QCa) and associated increases in cell capacitance (ΔCm). (C) As in A but adrenaline was applied in the presence of the β-adrenergic antagonist propanolol. (D) As in B but data were obtained in the presence of propanolol. In A and C, the dotted lines above the current traces indicate the zero-current level. Data in B and D are mean ± SEM of indicated number (n) of experiments. *P < 0.025; **P < 0.01.
Figure 6
Figure 6
Increasing pulse duration results in saturation of exocytotic responses. (A) Ca2+ currents (middle) and changes in cell capacitance (bottom) evoked by 100-, 200-, 300-, and 500-ms depolarizations from −70 to 0 mV applied at 30-s intervals before (left) and 2 min after (right) the addition of forskolin. (B) Relationship between pulse duration and integrated Ca2+ current (QCa ) in the absence (○) and presence (•) of 10 μM forskolin. The dotted lines are least-squares fits to the mean values of the currents elicited by depolarizations ≤300 ms. Note deviation from linearity at 500 ms. (C) Increases in cell capacitance (ΔCm ) displayed against the integrated Ca2+ current (Qca ) in the absence (○) and presence (•) of forskolin evoked by depolarization between 50 and 500 ms. The data points have been approximated to the equation ΔCm = ΔCmax * {1 − e−([Q − Qmin]/n)} where ΔCm is the observed capacitance increase, ΔCmax is the calculated maximum capacitance increase, Q is the associated charge entry, Qmin the calculated minimum integrated Ca2+ current required to evoke exocytosis and n is a slope factor. The function was approximated to each experiment and the values of ΔCmax, Qmin, and n calculated for each experiment. The fits were based on the responses to depolarizations ≤300 ms. The curves were drawn using the mean values of these parameters. These were (values obtained in the presence of forskolin given within the parentheses) 57 ± 15 fF (288 ± 64 fF), 0.7 ± 0.2 pC (1.0 ± 0.4 pC), and 7.5 ± 1.8 (3.8 ± 0.9) for ΔCmax, Qmin, and n, respectively. Data are mean ± SEM of five experiments. *P < 0.05; **P < 0.01 (vs. capacitance increase evoked by the same depolarization under control conditions).
Figure 8
Figure 8
Differential dependence of basal and stimulated exocytosis on Ca2+ influx through N- and L-type Ca2+ channels under basal conditions. (A) Ca2+ currents (middle) and changes in cell capacitance (bottom) evoked by membrane depolarizations from −90 to 0 mV (top) before and after addition of 1 μM ω-conotoxin-GVIA. (B) Same as A but the holding potential was −70 mV and nifedipine (5 μM) was applied. (C) Same as B but nifedipine was applied at a concentration of 50 μM. The holding potential was varied between −90 and −70 mV to prevent possible voltage-dependent inactivation of the ω-conotoxin–sensitive current. However, varying the holding potential does not influence the magnitude of the integrated Ca2+ current. In a series of five experiments, the integrated Ca2+ currents elicited by depolarizations to 0 mV using holding potentials of −90 and −70 mV amounted to 3.1 ± 0.5 and 2.9 ± 0.5 pC, respectively.
Figure 9
Figure 9
L-type Ca2+ channels mediate Ca2+ influx required for exocytosis in forskolin-stimulated A-cells. (A) Ca2+ currents (middle) and changes in cell capacitance (bottom) evoked by membrane depolarizations from −90 to 0 mV (top) before and after addition of 1 μM ω-conotoxin-GVIA. (B) Same as A, but the holding potential was −70 mV; forskolin (10 μM) was present throughout and the effects of 50 μM nifedipine were tested.
Figure 10
Figure 10
Model explaining the effects of the Ca2+ channel blockers. (A) Under basal conditions, most (65%) of the granules ready for release are localized in the vicinity of the N-type Ca2+ channels and exocytosis of these granules is blocked by addition of ω-conotoxin-GVIA. The shaded areas indicate the domains within which [Ca2+]i rises to concentrations sufficient to trigger exocytosis. Note that there are more L- than N-type Ca2+ channels and the relative scarcity of granules within the domains of the L-type Ca2+ channels. (B) In the presence of forskolin, exocytosis is enhanced because (a) the Ca2+ current is increased and the domains around the L-type Ca2+ channels extend further into the A-cell; and (b) granules that were previously outside the domains have been “mobilized” and brought into closer proximity to the Ca2+ channels. By the combination of these effects, 80% of the releasable granules are now accessed by influx through the nifedipine-sensitive L-type Ca2+ channels. The extent of the domains under control condition is indicated by the dotted lines.

References

    1. Ahrén B, Stern JS, Gingerich RL, Curry DL, Havel PJ. Glucagon secretory response to hypoglycemia, adrenaline, and carbachol in streptozotocin-diabetic rats. Acta Physiol Scand. 1995;155:215–221. - PubMed
    1. Ämmälä C, Ashcroft FM, Rorsman P. Calcium-independent potentiation of insulin release by cyclic AMP in single β-cells. Nature (Lond) 1993a;363:356–358. - PubMed
    1. Ämmälä C, Eliasson L, Bokvist K, Larsson O, Ashcroft FM, Rorsman P. Exocytosis elicited by actions potentials and voltage-clamp calcium currents in individual B-cells. J Physiol (Camb) 1993b;472:665–688. - PMC - PubMed
    1. Artalejo CR, Adams ME, Fox AP. Three types of Ca2+channel trigger secretion with different efficacies in chromaffin cells. Nature (Lond) 1994;367:72–76. - PubMed
    1. Berts A, Gylfe E, Hellman B. Ca2+oscillations in pancreatic islet cells secreting glucagon and somatostatin. Biochem Biophys Res Commun. 1995;208:644–649. - PubMed

Publication types

MeSH terms