. 1997 Sep;110(3):257-81.
doi: 10.1085/jgp.110.3.257.

Allosteric gating of a large conductance Ca-activated K+ channel

Affiliations

Allosteric gating of a large conductance Ca-activated K+ channel

D H Cox et al. J Gen Physiol. 1997 Sep.

Abstract

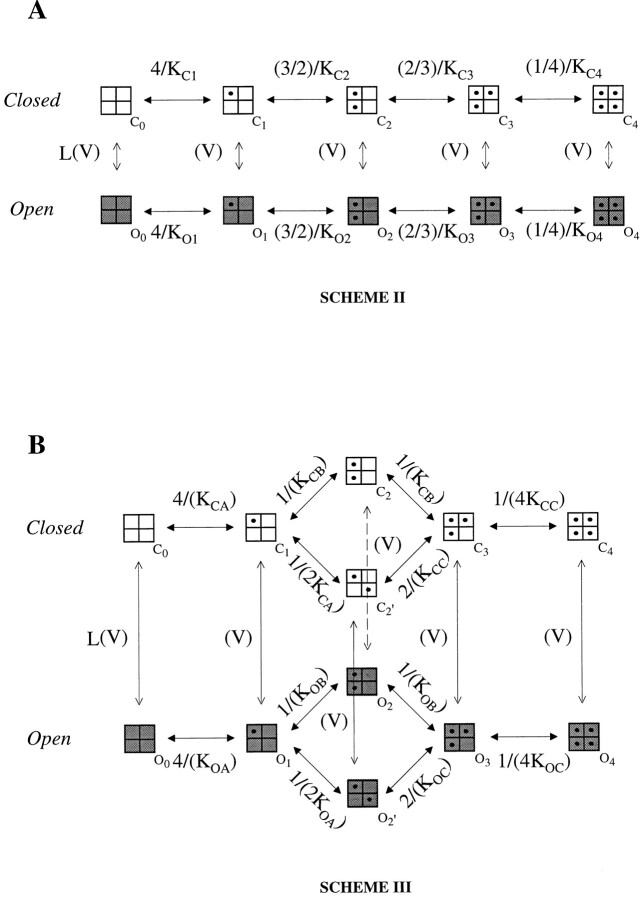
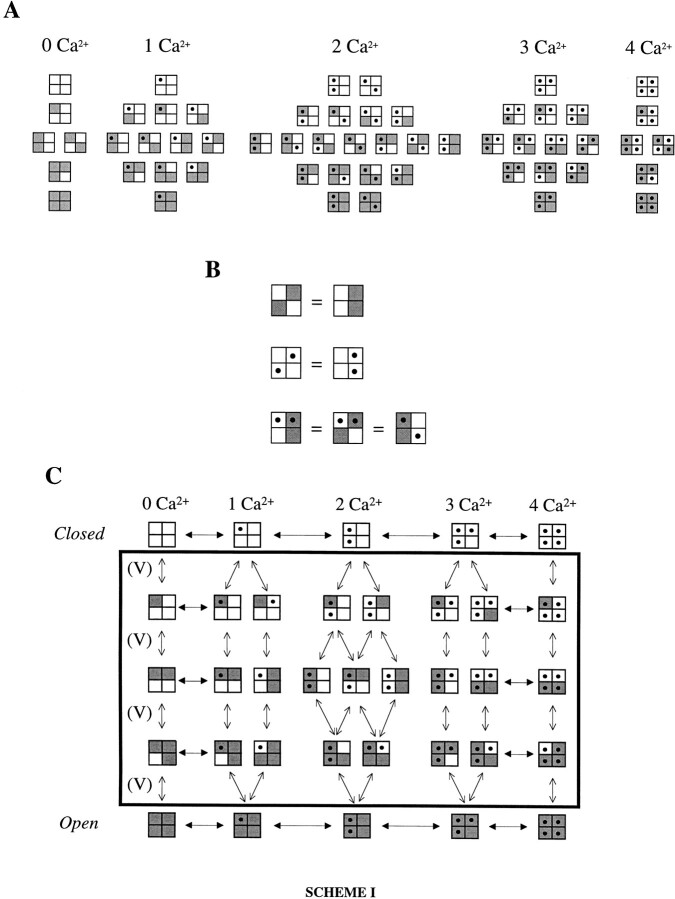
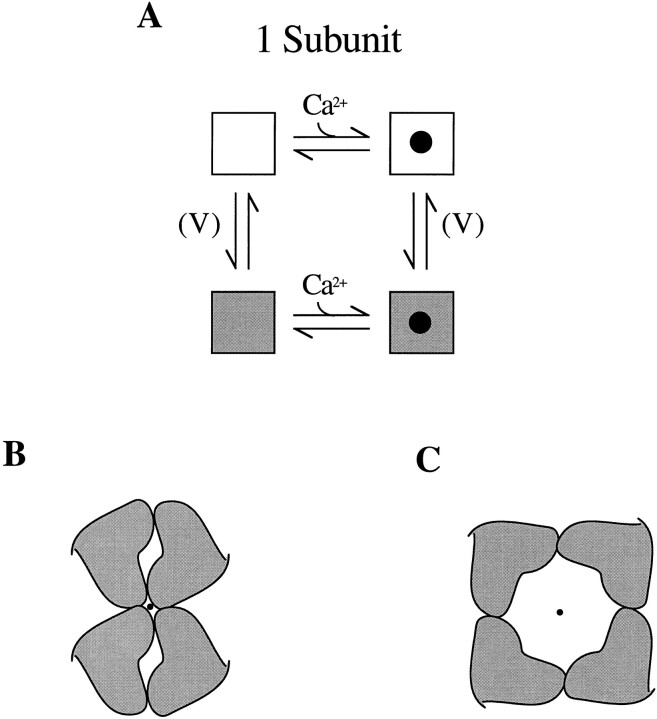
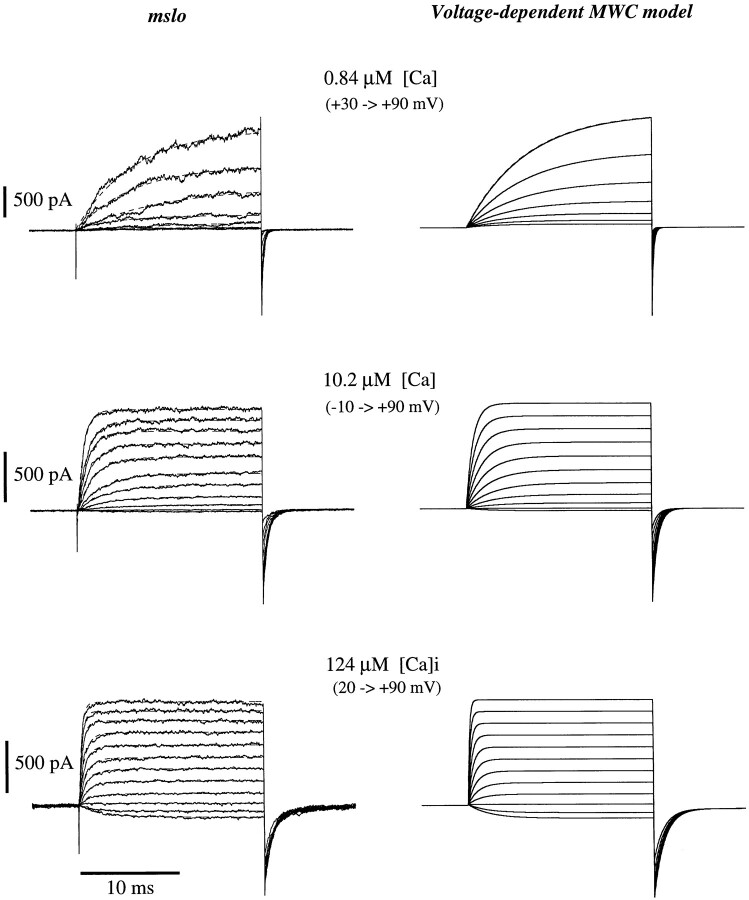
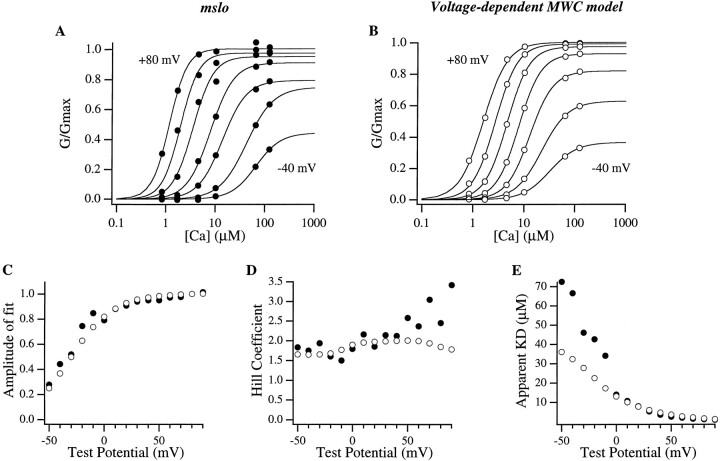
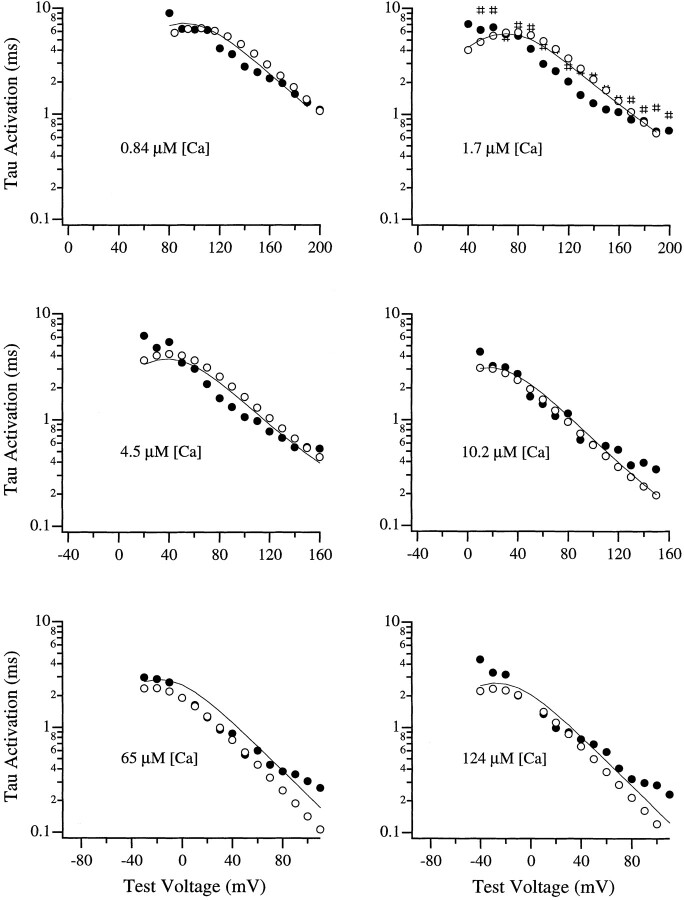
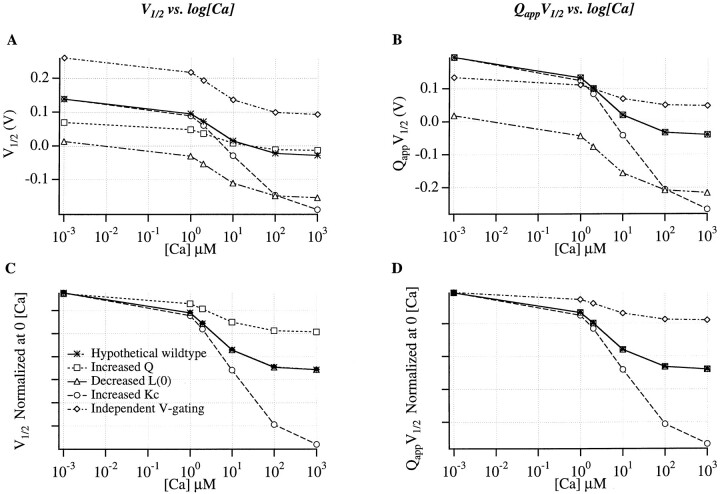
Large-conductance Ca-activated potassium channels (BK channels) are uniquely sensitive to both membrane potential and intracellular Ca2+. Recent work has demonstrated that in the gating of these channels there are voltage-sensitive steps that are separate from Ca2+ binding steps. Based on this result and the macroscopic steady state and kinetic properties of the cloned BK channel mslo, we have recently proposed a general kinetic scheme to describe the interaction between voltage and Ca2+ in the gating of the mslo channel (Cui, J., D.H. Cox, and R.W. Aldrich. 1997. J. Gen. Physiol. In press.). This scheme supposes that the channel exists in two main conformations, closed and open. The conformational change between closed and open is voltage dependent. Ca2+ binds to both the closed and open conformations, but on average binds more tightly to the open conformation and thereby promotes channel opening. Here we describe the basic properties of models of this form and test their ability to mimic mslo macroscopic steady state and kinetic behavior. The simplest form of this scheme corresponds to a voltage-dependent version of the Monod-Wyman-Changeux (MWC) model of allosteric proteins. The success of voltage-dependent MWC models in describing many aspects of mslo gating suggests that these channels may share a common molecular mechanism with other allosteric proteins whose behaviors have been modeled using the MWC formalism. We also demonstrate how this scheme can arise as a simplification of a more complex scheme that is based on the premise that the channel is a homotetramer with a single Ca2+ binding site and a single voltage sensor in each subunit. Aspects of the mslo data not well fitted by the simplified scheme will likely be better accounted for by this more general scheme. The kinetic schemes discussed in this paper may be useful in interpreting the effects of BK channel modifications or mutations.


Figures

Figure 3
Figure 3
(A) Scheme II, two-tiered gating scheme that follows from scheme I if it is supposed that the voltage sensors from each subunit move in a highly concerted way such that their movement can be represented by a single voltage-dependent conformational change. This scheme Is derived from scheme I by eliminating the states in the black box in Fig. 2 C. Those states in the upper tier are designated closed. Those states in the lower tier are designated open. K C1, K C2, K C3, K C4 represent Ca2+ dissociation constants in the closed conformation. K O1, K O2, K O3, K O4 represent Ca2+ dissociation constants in the open conformation. When K C1 = K C2 = K C3 = K C4 and K O1 = K O2 = K O3 = K O4, scheme II represents a voltage-dependent version of the Monod-Wyman-Changeaux model of allosteric proteins (Monod et al., 1965). (B) Scheme III, two-tiered KNF model. The binding of Ca2+ to each tier is supposed to affect the dissociation constants of the sites on adjacent subunits. K CA represents the dissociation constant of a subunit with no neighbors occupied, K CB represents the dissociation constant of a subunit with one neighbor occupied. K CC represents the dissociation constant of a subunit with two neighbors occupied and is determined by K CB 2/K CA. K OA, K OB, and K OC are similarly defined for the open tier.
Figure 2
Figure 2
(A) Schematic representation of the 55 states of a fourfold symmetric homotetrameric channel that follow from the state diagram for each subunit in Fig. 1 A. These states, as well the 73 physically distinct states that a twofold symmetric homotetrameric channel can occupy (not shown), were found by enumeration. Each grouping of states represents those with a different number of Ca2+ ions bound as indicated. (B) Illustration of some equivalent states when no distinction is made between two activated subunits adjacent to one another and two activated subunits diagonally opposed to one another. (C) Scheme I, 35-state channel gating scheme that follows from assumptions 1, 2, and 3 if the simplifying assumption illustrated in B is made. In general, when subunit position is not taken into consideration, the number of states of a homomultimer with r subunits, each subunit of which can exist in n states, is given by the binomial coefficient (n + r − 1: n − 1) (Feller, 1968). Horizontal arrows represent Ca2+ binding steps. For simplicity, not all horizontal steps are represented. Each vertical grouping includes states with a given number of bound Ca2+ as indicated. Each horizontal tier represents a different number of activated voltage sensors.
Figure 1
Figure 1
(A) Schematic representation of the four states of a channel subunit, which follow from assumptions 2 and 3. The filled circles represent the binding of a Ca2+ ion. The change in color from white to grey represents a voltage-dependent conformational change. These conventions are also followed in Figs. 2 and 3. (B) Illustration of an arrangement of four identical subunits that have twofold rotational symmetry about an axis perpendicular to the page passing through the point represented by the black dot. (C) Illustration of an arrangement of four identical subunits that have fourfold rotational symmetry about an axis perpendicular to the page passing through the point represented by the black dot.
Figure 9
Figure 9
mslo (left) and voltage-dependent MWC model (right) traces determined at the indicated [Ca] and membrane voltages. Voltage steps were 20-ms long from the following holding voltages: 0 (0.84 μM [Ca]), −100 (10.2 μM [Ca]), and −120 mV (124 μM [Ca]). In each current family, the voltage increment was 10 mV. Repolarizations were to −80 mV. For display, model and mslo current families were scaled to have the same maximum amplitude at +90 mV. Single exponential fits to the activation time courses are superimposed on both the mslo and model traces. The fits to the model traces are hard to discern as they follow closely the time courses of activation. Data and model are from patch 1 (see Table III).
Figure 4
Figure 4
V 1/2 vs. [Ca] plots highlighting the three patches displayed in Fig. 5. Each data point represents the voltage at which the mslo G-V relation reached half maximal activation at the indicated [Ca]. In A–C, the data are from the same 22 patches; however, in A the V 1/2 values for patch 1 (Fig. 5) are darkened, in B the V 1/2 values for patch 2 (Fig. 5) are darkened, and in C the V 1/2 values for patch 3 (Fig. 5) are darkened.
Figure 5
Figure 5
mslo G-V relations determined from macroscopic currents at the following [Ca]: ∼2 nM (○), 0.84 (•), 1.7 (*), 4.5 (□), 10.2 (▪), 65 (▵), and 124 μM (▴). Data from three patches are displayed (A–C). Solid lines represent best least squares voltage- dependent MWC model fits to these data over the [Ca] range ∼2 nM–124 μM. Parameters for these fits are listed in Table I. The dashed lines represent best overall MWC model fits taking into account both kinetic and steady state data. Parameters for these fits were found by eye and are listed in Table III. Two sets of data recorded with 1.7 μM [Ca] are displayed in A corresponding to the beginning (*) and end (#) of this ∼40-min experiment. The grey symbols are data from 490 (▿), and 1,000 μM (▸◂) [Ca]. Model fits to these data are also included (grey solid and dashed lines). Patch 1 contained ∼100 channels. Patch 2 contained ∼70 channels. Patch 3 contained ∼80 channels. Similar data from patch 2 were displayed in Cui et al. (1997; Fig. 5 A). Typically, three or four voltage families were recorded consecutively and averaged before analysis.
Figure 6
Figure 6
Equilibrium behavior of voltage- dependent MWC models. (A) Model G-V curves at 0, 1, 10, 100, and 1,000 μM [Ca]. The parameters used to generate these curves are indicated on the figure, and are similar to those used to fit the mslo data in Fig. 5 (Table III). (B) The effects of changing Q from 1.4 to 2.8. (C) The effects of changing L(0) from 2,000 to 2. (D) The effects of changing K C from 10 to 100 μM. (E) Plots of V 1/2 vs. log[Ca] for the conditions indicated in A (•), B (□), C (▵), and D (○). (F) At higher voltages, fewer bound Ca2+ are necessary to achieve a given level of open probability. Plotted is open probability (P open) as a function of the mean number of Ca2+ ions bound to the model channel. Each curve represents a different voltage as indicated. Model parameters were the same as in A. Open probability was calculated from Eq. 5. The mean number of Ca2+ ions bound to the model channel (M) was calculated from the relation M = 4(L(K O/K C)([Ca]/K O)(1 + [Ca]/ K C)3 + ([Ca]/K O)(1 + [Ca]/K O)3)/(L(1 + [Ca]/ K C)4 + (1 + [Ca]/K O)4) where L is given by Eq. 3.
Figure 7
Figure 7
(A) Voltage-dependent MWC model, (B) general 10-state model, and (C) two-tiered KNF model least squares best fits to the steady state data of patch 2 (of Fig. 5), with data points at 490 and 1,000 μM included in the fitting. The parameters for the voltage-dependent MWC model fit are: K C = 13.28 μM, K O = 1.17 μM, L(0) = 3,052.5, Q = 1.44e. The parameters for the least squares general 10-state model fit are listed in Table II. The parameters for the two-tiered KNF model fit are: K CA = 0.046 μM, K CB = 1.42 μM, K CC = 43.90 μM, K OA = 0.047 μM, K OB = 0.100 μM, K OC = 0.213 μM, Q = 1.46e, L(0) = 4,328. The dashed lines in B represent a fit to the general 10-state model with the following parameters: K C1 = 9.03 μM, K C2 = 5.97 μM, K C3 = 5.90 μM, K C4 = 135.7 μM, K O1 = 0.68 μM, K O2 = 0.85 μM, K O3 = 1.19 μM, K O4 = 1.65 μM, Q = 1.38e, L(0) = 2,882.5.
Figure 8
Figure 8
mslo (A) and voltage-dependent MWC model (B) Ca2+ dose-response curves are plotted for seven different voltages ranging from −40 to +80 mV in 20-mV steps (symbols). Each curve in A and B has been fitted with the Hill equation (Eq. 8) (solid curves) and the parameters of these fits are plotted as a function of voltage in C, D (see footnote 4), and E. mslo data and fit parameters are indicated with (•). Simulated data and fit parameters are indicated with (○). Data are from patch 1 (Fig. 5 A). The voltage-dependent MWC model parameters used for these simulations are those listed in Table III. Similar data from patch 1 were displayed in Cui et al. (1997) (Fig. 13).
Figure 13
Figure 13
Comparison of mslo and model macroscopic deactivation kinetics over a wide range of conditions. [Ca] are as indicated. mslo (•), voltage-dependent MWC model (○), and general 10-state model (solid lines) currents were fitted with exponential functions starting 200 μs after the beginning of a voltage step to the indicated test voltage from a depolarized voltage where the channels were near maximally activated. The time constants of these fits are plotted as a function of test voltage. Prepulse potentials were: +180 (0.84 μM [Ca]), +160 (1.7 μM [Ca]), +120 (4.5 μM [Ca]), +100 (10.2 μM [Ca]), +90 (65 μM [Ca]), and +90 mV (124 μM [Ca]). Notice the change in range of the voltage axis as [Ca] is increased. Data are from patch 1. The voltage-dependent MWC model parameters are given in Table III. The general 10-state model parameters are given in Fig. 12.
Figure 12
Figure 12
Comparison of mslo and model macroscopic activation kinetics over a wide range of conditions. [Ca] are as indicated. mslo (•), voltage-dependent MWC model (○), and general 10-state model (solid lines) traces were fitted with exponential functions starting 200 μs after the beginning of a voltage step to the indicated test voltage. The time constants of these fits are plotted as a function of test voltage. Two sets of data are displayed for 1.7 μM [Ca], corresponding to data recorded at the beginning (•) and the end (#) of the experiment. Notice the change in range of the voltage axis as [Ca] is increased. Holding voltages were: −50 (0.84 μM [Ca]), −80 (1.7 μM [Ca]), −100 (4.5 μM [Ca]), −100 (10.2 μM [Ca]), −120 (65 μM [Ca]), and −120 mV (124 μM [Ca]). Data are from patch 1. The voltage-dependent MWC model parameters are given in Table III. The general 10-state model parameters are as follows: L(0) = 1,647, Q = 1.40e, K C1 = 10.08 μM, K C2 = 5.22 μM, K C3 = 5.82 μM, K C4 = 70.64 μM, K O1 = 0.890 μM, K O2 = 0.764 μM, K O3 = 0.862 μM, K O4 = 1.52 μM, C0 → O0 = 2.75 s−1, C1 → O1 = 6.0 s−1, C2 → O2 = 32 s−1, C3 → O3 = 165 s−1, C4 → O4 = 1,000 s−1, O0 → C0 = 4,529.2 s−1, O1 → C1 = 872.7 s−1, O2 → C2 = 681.5 s−1, O3 → C3 = 520.1 s−1, O4 → C4 = 67.6 s−1, qforward = 0.70e, qbackward = −0.70e.
Figure 10
Figure 10
Comparison of mslo and voltage-dependent MWC model macroscopic activation kinetics. mslo and model traces are shown normalized to their maximum values and superimposed. [Ca] and membrane voltages are as indicated. Holding voltages for each [Ca] are as stated in the legend to Fig. 9. Data and model are from patch 1 (see Table III).
Figure 11
Figure 11
Comparison of mslo and voltage-dependent MWC model macroscopic deactivation kinetics. mslo and model currents are shown normalized to their values 200 μs after stepping to the indicated voltage from a voltage at which the channels were near maximally activated, and superimposed. Prepulse voltages were +180 (0.84 μM [Ca]), +100 (10.2 μM [Ca]), and +90 mV (124 μM [Ca]). [Ca] are as indicated. Data and model are from patch 1 (see Table III).
Figure 14
Figure 14
Comparison of mslo and voltage- dependent MWC model single channel currents. (Left) mslo data from a single membrane patch. The voltage was held at +50 mV and currents were recorded at the indicated [Ca]. The traces displayed are from consecutive 100-ms time increments. The data were low base filtered at effectively 3.3 kHz before display. (Right) Simulated voltage-dependent MWC model single channel currents generated for the same conditions as the data on the left. The model for patch 1 was used. For parameters see Table III.
Figure 15
Figure 15
The effects of modifications or mutations on model gating behavior. (A) Plots of V 1/2 vs. log[Ca] for a hypothetical wild-type voltage-dependent MWC model channel (•), as well as after four types of modification: an increase in Q to 2.8 (□), a decrease in L(0) to 2 (▵), an increase in K C to 100 μM (○), and elimination of cooperative interactions between voltage-dependent conformational changes (⋄). The parameters for the wild-type model are as in Fig. 6 A. To simulate a loss of cooperativity between voltage-sensing elements, an expression for the equilibrium open probability of scheme I was used with L(0) = (1/2,000)1/4, Q = 0.35, K C = 10 μM, and K O = 1 μM where these parameters represent the properties of each individual subunit. No cooperativity between Ca2+ binding sites or voltage sensing elements was included. (B) Plots of Q app V 1/2 vs. log[Ca] for the same simulated data as in A. Q app was determined from Boltzmann fits to the G-V relations for each case. (C) The plots in A have been shifted so as to have the same V 1/2 value as the hypothetical wild type at 0 [Ca]. (D) The plots in B have been shifted so as to have the same Q app V 1/2 value as the hypothetical wild type at 0 [Ca].

References

    1. Adelman JP, Shen KZ, Kavanaugh MP, Warren RA, Wu YN, Lagrutta A, Bond CT, North RA. Calcium-activated potassium channels expressed from cloned complementary DNAs. Neuron. 1992;9:209–216. - PubMed
    1. Aggarwal SK, MacKinnon R. Contribution of the S4 segment to gating charge in the shaker K+channel. Neuron. 1996;16:1169–1177. - PubMed
    1. Art JJ, Wu YC, Fettiplace R. The calcium-activated potassium channels of turtle hair cells. J Gen Physiol. 1995;105:49–72. - PMC - PubMed
    1. Atkinson NS, Robertson GA, Ganetzky B. A component of calcium-activated potassium channels encoded by the Drosophila slo locus. Science (Wash DC) 1991;253:551–555. - PubMed
    1. Barrett JN, Magleby KL, Pallotta BS. Properties of single calcium-activated potassium channels in cultured rat muscle. J Physiol (Lond) 1982;331:211–230. - PMC - PubMed

Publication types