. 1997 Sep 15;186(6):941-53.
doi: 10.1084/jem.186.6.941.

Impaired CD28-mediated interleukin 2 production and proliferation in stress kinase SAPK/ERK1 kinase (SEK1)/mitogen-activated protein kinase kinase 4 (MKK4)-deficient T lymphocytes

Affiliations

Impaired CD28-mediated interleukin 2 production and proliferation in stress kinase SAPK/ERK1 kinase (SEK1)/mitogen-activated protein kinase kinase 4 (MKK4)-deficient T lymphocytes

H Nishina et al. J Exp Med. .

Abstract

The dual specific kinase SAPK/ERK1 kinase (SEK1; mitogen-activated protein kinase kinase 4/Jun NH2 terminal kinase [ JNK] kinase) is a direct activator of stress-activated protein kinases ([SAPKs]/JNKs) in response to CD28 costimulation, CD40 signaling, or activation of the germinal center kinase. Here we show that SEK1(-/-) recombination-activating gene (RAG)2(-/-) chimeric mice have a partial block in B cell maturation. However, peripheral B cells displayed normal responses to IL-4, IgM, and CD40 cross-linking. SEK1(-/-) peripheral T cells showed decreased proliferation and IL-2 production after CD28 costimulation and PMA/Ca2+ ionophore activation. Although CD28 expression was absolutely crucial to generate vesicular stomatitis virus (VSV)-specific germinal centers, SEK1(-/-)RAG2(-/-) chimeras mounted a protective antiviral B cell response, exhibited normal IgG class switching, and made germinal centers in response to VSV. Interestingly, PMA/Ca2+ ionophore stimulation, which mimics TCR-CD3 and CD28-mediated signal transduction, induced SAPK/JNK activation in peripheral T cells, but not in thymocytes, from SEK1(-/-) mice. These results show that signaling pathways for SAPK activation are developmentally regulated in T cells. Although SEK1(-/-) thymocytes failed to induce SAPK/JNK in response to PMA/Ca2+ ionophore, SEK1(-/-)RAG2(-/-) thymocytes proliferated and made IL-2 after PMA/Ca2+ ionophore and CD3/CD28 stimulation, albeit at significantly lower levels compared to SEK1(+/+)RAG2(-/-) thymocytes, implying that CD28 costimulation and PMA/Ca2+ ionophore-triggered signaling pathways exist that can mediate proliferation and IL-2 production independently of SAPK activation. Our data provide the first genetic evidence that SEK1 is an important effector molecule that relays CD28 signaling to IL-2 production and T cell proliferation.


Figures
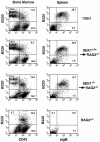
Figure 2
Figure 2
Immunocytometric analysis of B cell populations in the bone marrow (left) and spleen (right) of 129/J, SEK1+/+ chimeric, SEK1−/− chimeric, and RAG2−/− mice. Cells were isolated from 6-wk-old mice and double stained using anti-B220 (PE) and anti-CD43 (FITC), or anti-B220 (PE) and anti-sIgM (FITC). Percentages of positive cells within a quadrant are indicated. Note the partial block in the maturation from CD43+B220+ pro–B cells to CD43B220+ pre–B cells in the bone marrow and the reduced number of sIgM+ B cells in the spleen of SEK1−/− chimeric mice (see also Table 1). 10,000 viable cells were collected and analyzed on a FACScan®. Total cell numbers were: 129/J bone marrow (total lymphoid cells isolated from one femur), 7.9 × 10⁶; 129/J spleen, 4.1 × 10⁷; SEK1+/+ chimeric bone marrow, 8.3 × 10⁶; SEK1+/+ chimeric spleen, 3.1 × 10⁷; SEK1−/− bone marrow, 7.7 × 10⁶; SEK1−/− chimeric spleen, 3.9 × 10⁷; RAG2−/− bone marrow, 9.8 × 10⁶; RAG2−/− spleen, 1.3 × 10⁷.
Figure 1
Figure 1
Proliferation (A and C) and IL-2 production (B and D) of SEK1−/− chimeric (shaded bars) and SEK1+/+ chimeric (open bars) T cells. Purified lymph node responder T cells (105 T cells/well) were activated with (A and B) plate-bound anti–CD3-ε (1 μg/ml) and different concentrations of soluble anti-CD28 Ab (10, 100, and 200 ng/ml) or PMA (12.5 ng/ml) plus Ca2+ ionophore (100 ng/ml) (PMA + Ca); and (C and D) soluble anti–CD3-ε and soluble anti-CD28 Abs at the indicated concentrations. Rabbit anti–hamster Ig-coated plates without addition of anti–CD3-ε (−) or CD28 (0) Abs are shown as controls in (A and B). (C and D) data from two individual SEK1−/− and SEK1+/+ chimeric mice are shown. After 24 h of stimulation, proliferation was determined by [3H]thymidine uptake, and IL-2 production was determined by ELISA. Data of triplicate cultures ± SD are shown. Similar results were obtained after 48 and 72 h of culture (not shown). One result representative of seven independent experiments is shown.
Figure 1
Figure 1
Proliferation (A and C) and IL-2 production (B and D) of SEK1−/− chimeric (shaded bars) and SEK1+/+ chimeric (open bars) T cells. Purified lymph node responder T cells (105 T cells/well) were activated with (A and B) plate-bound anti–CD3-ε (1 μg/ml) and different concentrations of soluble anti-CD28 Ab (10, 100, and 200 ng/ml) or PMA (12.5 ng/ml) plus Ca2+ ionophore (100 ng/ml) (PMA + Ca); and (C and D) soluble anti–CD3-ε and soluble anti-CD28 Abs at the indicated concentrations. Rabbit anti–hamster Ig-coated plates without addition of anti–CD3-ε (−) or CD28 (0) Abs are shown as controls in (A and B). (C and D) data from two individual SEK1−/− and SEK1+/+ chimeric mice are shown. After 24 h of stimulation, proliferation was determined by [3H]thymidine uptake, and IL-2 production was determined by ELISA. Data of triplicate cultures ± SD are shown. Similar results were obtained after 48 and 72 h of culture (not shown). One result representative of seven independent experiments is shown.
Figure 3
Figure 3
PCR analysis for SEK1 mutant and wild-type alleles in total bone marrow and sorted B220+CD43+ and B220+ CD43 bone marrow cells from SEK1−/− and SEK1+/+ chimeric mice. Bone marrow cells were double stained with anti-B220 (PE) and anti-CD43 (FITC) and populations were sorted using a FACS® power sorter (Coulter). Postsorting purity of CD43+ B220+ and B220+CD43 cells was >98%. Purified B cell populations (5 × 10⁴ cells) were subjected to PCR analysis as described in Materials and Methods. Total bone marrow cells (105) (Bone marrow) from 129/J, SEK1−/− chimeric, SEK1+/+ chimeric, and RAG2−/− mice are shown as controls.
Figure 4
Figure 4
B cell activation and immunoglobulin production in SEK1−/− mice. (A) Activation of splenic B cells. Purified splenic B cells (105/well) from SEK1−/− (shaded bars) and SEK1+/+ (open bars) control mice were seeded in medium containing no added stimulus (Control), soluble anti-Igμ Ab (10 μg/ml, clone B76), IL-4 (10 U/ml), soluble anti-CD40 (1 μg/ml), IL-4 (10 U/ml) plus soluble anti-CD40 (1 μg/ml), and 10 μg/ml LPS (LPS). After 24 h, the cells were pulsed for 12 h with 1 μCi [3H]thymidine/well. The experiment shown is one of four experiments in which conditions for stimulation varied (time, cell concentration, concentration of activators). No significant differences (Student's t test; p > 0.05) were observed in the [3H]thymidine uptake between SEK1−/− and SEK1+/+ B cells in response to any of these conditions. [3H]thymidine uptake is shown in cpm ± SD. (B) SEK1−/− mice produce normal levels of serum immunoglobulin subclasses. Sera were collected from two individual 6-wk-old SEK1−/− (shaded bars) and two individual 6-wk-old SEK1+/+ (open bars) chimeric mice. The concentrations of Ig subclasses are shown in μg/ml and were determined by ELISA. Standard deviations were <25 μg/ml.
Figure 4
Figure 4
B cell activation and immunoglobulin production in SEK1−/− mice. (A) Activation of splenic B cells. Purified splenic B cells (105/well) from SEK1−/− (shaded bars) and SEK1+/+ (open bars) control mice were seeded in medium containing no added stimulus (Control), soluble anti-Igμ Ab (10 μg/ml, clone B76), IL-4 (10 U/ml), soluble anti-CD40 (1 μg/ml), IL-4 (10 U/ml) plus soluble anti-CD40 (1 μg/ml), and 10 μg/ml LPS (LPS). After 24 h, the cells were pulsed for 12 h with 1 μCi [3H]thymidine/well. The experiment shown is one of four experiments in which conditions for stimulation varied (time, cell concentration, concentration of activators). No significant differences (Student's t test; p > 0.05) were observed in the [3H]thymidine uptake between SEK1−/− and SEK1+/+ B cells in response to any of these conditions. [3H]thymidine uptake is shown in cpm ± SD. (B) SEK1−/− mice produce normal levels of serum immunoglobulin subclasses. Sera were collected from two individual 6-wk-old SEK1−/− (shaded bars) and two individual 6-wk-old SEK1+/+ (open bars) chimeric mice. The concentrations of Ig subclasses are shown in μg/ml and were determined by ELISA. Standard deviations were <25 μg/ml.
Figure 5
Figure 5
Germinal center formation in SEK1−/− and CD28−/− mice. SEK1−/−, SEK1+/+, and CD28−/− mice were immunized with VSV Indiana (2 × 10⁶ PFU). Serial spleen sections were processed for immunostaining 12 d after immunization as described in Materials and Methods. Original magnifications: (A–I) 200; (J) 400. (A–C) PNA+ cells localize to germinal centers and the marginal zone in (A) SEK1+/+ and (B) SEK1−/− mice. (C) Absence of germinal center formation and germinal center PNA+ B cells in VSV-infected CD28−/− mice. Some PNA+ B cells are present in the marginal zone and the red pulp of CD28−/− mice. (D–F) CD4+ T cells localize mainly to the periarteriolar lymphatic sheaths, but are also present in germinal centers and the follicular mantle zone in (D) SEK1+/+ and (E) SEK1−/− mice. (F) CD4+ T cells in the spleen of VSV-infected CD28−/− mice. (G–I) VSV-specific B cells in germinal centers of (G) SEK1+/+ and (H) SEK1−/− mice. Note the presence of VSV-specific B cells outside the germinal centers that show cytoplasmic staining. These cells are VSV-specific plasma cells (44). (I) VSV-specific germinal centers are absent in VSV-infected CD28−/− mice. (J) VSV-specific plasma cells in VSV-infected CD28−/− mice.
Figure 5
Figure 5
Germinal center formation in SEK1−/− and CD28−/− mice. SEK1−/−, SEK1+/+, and CD28−/− mice were immunized with VSV Indiana (2 × 10⁶ PFU). Serial spleen sections were processed for immunostaining 12 d after immunization as described in Materials and Methods. Original magnifications: (A–I) 200; (J) 400. (A–C) PNA+ cells localize to germinal centers and the marginal zone in (A) SEK1+/+ and (B) SEK1−/− mice. (C) Absence of germinal center formation and germinal center PNA+ B cells in VSV-infected CD28−/− mice. Some PNA+ B cells are present in the marginal zone and the red pulp of CD28−/− mice. (D–F) CD4+ T cells localize mainly to the periarteriolar lymphatic sheaths, but are also present in germinal centers and the follicular mantle zone in (D) SEK1+/+ and (E) SEK1−/− mice. (F) CD4+ T cells in the spleen of VSV-infected CD28−/− mice. (G–I) VSV-specific B cells in germinal centers of (G) SEK1+/+ and (H) SEK1−/− mice. Note the presence of VSV-specific B cells outside the germinal centers that show cytoplasmic staining. These cells are VSV-specific plasma cells (44). (I) VSV-specific germinal centers are absent in VSV-infected CD28−/− mice. (J) VSV-specific plasma cells in VSV-infected CD28−/− mice.
Figure 6
Figure 6
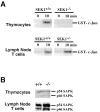
Activation of SAPKs/JNKs in thymocytes (top) and lymph node T cells (bottom). (A) Thymocytes (top) and purified mesenteric lymph node T cells (bottom) were isolated from SEK1+/+ and SEK1−/− mice and cells (5 × 10⁶/lane) were activated with PMA (50 ng/ml) plus Ca2+ ionophore (1 μg/ml) for 0 and 10 min as described in Materials and Methods. SAPK/JNK were immunoprecipitated and assayed for in vitro kinase activity using glutathione-S-transferase–c-Jun as a substrate. Peripheral T cells were purified using affinity columns and purity of CD3+ T cells was >98% as determined by cytometry. One result representative of three independent experiments is shown. (B) Western blotting for p46 and p54 SAPK/JNK isoform expression in SEK1+/+ (+/+) and SEK1−/− (−/−) chimeric thymocytes and purified lymph node T cells. Thymocytes (106/lane) and lymph node cells (5 × 10⁶/lane) were blotted for SAPK expression as described in Materials and Methods (23).
Figure 7
Figure 7
Proliferation (A) and IL-2 production (B) of SEK1−/− (shaded bars) and SEK1+/+ chimeric (open bars) thymocytes. Thymocytes (105 T cells/well) were activated with plate-bound anti–CD3-ε (1 μg/ ml) and soluble anti-CD28 Abs (100 ng/ml; CD3-ε + CD28) or PMA (12.5 ng/ml) plus Ca2+ ionophore (100 ng/ml) (PMA + Ca). Rabbit anti–hamster Ig-coated plates without addition of anti–CD3-ε/CD28 Abs are shown as controls. After 48 h of stimulation, proliferation was determined by [3H]thymidine uptake, and IL-2 production was determined by ELISA. Data of triplicate cultures ± SD are shown. The low IL-2 production of thymocytes after PMA/Ca2+ ionophore stimulation is due the fact that PMA/Ca2+ ionophore also induces proliferation of CD4CD8TCR thymocytes, the majority of which does not produce IL-2. One result representative of three independent experiments is shown.

Similar articles

Cited by

References

    1. Sturgill TW, Ray LB, Erikson E, Maller JL. Insulin-stimulated MAP-2 kinase phosphorylates and activates ribosomal protein S6 kinase II. Nature (Lond) 1988;334:715–718. - PubMed
    1. Boulton TG, Nye SH, Robbins DJ, Ip NY, Radziejewska E, Morgenbesser SD, DePinho RA, Panayotatos N, Cobb MH, Yancopoulos GD. ERKs: a family of protein-serine/threonine kinases that are activated and tyrosine phosphorylated in response to insulin and NGF. Cell. 1991;65:663–675. - PubMed
    1. Ahn NG, Seger R, Bratlien RL, Diltz CD, Tonks NK, Krebs EG. Multiple components in an epidermal growth factor–stimulated protein kinase cascade. In vitro activation of a myelin basic protein/microtubule-associated protein 2 kinase. J Biol Chem. 1991;266:4220–4227. - PubMed
    1. Cowley S, Paterson H, Kemp P, Marshall CJ. Activation of MAP kinase kinase is necessary and sufficient for PC12 differentiation and for transformation of NIH 3T3 cells. Cell. 1994;77:841–852. - PubMed
    1. Treisman R. Regulation of transcription by MAP kinase cascades. Curr Opin Cell Biol. 1996;8:205–215. - PubMed

Publication types

MeSH terms