. 1997 Sep 16;94(19):10426-31.
doi: 10.1073/pnas.94.19.10426.

Excitatory-inhibitory network in the visual cortex: psychophysical evidence

Affiliations

Excitatory-inhibitory network in the visual cortex: psychophysical evidence

Y Adini et al. Proc Natl Acad Sci U S A. .

Abstract

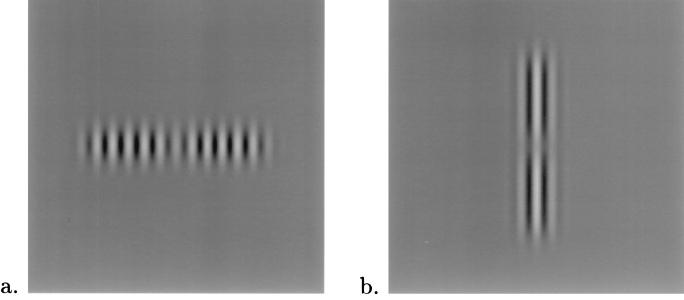
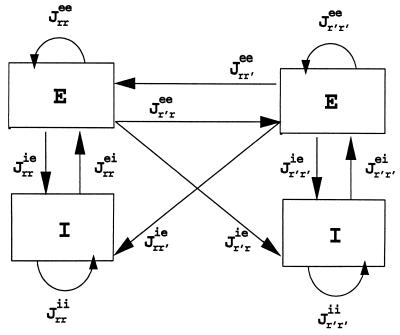
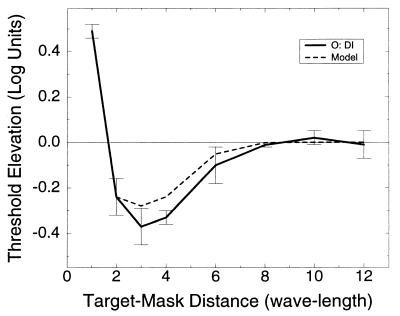
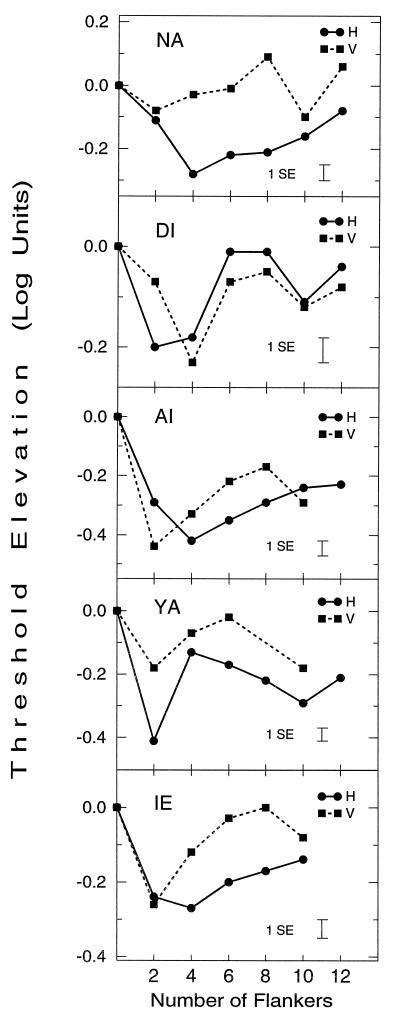
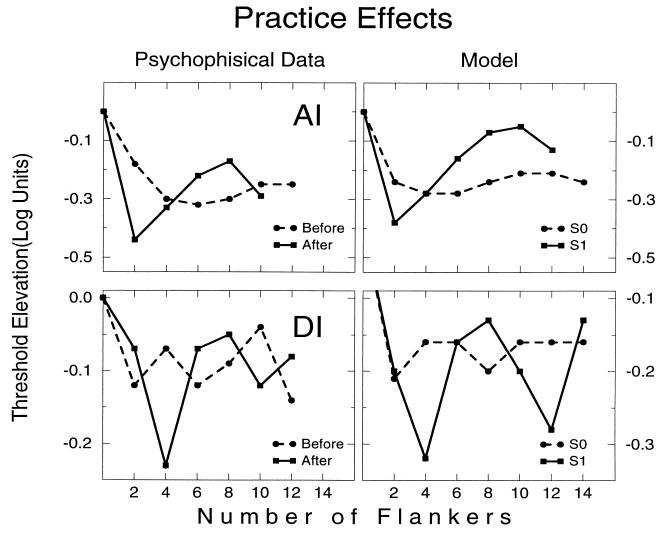
At early stages in visual processing cells respond to local stimuli with specific features such as orientation and spatial frequency. Although the receptive fields of these cells have been thought to be local and independent, recent physiological and psychophysical evidence has accumulated, indicating that the cells participate in a rich network of local connections. Thus, these local processing units can integrate information over much larger parts of the visual field; the pattern of their response to a stimulus apparently depends on the context presented. To explore the pattern of lateral interactions in human visual cortex under different context conditions we used a novel chain lateral masking detection paradigm, in which human observers performed a detection task in the presence of different length chains of high-contrast-flanked Gabor signals. The results indicated a nonmonotonic relation of the detection threshold with the number of flankers. Remote flankers had a stronger effect on target detection when the space between them was filled with other flankers, indicating that the detection threshold is caused by dynamics of large neuronal populations in the neocortex, with a major interplay between excitation and inhibition. We considered a model of the primary visual cortex as a network consisting of excitatory and inhibitory cell populations, with both short- and long-range interactions. The model exhibited a behavior similar to the experimental results throughout a range of parameters. Experimental and modeling results indicated that long-range connections play an important role in visual perception, possibly mediating the effects of context.


Figures

Figure 1
Figure 1
Examples of stimuli used in the chain lateral masking experiments in which target at fixation was embedded within a chain of six high-contrast GSs (three GSs from each side). The left-most and right-most GSs are at 6λ distance from the target. (a) Horizontal configuration. (b) Vertical configuration.
Figure 2
Figure 2
Schematic representation of the connectivity between any two nodes in our model network. Each E–I couple (a node) assumes to be tuned to the same spatial location. The strength of the connections is described in the text.
Figure 3
Figure 3
Dependence of target threshold on the distance between target and flankers. Here only two flankers were used (one on each side) as in ref. . The continuous line depicts the psychophysical data of observer DI, and the broken line shows our model predictions for distances between 2λ and 12λ. Model parameters are set as in Fig. 6, error bars represent ±SE of the mean, each datum point is the average of four measurements. Thresholds are relative to contrast detection threshold of an isolated target. Note that remote flankers (distance > 6λ) had no effect on target visibility.
Figure 4
Figure 4
Dependence of target threshold on the number of flankers and configuration (H and V) for observers NA, DI, AI, YA, and IE. Threshold elevation was computed relative to that of an isolated target. Each datum point is the average of four measurements after practice. The number of flankers reflects the total number of maskers in the chain. All observers show a similar nonmonotonic dependence of detection threshold on the number of flankers for both configurations. (t tests on the difference between first minima and the following maxima show a significant decrease in sensitivity, with P < 0.03 in all cases and P < 0.01 in five cases. Observers DI and YA show a second significant minima.)
Figure 5
Figure 5
The chain depression effect as reflected by the MED values for configurations H (grey) and V (black). MED is a measure of decrease in enhancement as a result of increasing chain length. (a) Results obtained at the early stage of practice. (b) Results obtained at a later phase of practice (for observer DI who had no further practice with the H configuration, we took the results from the first stage of practice).
Figure 6
Figure 6
Psychophysical data versus model simulation for observers AI (Top) and DI (Bottom). Left column shows the dependence of target threshold on the number of flankers at early (before) and late (after) practice phases for observers AI and DI. These results were obtained with the V configuration. Threshold elevation was computed relative to the average threshold of an isolated target. Note the chain depression effect that was developed with practice. The right column gives two examples of model simulations. In the model, we transferred from S0 simulation into S1 simulation by enlarging the inhibitory influences (Jie) more than the excitatory influences (Jee). We changed the relative strength of the connections described in Eq. 4 using two parameters, the J0αβ parameter and the range parameter σαβ. Enlarging the J0αβ parameter enlarges the strength of all the Jrrαβ connections, whereas enlarging the σαβ enlarges especially the far away connections. For observer AI, the S0 (S1) parameters in Eq. 4 were: J0ee = 16.8 (33.6); J0(rr′)ie = 21.9 (58.8) for r ≠ 0; J0( 0r′)ie = 9.12 (10.29); σee = 5λ (5λ); σie = 5.75λ (8λ). For observer DI, the S0 (S1) parameters were: J0ee = 33.6 (35.7); J0(rr)ie = 73.8 (80.85) for r ≠ 0; J0(0r′)ie = 29.4 (2.2); σee = 3.5λ (3.5λ); σie = 3.5λ (5λ). Parameters of the response functions were: βe = 0.4; βi = 0.5; θe = 12; θi = 1.5.

References

    1. Mountcastle V B. J Neurophysiol. 1957;20:408–434. - PubMed
    1. Hubel D H, Weisel T N. J Physiol (London) 1963;165:559–568. - PMC - PubMed
    1. Campbell F, Robson J. J Physiol (London) 1968;197:551–566. - PMC - PubMed
    1. Blakemore C, Campbell F. J Physiol (London) 1969;203:237–260. - PMC - PubMed
    1. DeValois R L, DeValois K K. Spatial Vision. New York: Oxford Univ. Press; 1990.

Publication types

LinkOut - more resources