. 1997 Oct 1;17(19):7359-71.
doi: 10.1523/JNEUROSCI.17-19-07359.1997.

Impact of cytoplasmic calcium buffering on the spatial and temporal characteristics of intercellular calcium signals in astrocytes

Affiliations

Impact of cytoplasmic calcium buffering on the spatial and temporal characteristics of intercellular calcium signals in astrocytes

Z Wang et al. J Neurosci. .

Abstract

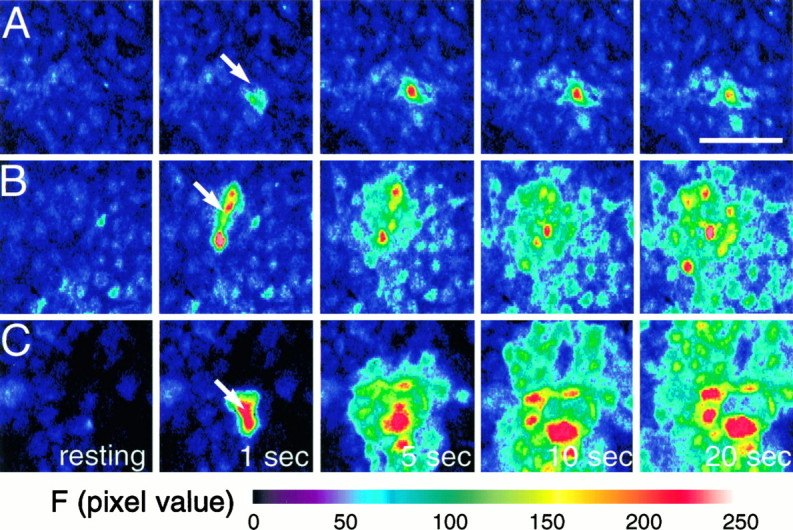
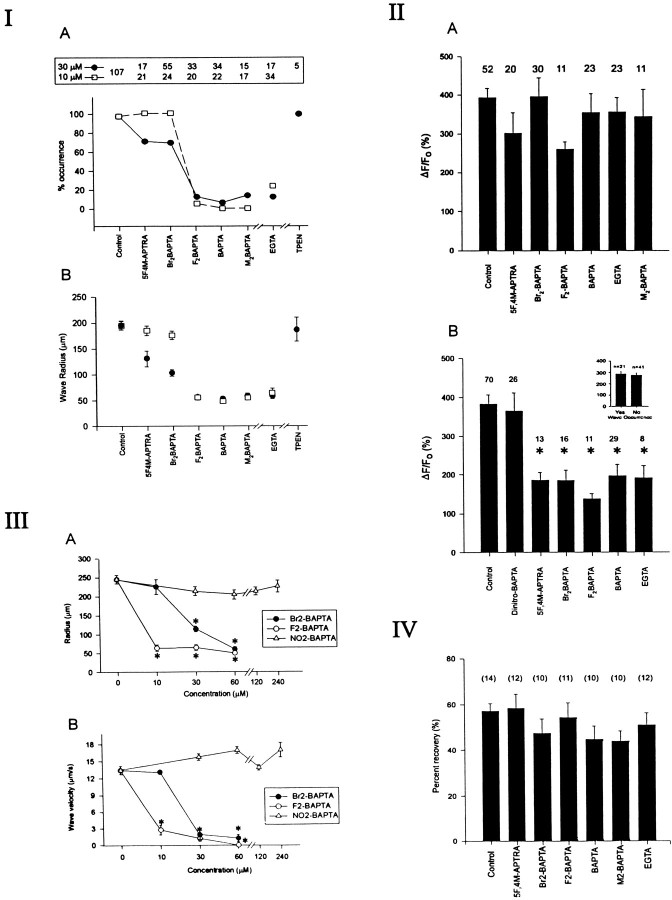
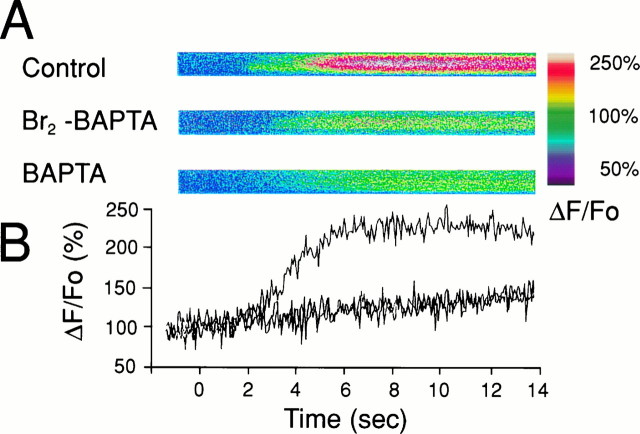
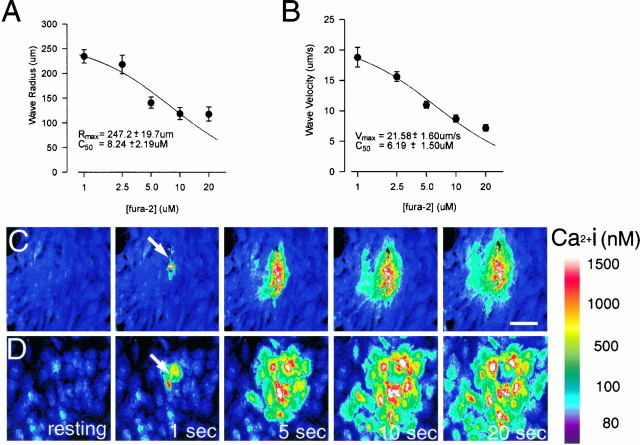
The impact of calcium buffering on the initiation and propagation of mechanically elicited intercellular Ca2+ waves was studied using astrocytes loaded with different exogenous, cell membrane-permeant Ca2+ chelators and a laser scanning confocal or video fluorescence microscope. Using an ELISA with a novel antibody to BAPTA, we showed that different cell-permeant chelators, when applied at the same concentrations, accumulate to the same degree inside the cells. Loading cultures with BAPTA, a high Ca2+ affinity chelator, almost completely blocked calcium wave occurrence. Chelators having lower Ca2+ affinities had lesser affects, as shown in their attenuation of both the radius of spread and propagation velocity of the Ca2+ wave. The chelators blocked the process of wave propagation, not initiation, because large [Ca2+]i increases elicited in the mechanically stimulated cell were insufficient to trigger the wave in the presence of high Ca2+ affinity buffers. Wave attenuation was a function of cytoplasmic Ca2+ buffering capacity; i.e., loading increasing concentrations of low Ca2+ affinity buffers mimicked the effects of lesser quantities of high-affinity chelators. In chelator-treated astrocytes, changes in calcium wave properties were independent of the Ca2+-binding rate constants of the chelators, of chelation of other ions such as Zn2+, and of effects on gap junction function. Slowing of the wave could be completely accounted for by the slowing of Ca2+ ion diffusion within the cytoplasm of individual astrocytes. The data obtained suggest that alterations in Ca2+ buffering may provide a potent mechanism by which the localized spread of astrocytic Ca2+ signals is controlled.


Figures

Fig. 1.
Fig. 1.
Astrocytic calcium waves triggered by mechanical stimulation are attenuated by exogenous calcium buffers having a high but not low Ca2+ affinity. Cultured astrocytes were loaded with fluo-3 (5 μm), and mechanical stimulation was applied with a microelectrode tip (see Materials and Methods).A, Preincubation of the astrocytes with 30 μm BAPTA AM, a permeant high Ca2+affinity buffer, completely prevents wave propagation.B, Similar treatment with Br2-BAPTA AM, a chelator with low Ca2+ affinity, allows wave propagation to occur. C, Control cultures. Stimulation produces a radial wave of increasing [Ca2+]i that spreads contiguously among the cells.
Fig. 2.
Fig. 2.
I, The occurrence of Ca2+ waves depends on the Ca2+affinity of the cytoplasmic buffer. Cultures were simultaneously loaded using 5 μm fluo-3 AM, and the given chelator and Ca2+ waves were mechanically elicited. Top panel, Total number of experiments performed using 30 μm (solid circles) or 10 μm(open squares) concentrations of each permeant chelator.A, Effects of various buffers on the probability of wave occurrence as defined in Materials and Methods. Note the considerable differences between the ability of Br2-BAPTA AM andF2-BAPTA AM to attenuate Ca2+ waves. B, Effects of each buffer on the Ca2+ wave radius. In the event that no wave was triggered, the radius was taken to be 50 μm. Note inA and B that EGTA AM, a slow buffer, has effects similar to BAPTA AM, whereas TPEN, a permeant Zn2+ buffer, has no effect. II, The ability of mechanical stimulation to raise [Ca2+]i in the initial cell does not correlate with the probability of wave generation. A, Plot of the average value of the fractional increase in fluo-3 fluorescence (ΔF/Fo) triggered in the mechanically stimulated astrocyte. At 10 μm loading concentrations, none of the chelators appreciably attenuated the rise in ΔF/Fo, although some of the chelators prevented Ca2+ wave occurrence (ANOVA, F = 1.04; p = 0.403).B, In contrast, when applied at 30 μm, all the chelators (with the exception of dinitro-BAPTA, which has extremely low Ca2+ affinity) attenuated the [Ca2+]i rise irrespective of whether Ca2+ waves were produced (asterisks; ANOVA, F = 8.95; p < 0.0001). Data shown in A and B are mean ΔF/Fo values obtained 3 sec after mechanical stimulation from the number of trials indicatedabove each bar regardless of whether a wavewas roduced. Inset, When grouped according to whether a Ca2+ wave was triggered, there was still no relationship between the magnitude of ΔF/Fo and the ability to trigger a Ca2+ wave. III, The effects of exogenous buffers on Ca2+ waves depend on buffering capacity. A, B, Effects of different concentrations of three permeant chelators on wave radius (A) and velocity (B). Data represent means obtained from at least 7 trials at each concentration (range, 7–47 trials). Note that given sufficient chelator loading, a lower-affinity Ca2+ buffer (Br2-BAPTA) can have similar effects to a high-affinity buffer (F2-BAPTA). However, a buffer with almost no Ca2+ affinity (NO2-BAPTA), regardless of loading concentration, has no effect. Asterisks inA and B indicate significant differences compared with controls (ANOVA with post-hoc multiple comparisons).IV, Calcium buffers have no effects on gap junction function. Cultures were loaded with the different chelators and with 4 μm 5-carboxy-dichlorofluorescein diacetate, which diffuses freely through patent gap junctions. Fluorescence in astrocytes in the center of the field were then bleached by repeatedly scanning the same area using the confocal laser. Photo-bleach recovery in chelator-loaded cells was no different from that observed in untreated cells (ANOVA, F = 1.20;p = 0.316). Numbers inparentheses indicate numbers of experiments.
Fig. 4.
Fig. 4.
Wave velocity attenuation occurs at the level of the cytoplasm of individual astrocytes. Confocal line scans were obtained from single astrocytes in the path of a sucessfully propagating Ca2+ wave. The cultures were pretreated with the indicated chelators (30 μm). A, Selected line scan images illustrating the differences in the rate and extent of rise of fluo-3 fluorescence in chelator-treated versus untreated astrocytes. B, Averaged values of the fractional change in fluo-3 fluorescence (ΔF/Fo) over time for each chelator group. Note that both BAPTA and Br2-BAPTA at these concentrations reduce wave velocity to an equal degree (Fig.5B), a finding reflected by the equally attenuated rate of change of ΔF/Fo in the individual wave-carrying cells (slopes of the rise in ΔF/Fo were 24.08 ± 3.02, 3.73 ± 0.29, and 3.87 ± 0.03 sec−1 for controls, Br2-BAPTA, and BAPTA, respectively).
Fig. 3.
Fig. 3.
Fura-2, an indicator commonly used to study Ca2+ waves, attenuates them. Cultures were loaded with the indicated concentrations of fura-2 AM, and Ca2+ waves were triggered as described.A, Effects of different loading concentrations on wave radius. B. Effects on wave propagation velocity.Solid lines in A and Bindicate the best fit curves fitted to the equationE = (Emax ×C50)/(C50+ [fura]), where E is either wave radius or velocity, and C50 is the half-maximally effective concentration. Values of Rmax andVmax indicate extrapolations to the situation in which no exogenous buffer is present ([fura] = 0). The effects of fura-2 in A and B became statistically significant at concentrations of ≥5 μm(ANOVA, F = 12.9; p < 0.0001, followed by pairwise multiple comparisons by the Newman–Keuls method). Data represent means obtained from at least 8 trials at each concentration (range, 8–18 trials). C,D, Time-lapsed fluorescent images showing mechanically induced Ca2+ wave at 20 and 2.5 μmloading concentrations of fura-2, respectively. Note the substantial reduction in wave radius in C compared withD.
Fig. 5.
Fig. 5.
The regional distribution of intracellular BAPTA after loading of BAPTA AM into cultures was detected by an anti-BAPTA polyclonal antibody. Mixed cultures were loaded with BAPTA AM, fixed with EDC as described, and processed for double immunofluorescence staining. Primary antibodies were directed against GFAP and against BAPTA. Secondary antibodies coupled to FITC and Cy5.5, respectively. The specimens were viewed with the MRC-1000 confocal microscope using the 488 nm (FITC) and 647 nm (Cy5.5) lines of an Ar/Kr laser.A, GFAP staining confined to the astrocytes in the cultures (FITC-coupled secondary antibody). B, BAPTA staining, illustrating the nonselective loading of BAPTA AM into the different cells (including neurons) in the cultures (Cy5.5-coupled secondary antibody). C, Merged image of Aand B, in which ovelapping pixels are shown inyellow.
Fig. 6.
Fig. 6.
When applied onto cultures as the cell-permeant AM esters, different BAPTA analogs accumulate at similar intracellular concentrations as shown by ELISA using the anti-BAPTA antibody.A, Competition assays illustrating the relative affinity of the anti-BAPTA antibody to the different BAPTA analogs used in the present experiments. MAPS-purified anti-BAPTA antibody (1:100) was preincubated for 2 hr with varying concentrations of each of the BAPTA analog salts listed. The ELISA was then performed as described (see Materials and Methods). A/Amax, Normalized absorbance at 405 nm for each BAPTA analog. Note the high affinity of the anti-BAPTA antibody to BAPTA andF2-BAPTA (solid circles andopen squares), and the low affinity for fluo-3, Br2-BAPTA, and M2-BAPTA. The antibody has intermediate affinity for DN-BAPTA (open circles).B, ELISA performed on cultures after loading with 5 μm fluo-3 AM alone or in comination with 30 μm BAPTA AM, F2-BAPTA AM, or DN-BAPTA AM (4 cultures per group).A/Afluo-3, Absorbance normalized to that obtained with fluo-3 alone. Note that the absorbance ratios obtained differ according to the differences in affinity of the anti-BAPTA antibody for the different analogs (as shown inA). C, Data from B scaled according to differences in affinity of the anti-BAPTA antibody, showing that BAPTA, F2-BAPTA, and DN-BAPTA all load into the cells at similar concentrations. Scaling factors were defined asAfluo-3/(Afluo-3Achelator) using values from the competition assays in A. The factors were thus derived from the data for 0.1 and 1 mm chelator and then averaged.Afluo-3, Normalized fluo-3 absorbance; Achelator, normalized absorbance of the chosen chelator.

Similar articles

Cited by

References

    1. Adler EM, Augustine GJ, Duffy SN, Charlton MP. Alien intracellular calcium chelators attenuate neurotransmitter release at the squid giant synapse. J Neurosci. 1991;11:1496–1507. - PMC - PubMed
    1. Allbritton NL, Meyer T, Stryer L. Range of messenger action of calcium ion and inositol 1,4,5-triphosphate. Science. 1992;258:1812–1815. - PubMed
    1. Augustine GJ, Neher E. Calcium requirements for secretion in bovine chromaffin cells. J Physiol (Lond) 1992;450:247–271. - PMC - PubMed
    1. Augustine GJ, Charlton MP, Smith SJ. Calcium entry during neurotransmitter release at voltage-clamped nerve terminals of squid axons. J Physiol (Lond) 1985;369:163–181. - PMC - PubMed
    1. Backx PH, de Tombe PP, Van Deen JHK, Mulder BJM, ter Keurs HEDJ. A model of propagating calcium-induced calcium release mediated by calcium diffusion. J Gen Physiol. 1989;93:963–977. - PMC - PubMed

Publication types

MeSH terms

LinkOut - more resources