. 1997 Oct 1;17(19):7385-95.
doi: 10.1523/JNEUROSCI.17-19-07385.1997.

Purkinje cell expression of a mutant allele of SCA1 in transgenic mice leads to disparate effects on motor behaviors, followed by a progressive cerebellar dysfunction and histological alterations

Affiliations

Purkinje cell expression of a mutant allele of SCA1 in transgenic mice leads to disparate effects on motor behaviors, followed by a progressive cerebellar dysfunction and histological alterations

H B Clark et al. J Neurosci. .

Abstract

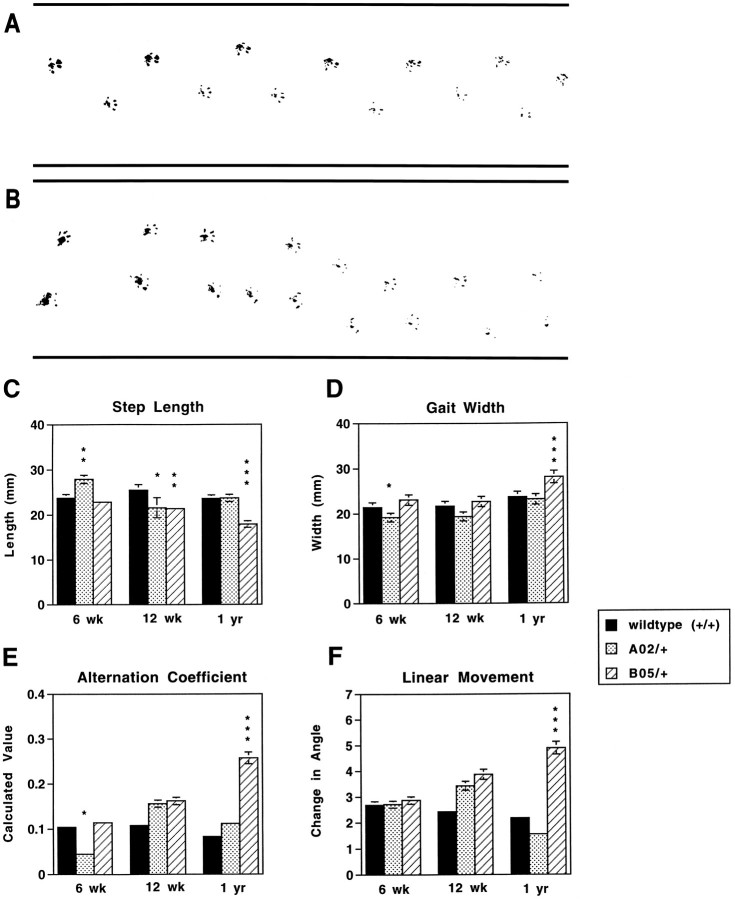
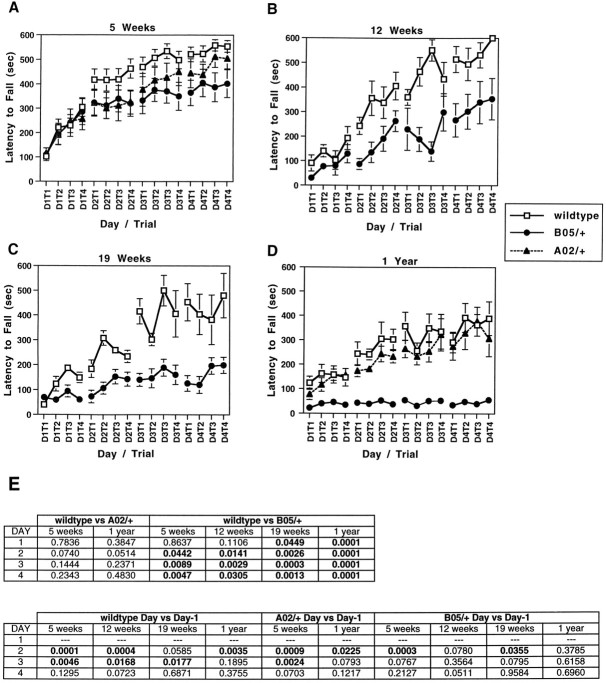
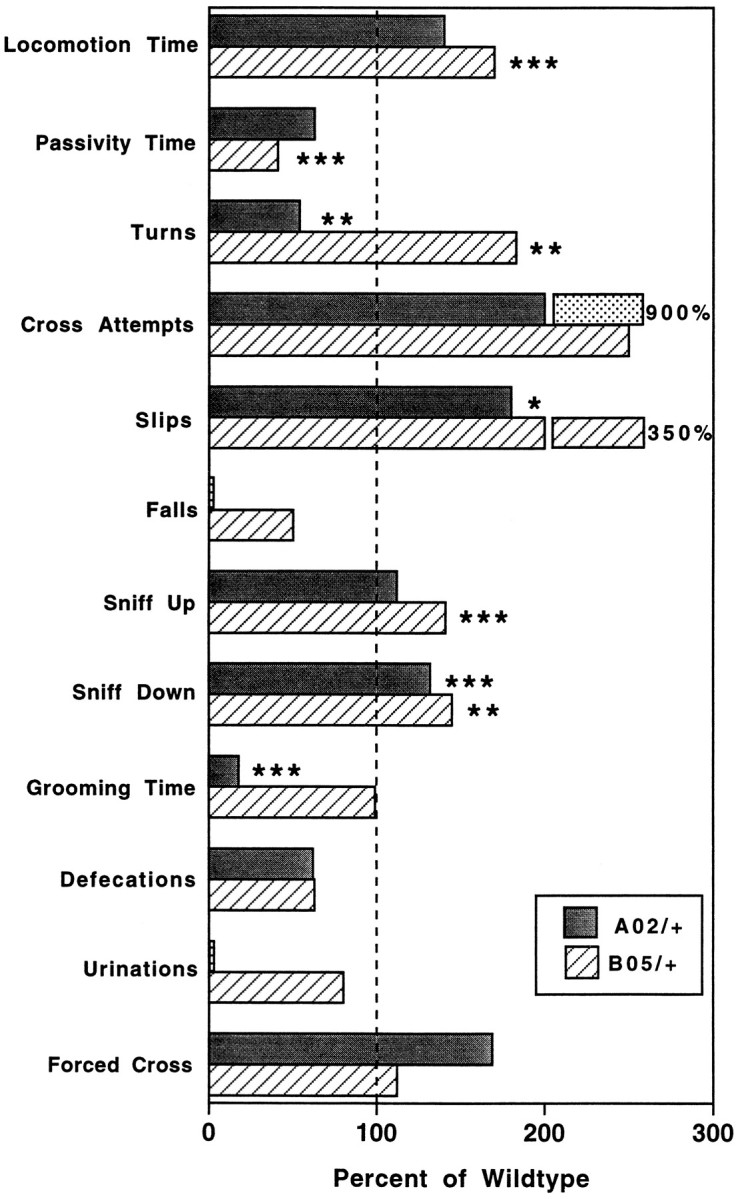
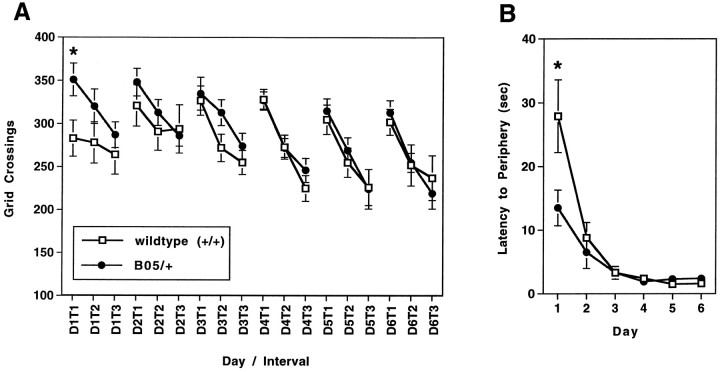
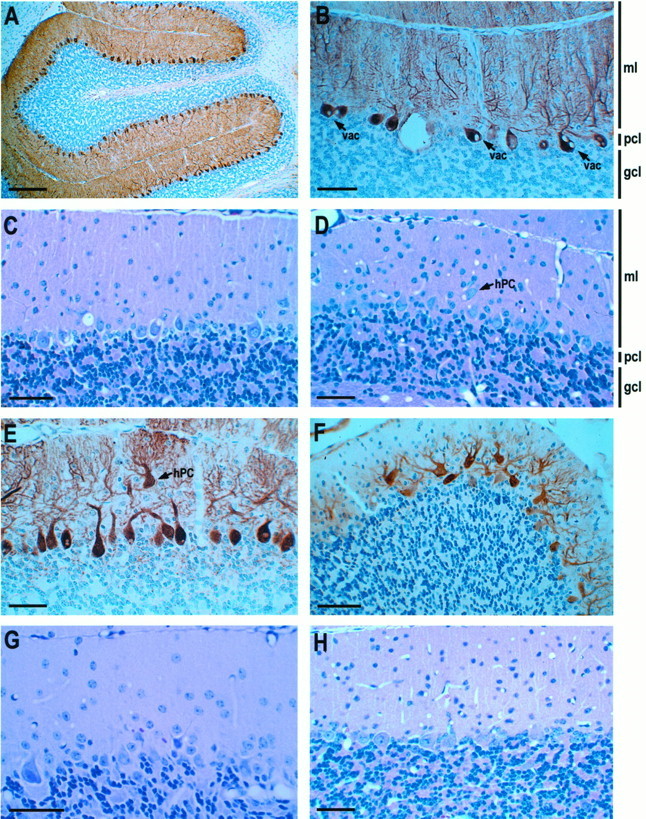
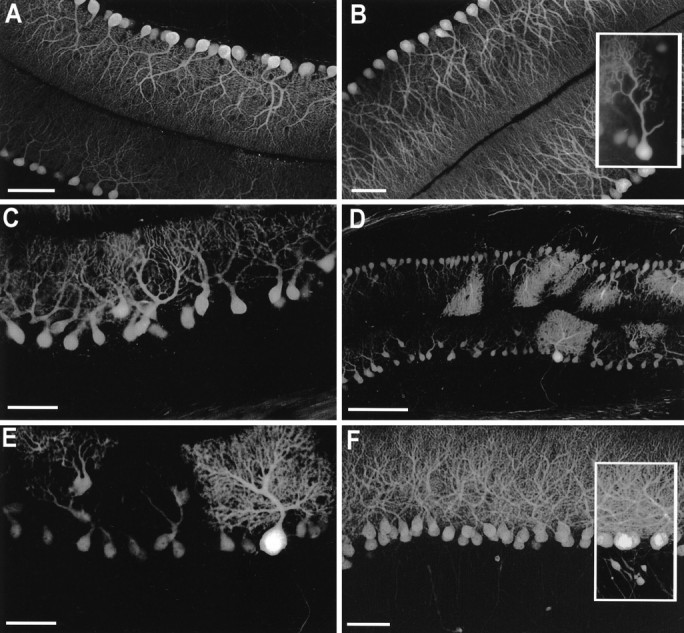
Spinocerebellar ataxia type 1 (SCA1) is an autosomal dominant neurological disorder caused by the expansion of a CAG repeat encoding a polyglutamine tract. Work presented here describes the behavioral and neuropathological course seen in mutant SCA1 transgenic mice. Behavioral tests indicate that at 5 weeks of age mutant mice have an impaired performance on the rotating rod in the absence of deficits in balance and coordination. In contrast, these mutant SCA1 mice have an increased initial exploratory behavior. Thus, expression of the mutant SCA1 allele within cerebellar Purkinje cells has divergent effects on the motor behavior of juvenile animals: a compromise of rotating rod performance and a simultaneous enhancement of initial exploratory activity. With age, these animals develop incoordination with concomitant progressive Purkinje neuron dendritic and somatic atrophy but relatively little cell loss. Therefore, the eventual development of ataxia caused by the expression of a mutant SCA1 allele is not the result of cell death per se, but the result of cellular dysfunction and morphological alterations that occur before neuronal demise.


Figures

Fig. 1.
Fig. 1.
Analysis of footprint patterns produced by wild-type, A02/+, and B05/+ animals. Representative footprint patterns of 1-year-old wild-type (A) and B05/+ (B) animals are shown. Footprint patterns of 6-week-old, 12-week-old, and 1-year-old wild-type, A02/+, and B05/+ animals were quantitatively assessed for step length (C), gait width (D), step alternation (E), and linearity of movement (F). Although A02/+ animals had slightly increased step length and decreased gait width and alternation coefficients at 6 weeks of age, their footprint patterns were indistinguishable from those produced by wild-type animals at 1 year. B05/+ animals showed no abnormalities in footprint patterns at 6 weeks of age. By 1 year of age, B05/+ animals displayed a significantly shorter step length, broader gait width, higher alternation coefficient (indicating irregular step alternation), and increased linear movement measure (indicating a nonlinear movement) as compared with similarly aged wild-type animals. *p < 0.05; **p < 0.01; ***p < 0.001. Error bars indicate SEM and are shown when they are within the resolution of the graph.
Fig. 2.
Fig. 2.
Performance of A02/+, wild-type +/+, and B05/+ animals on an accelerating rotating rod apparatus. Five-week-old (A), 12-week-old (B), 19-week-old (C), and 1-year-old animals (D) were tested for four trials per day for 4 consecutive days on an accelerating RotaRod. B05/+ animals showed impaired performance improvement (A–C) or failed to improve their performance (D) as compared with age-matched wild-type and A02/+ animals. Repeated measures ANOVA confirmed a day by genotype interaction for 5-week-old (p = 0.0011), 12-week-old (p = 0.0355), 19-week-old (p = 0.0002), and 1-year-old (p = 0.0001) animals. pvalues obtained by performing post hoc analyses comparing the daily performances of wild-type, A02/+, and B05/+ animals are shown in E. Differences in daily performances between wild-type and A02/+ animals (wild-type vs A02/+) approach statistical significance only on day 2 in both 5-week-old and 1-year-old animals; wild-type animals perform significantly better than B05/+ animals (wild-type vs B05/+) on days 2–4 at 5 and 12 weeks and on days 1–4 at 19 weeks and 1 year of age. Comparison of performance on consecutive days (Day vs Day-1) indicates that wild-type animals are able to improve their performance significantly from days 1 to 2 and from 2 to 3 at 5, 12, and 19 weeks of age, and from day 1 to 2 at 1 year of age. A02/+ animals improve day to day in a manner similar to wild-type animals at the ages tested. Conversely, B05/+ animals are unable to improve their performance significantly from day to day after day 2, beginning at 5 weeks of age, and are incapable of any day to day performance improvement at 1 year of age.
Fig. 3.
Fig. 3.
Behavior of A02/+ and B05/+ transgenic animals in the bar cross test. The mean performance values of A02/+ and B05/+ transgenic 5-week-old animals are graphed as the percentage of wild-type animal activity levels. The performance level in each of the described parameters (see Materials and Methods) was analyzed by single-factor ANOVA. In general, B05/+ animals and, to a lesser extent, A02/+ animals displayed increased spontaneous motor activity (Locomotion Time, Passivity Time,Cross Attempts, Sniff Up, andSniff Down) and similar levels of motor coordination (Turns, Slips, Falls, andForced Cross) when compared with wild-type littermate controls (see Results for full description). *p < 0.05; **p < 0.01; ***p < 0.001.
Fig. 4.
Fig. 4.
Grid crossings and latency to the periphery in the open field test by 6-week-old wild-type and B05/+ animals. Wild-type (n = 15) and B05/+ transgenic (n = 14) animals were scored for total grid crossings for three 5 min intervals per day for 6 consecutive days. The mean number of grid crossings for each scored interval is shown (A). For both wild-type and B05/+ animals, the number of grid crossings in each scored interval decreased on a given day. In addition, there is an overall trend for decreased activity on each subsequent day. Single-factor ANOVA indicated no significant differences between the number of grid crossings made by B05/+ transgenic mice and wild-type animals except in interval one on the first day (351 vs 283 crossings, respectively; p = 0.0230). The daily mean latencies for animals to reach the periphery of the open field arena are shown (B). B05/+ animals reach the periphery significantly faster than wild-type animals on the first day of testing. *p < 0.05.
Fig. 5.
Fig. 5.
Cerebellar histology of SCA1transgenic mice. A, Postnatal day 16 B05/+ transgenic animal with normal cerebellar cortex structure. B, B05/+ animal at P25 with cytoplasmic vacuoles (vac) present in many Purkinje cells. C, B05/+ animal at 8 weeks of age displaying mild gliosis of the molecular layer and the persistence of cytoplasmic vacuoles. D, B05/+ animal at 12 weeks of age with increased gliosis of the molecular layer. Occasional Purkinje cells were localized heterotopically (hPC) in the molecular layer. E, B05/+ animal at 15 weeks of age with shrinkage of the molecular and a heterotopic Purkinje cell.F, B05/+ animal at 24 weeks of age with occasional Purkinje cells with more than one primary dendrite and reduced calbindin immunoreactivity. G, B05/+ animal at 1 year of age showing Purkinje cell loss and altered morphology.H, One-year-old A02/+ transgenic animal with normal cerebellar cortical structure and cell morphology. A, B, E, and F are stained immunohistochemically for calbindin and counterstained with hematoxylin. C, D, G, and H are stained with hematoxylin and eosin. Scale bars: 150 μm in A; 30 μm in B–H. The molecular layer (ml), Purkinje cell layer (pcl), and granule cell layer (gcl) are indicated also. The vacuolar profiles in C, D, G, and H that are not associated with Purkinje cell somata are vascular lumina dilated by perfusion fixation.
Fig. 6.
Fig. 6.
Immunohistochemical staining of cerebellar sections of SCA1 transgenic mice with calbindin.A, B05/+ animal at P25 showed normal Purkinje cell morphology. B, B05/+ animal at 6 weeks of age showed a subtle loss in complexity of the proximal aspects of some Purkinje cell dendrites and occasional Purkinje cells (inset) with extensive reduction in dendritic arborization. C, B05/+ animal at 15 weeks of age with shrinkage of the molecular layer and many Purkinje cells with atrophic dendritic morphology. Occasional Purkinje cells are located heterotopically in the molecular layer.D, E, B05/+ animal at 27 weeks of age with increased severity of the changes described in C. In addition, occasional larger hypertrophic Purkinje cells were apparent. F, A02/+ animal at 1 year of age showed normal Purkinje cell number and dendritic arborization. Some Purkinje cells had proximal axonal dilations (inset). Scale bars: 30 μm in A–C, E, F; 100 μm in D.

References

    1. Banfi S, Servadio A, Chung M-Y, Kwiatkowski TJ, McCall AE, Duvick LA, Shen Y, Roth EJ, Orr HT, Zoghbi HY. Identification and characterization of the gene causing type 1 spinocerebellar ataxia. Nat Genet. 1994;7:513–520. - PubMed
    1. Banfi S, Servadio A, Chung M-Y, Capozzoli F, Duvick LA, Elde R, Zoghbi HY, Orr HT. Cloning and developmental expression analysis of the murine homolog of the spinocerebellar ataxia type 1 gene (Sca1). Hum Mol Genet. 1996;5:33–40. - PubMed
    1. Burright EN, Clark HB, Servadio A, Matilla T, Feddersen RM, Yunis WS, Duvick LA, Zoghbi HY, Orr HT. SCA1 transgenic mice: a model for neurodegeneration caused by an expanded CAG trinucleotide repeat. Cell. 1995;82:937–948. - PubMed
    1. Burright EN, Davidson JD, Duvick LA, Koshy B, Zoghbi HY, Orr HT. Identification of a self-association region within the SCA1 gene product, ataxin-1. Hum Mol Genet. 1997;6:513–518. - PubMed
    1. Crusio WE, Van Abeelen JHF. The genetic architecture of behavioral response to novelty in mice. Heredity. 1986;56:55–63. - PubMed

Publication types

LinkOut - more resources