. 1997 Oct 1;17(19):7480-9.
doi: 10.1523/JNEUROSCI.17-19-07480.1997.

Neural coding mechanisms in tactile pattern recognition: the relative contributions of slowly and rapidly adapting mechanoreceptors to perceived roughness

Affiliations

Neural coding mechanisms in tactile pattern recognition: the relative contributions of slowly and rapidly adapting mechanoreceptors to perceived roughness

D T Blake et al. J Neurosci. .

Abstract

Tactile pattern recognition depends on form and texture perception. A principal dimension of texture perception is roughness, the neural coding of which was the focus of this study. Previous studies have shown that perceived roughness is not based on neural activity in the Pacinian or cutaneous slowly adapting type II (SAII) neural responses or on mean impulse rate or temporal patterning in the cutaneous slowly adapting type I (SAI) or rapidly adapting (RA) discharge evoked by a textured surface. However, those studies found very high correlations between roughness scaling by humans and measures of spatial variation in SAI and RA firing rates. The present study used textured surfaces composed of dots of varying height (280-620 micron) and diameter (0.25-2.5 mm) in psychophysical and neurophysiological experiments. RA responses were affected least by the range of dot diameters and heights that produced the widest variation in perceived roughness, and these responses could not account for the psychophysical data. In contrast, spatial variation in SAI impulse rate was correlated closely with perceived roughness over the whole stimulus range, and a single measure of SAI spatial variation accounts for the psychophysical data in this (0.974 correlation) and two previous studies. Analyses based on the possibility that perceived roughness depends on both afferent types suggest that if the RA response plays a role in roughness perception, it is one of mild inhibition. These data reinforce the hypothesis that SAI afferents are mainly responsible for information about form and texture whereas RA afferents are mainly responsible for information about flutter, slip, and motion across the skin surface.


Figures

Fig. 3.
Fig. 3.
Stimulus pattern and typical SAI and RA responses.A, The stimulus surfaces were tetragonal arrays ofraised dots arranged in strips, 20 mm wide × 220 mm long, around the circumference of a cylindrical drum. Dot diameters increased uniformly from 0.25 to 2.5 mm along the length of each pattern. The center-to-center dot spacing was constant at 3.5 mm. Only dot height differed between surfaces. The regions used for psychophysical testing are indicated by bars below the stimulus pattern. B, Typical SAI and RA afferent responses to the same stimulus patterns used in the psychophysical experiments. Each tick mark in the raster represents an action potential and is located at the position in the stimulus pattern at which it occurred. The bars below the responses mark the analysis regions, which were 14.8 mm long and correspond to the locations used in the psychophysical experiments.
Fig. 1.
Fig. 1.
Psychophysical results for individual subjects. Each subject reported the roughness of each surface four times in randomized blocks of trials. All numerical reports from a single subject were normalized to a mean of 1.0 to eliminate individual differences in the range of numbers chosen for ratio scaling. Eachline shows the averaged responses of a single subject. Stimuli had dot diameters of 0.25, 0.70, 1.15, 1.60, 2.05, and 2.50 mm and heights of 280, 370, and 620 μm.
Fig. 2.
Fig. 2.
Psychophysical averages. Each point represents the mean roughness report across all subjects for one stimulus surface. Error bars represent 1 SEM.
Fig. 4.
Fig. 4.
Impulse rate profiles evoked by single dots from a typical neuron. Each plot shows the firing rate when dots passed through the center of the receptive field. Theleft, middle, and right plots show typical SAI and RA responses to narrow, intermediate, and wide dot diameters, respectively.
Fig. 5.
Fig. 5.
SAI and RA mean rate (top) and response area (bottom) versus dot height and diameter. Response area is defined here as the area of skin over which a single scanned dot evokes a discharge rate of >10% of the peak discharge rate (see Materials and Methods). Impulse rate is the mean firing rate within this area. The SEs for SAI and RA response areas ranged from 0.48 to 0.81 mm2 and from 0.97 to 1.298 mm2, respectively. The SEs for SAI and RA mean impulse rates ranged from 9.8 to 13.5 ips and from 4.0 to 5.9 ips, respectively.
Fig. 6.
Fig. 6.
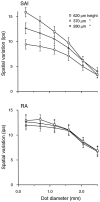
Spatial variation in firing rates versus dot diameter. The measures of spatial variation in firing rates displayed here and in successive figures were obtained by convolving the afferent discharge evoked by a local segment of the stimulus pattern with optimal Gabor filters at all orientations and phases (see Materials and Methods). The SD and wavelength of the Gabor filters used with the SAI data were 1.0 and 2.6 mm, respectively. The SD and wavelength used with the RA data were 2.5 and 4.2 mm, respectively. The plotted points are averages over all 16 SAI and 16 RA afferents studied here. Error bars represent 1 SEM.
Fig. 7.
Fig. 7.
Consistency plots of reported roughness versus SAI and RA spatial variation in afferent firing rates for each of the 18 surfaces. The correlation coefficient between psychophysical data and a Gabor measure of spatial variation in firing rates was 0.974 for SAI afferents and 0.869 for RA afferents. The error bars represent SEMs for the reported roughness and the spatial variation measure associated with the roughest surface in the study (see Figs. 2 and 6).
Fig. 8.
Fig. 8.
Roughness magnitude and identical measures of spatial variation in SAI firing rates from three studies with different textured surfaces. The neural data from previous studies were reanalyzed using Gabor filters with the same parameters (2.6 mm wavelength; 1.0 mm SD) as those used in the present study. Theleft ordinate in each graph is the mean reported roughness. The right ordinate is the associated Gabor measure of spatial variation. The upper panels show the data from the present study. The middle panels show the data from Connor and Johnson (1992), who used 11 dot arrays with varying spacing in either the horizontal or vertical direction and a constant 4.0 mm spacing in the other direction. The lower panels show data from Connor et al. (1990), who used 18 dot arrays with varying dot spacing and diameter.

References

    1. Blake DT, Hsiao SS, Johnson KO (1997) Slowly and rapidly adapting mechanoreceptive responses to raised and depressed scanned patterns: effects of width, height, orientation, and a raised surround. J Neurophysiol, in press. - PubMed
    1. Burton H, Sinclair RJ. Representation of tactile roughness in thalamus and somatosensory cortex. Can J Physiol Pharmacol. 1994;72:546–557. - PubMed
    1. Connor CE, Johnson KO. Neural coding of tactile texture: comparisons of spatial and temporal mechanisms for roughness perception. J Neurosci. 1992;12:3414–3426. - PMC - PubMed
    1. Connor CE, Hsiao SS, Phillips JR, Johnson KO. Tactile roughness: neural codes that account for psychophysical magnitude estimates. J Neurosci. 1990;10:3823–3836. - PMC - PubMed
    1. Johansson RS, Westling G. Signals in tactile afferents from the fingers eliciting adaptive motor responses during precision grip. Exp Brain Res. 1987;66:141–154. - PubMed

Publication types