. 1997 Sep 22;138(6):1193-206.
doi: 10.1083/jcb.138.6.1193.

Nuclear membrane dynamics and reassembly in living cells: targeting of an inner nuclear membrane protein in interphase and mitosis

Affiliations

Nuclear membrane dynamics and reassembly in living cells: targeting of an inner nuclear membrane protein in interphase and mitosis

J Ellenberg et al. J Cell Biol. .

Abstract

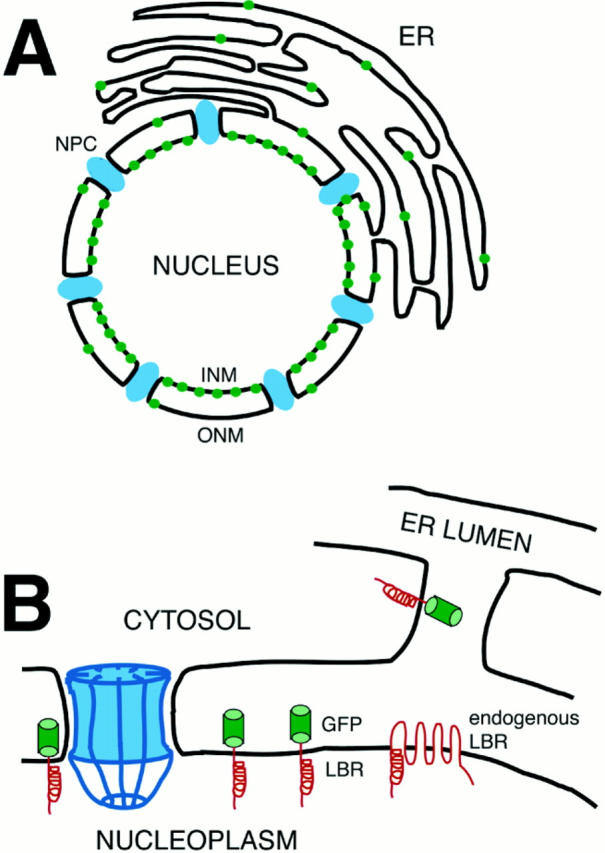
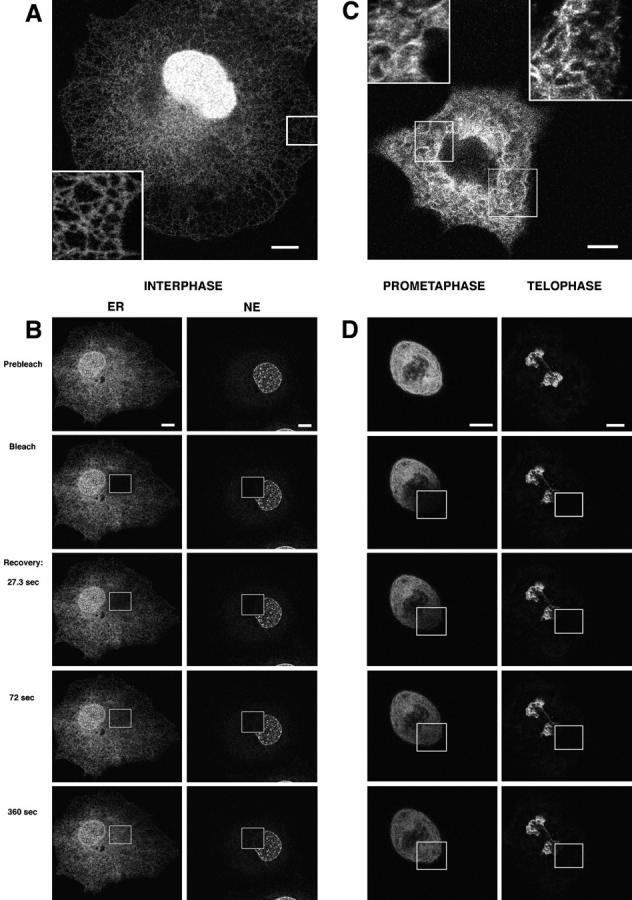
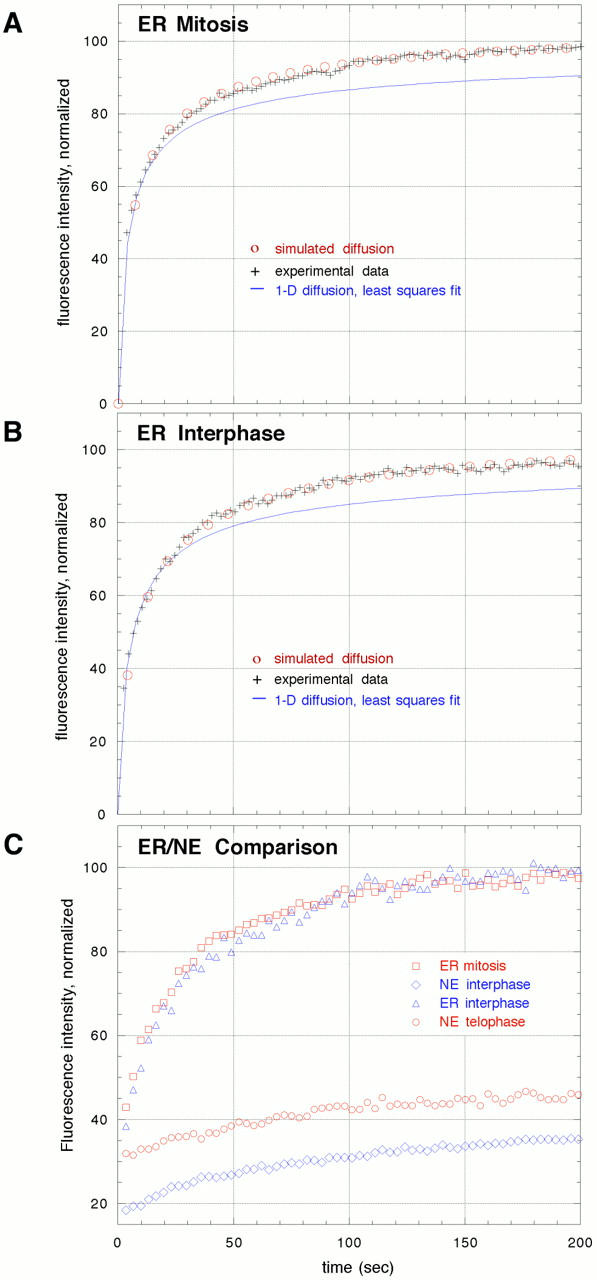
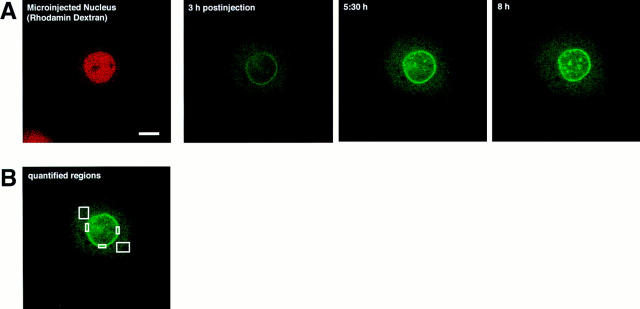
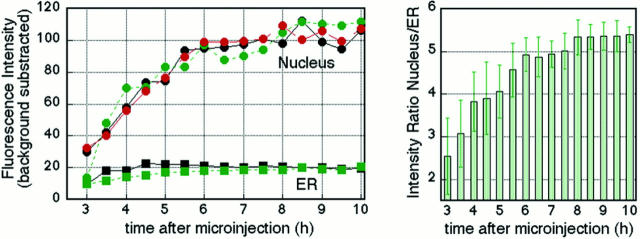
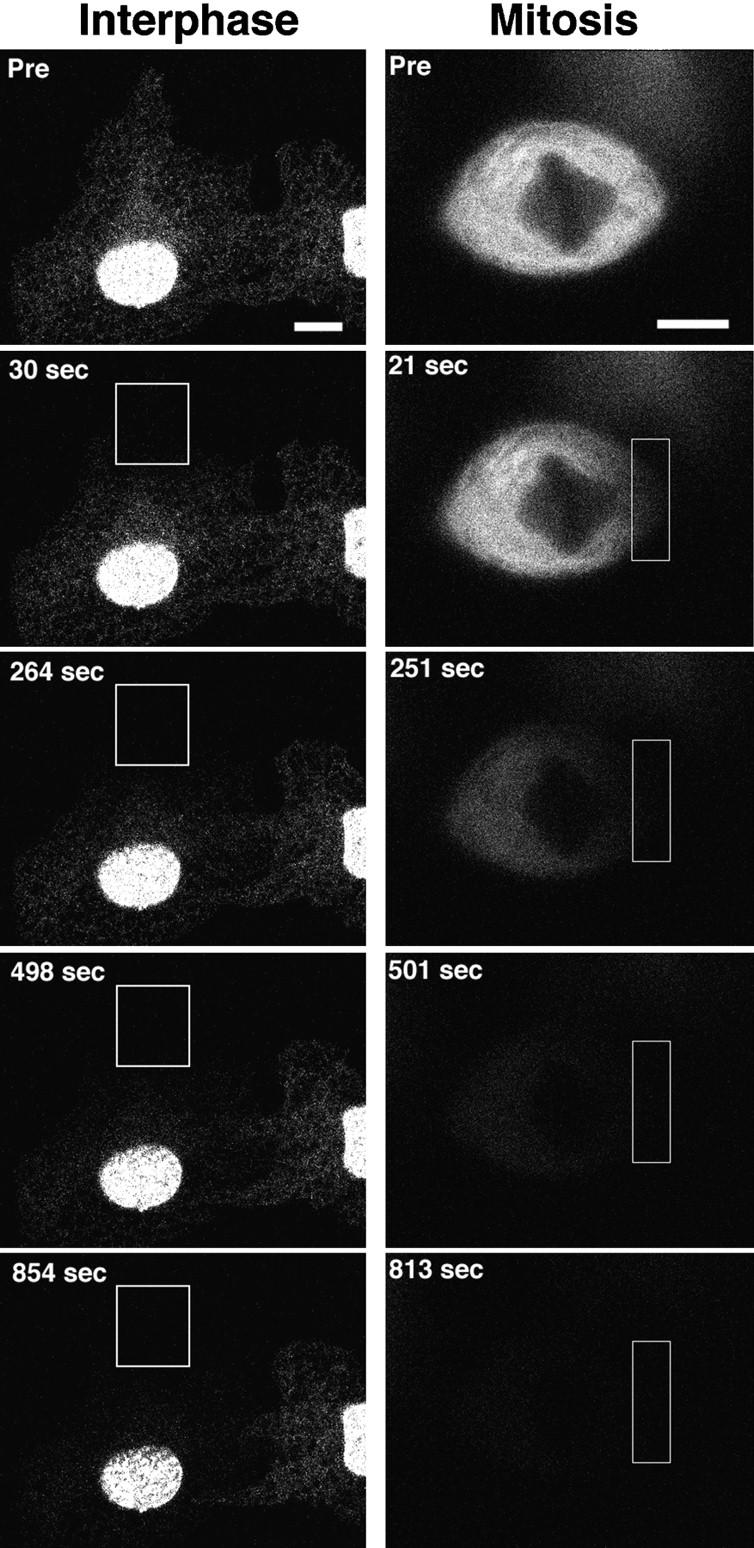
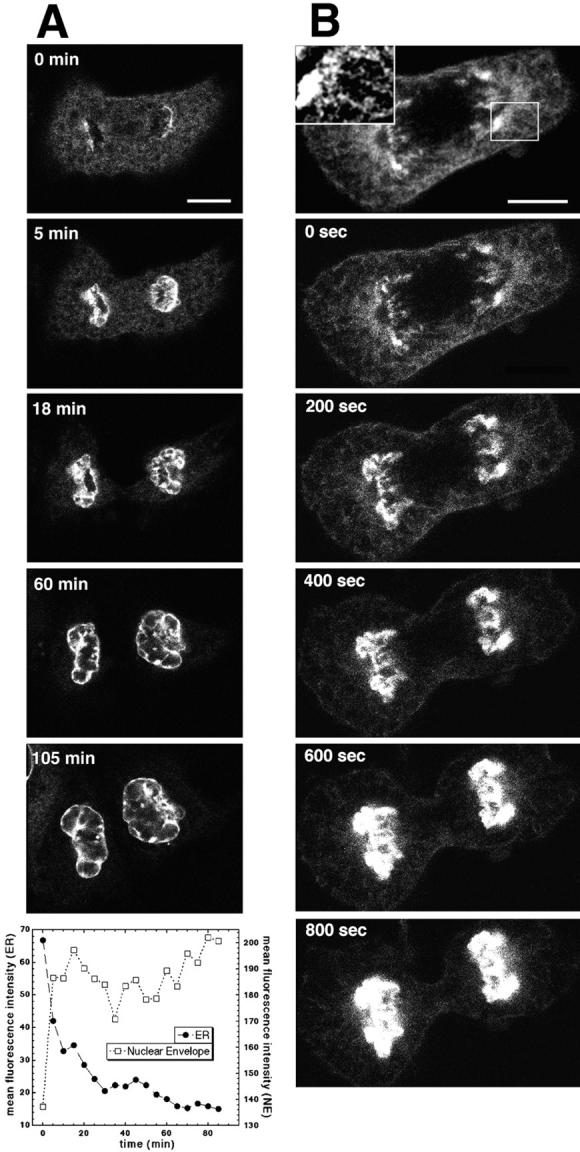
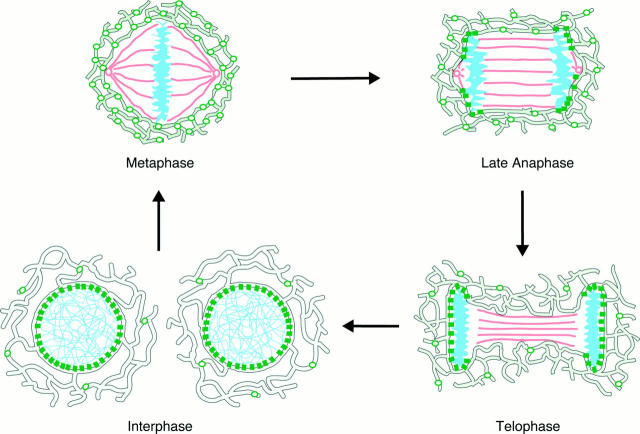
The mechanisms of localization and retention of membrane proteins in the inner nuclear membrane and the fate of this membrane system during mitosis were studied in living cells using the inner nuclear membrane protein, lamin B receptor, fused to green fluorescent protein (LBR-GFP). Photobleaching techniques revealed the majority of LBR-GFP to be completely immobilized in the nuclear envelope (NE) of interphase cells, suggesting a tight binding to heterochromatin and/or lamins. A subpopulation of LBR-GFP within ER membranes, by contrast, was entirely mobile and diffused rapidly and freely (D = 0. 41 +/- 0.1 microm2/s). High resolution confocal time-lapse imaging in mitotic cells revealed LBR-GFP redistributing into the interconnected ER membrane system in prometaphase, exhibiting the same high mobility and diffusion constant as observed in interphase ER membranes. LBR-GFP rapidly diffused across the cell within the membrane network defined by the ER, suggesting the integrity of the ER was maintained in mitosis, with little or no fragmentation and vesiculation. At the end of mitosis, nuclear membrane reformation coincided with immobilization of LBR-GFP in ER elements at contact sites with chromatin. LBR-GFP-containing ER membranes then wrapped around chromatin over the course of 2-3 min, quickly and efficiently compartmentalizing nuclear material. Expansion of the NE followed over the course of 30-80 min. Thus, selective changes in lateral mobility of LBR-GFP within the ER/NE membrane system form the basis for its localization to the inner nuclear membrane during interphase. Such changes, rather than vesiculation mechanisms, also underlie the redistribution of this molecule during NE disassembly and reformation in mitosis.


Figures

Figure 1
Figure 1
Schematic overview of nuclear architecture and LBR– GFP topology. (A) NE and ER membrane continuities. Nuclear pore complexes (NPC) are depicted in blue, and a protein targeted to the inner nuclear membrane (INM) in green. Note its equal and random distribution in ER and outer nuclear membrane (ONM) and its concentration in the INM. Possible diffusion through the pore membrane is shown in one case. (B) Detail of A showing predicted topology of full-length LBR (endogenous) and LBR–GFP. LBR–GFP contains the NH2-terminal nucleoplasmic tail as well as the first transmembrane span of full-length LBR (amino acids 1–238), resulting in a lumenal GFP localization.
Figure 4
Figure 4
Distribution and mobilities of LBR–GFP in interphase and mitotic membranes. (A) Confocal section close to the lower cell surface showing steady-state expression of LBR–GFP in an interphase cell. (Inset) Boxed region at higher magnification showing LBR– GFP distribution within the ER network. (B) Qualitative FRAP experiments in ER and NE membranes in interphase cells expressing LBR–GFP. (Left) Photobleach recovery in ER membranes. (Right) Photobleach recovery in NE membranes. Note the complete recovery of fluorescence in the ER and the lack of recovery in the NE. (C) Thin confocal section through the mitotic apparatus showing the steady-state expression pattern of LBR–GFP in metaphase cells. (Insets) Boxed regions at higher magnification showing the tubular membrane network within which LBR–GFP redistributed. Note its resemblance to the interphase ER shown in A. (D) Qualitative FRAP experiments in mitotic membranes of cells expressing LBR–GFP. (Left) Photobleach recovery in prometaphase membranes. (Right) Photobleach recovery in telophase membranes. Note the complete recovery of fluorescence in membranes prometaphase but not of telophase. (The internet URL for quicktime movies is http://dir.nichd.nih.gov/CBMB/pb3labob.htm) Bars, 10 μm.
Figure 5
Figure 5
Quantitative FRAP experiments to determine diffusion constants for LBR–GFP. Fluorescence intensities in recovery after photobleaching are plotted versus time. Data points were taken at 1-s intervals until they had reached a steady plateau. (A and B) FRAP in metaphase membranes (ER mitosis, A) or ER membranes in interphase (ER interphase, B). Experimental data are marked by crosses, computer-simulated diffusion from a prebleach whole cell image by circles. The simulated intensities overlapped exactly with the experimental data. A least squares fit of Eq. 1 (see Materials and Methods) to the experimental data at early timepoints is shown by a line. The curves displayed kinetics allowing the determination of a single diffusion constant for LBR–GFP in ER membranes in mitotic and interphase cells (see Materials and Methods for details). (C) Comparison of FRAP experiments of LBR–GFP in ER and NE membranes in different stages of the cell cycle. ER in interphase (triangles), ER in mitosis (squares), NE in interphase (diamonds), and NE in telophase (circles). All experiments were performed under exactly identical conditions for optimal comparison. Note the different kinetics and high immobile fractions in the NE membranes in interphase and telophase. Fluorescence intensity in all panels was normalized to prebleach intensity corrected for total loss of fluorescence because of the high-energy laser bleach to I o = 100 (normalized prebleach intensity). Recovery at t = 200 s is therefore a direct measure for the mobile fraction of molecules. See Materials and Methods for experimental details.
Figure 2
Figure 2
Time course of localization of LBR–GFP to NE membranes. (A) Cells were microinjected with an expression plasmid for LBR–GFP along with 70-kD tetramethylrhodamine dextran to mark injected nuclei (first panel). Localization of LBR–GFP was followed for 10 h after injection by monitoring the GFP fluorescence every 10 min using a confocal microscope with the pinhole wide open to obtain greatest depth of field. Images shown are after 3, 5.5, and 8 h. (B) Representative regions of interest (ROI) in either ER or NE membranes were quantitated in all images taken in A (first panel). Background subtracted mean fluorescence intensities/area are plotted against time for each of the outlined ROIs in either ER or NE membranes (line graph). Ratios of NE fluorescence versus ER fluorescence were calculated from mean values of all ROIs quantitated (bar graph). Error bars indicate standard deviation. Data points shown are at 30-min intervals. (The internet URL for quicktime movies is http://dir.nichd.nih.gov/CBMB/pb3labob.htm) Bar, 10 μm.
Figure 2
Figure 2
Time course of localization of LBR–GFP to NE membranes. (A) Cells were microinjected with an expression plasmid for LBR–GFP along with 70-kD tetramethylrhodamine dextran to mark injected nuclei (first panel). Localization of LBR–GFP was followed for 10 h after injection by monitoring the GFP fluorescence every 10 min using a confocal microscope with the pinhole wide open to obtain greatest depth of field. Images shown are after 3, 5.5, and 8 h. (B) Representative regions of interest (ROI) in either ER or NE membranes were quantitated in all images taken in A (first panel). Background subtracted mean fluorescence intensities/area are plotted against time for each of the outlined ROIs in either ER or NE membranes (line graph). Ratios of NE fluorescence versus ER fluorescence were calculated from mean values of all ROIs quantitated (bar graph). Error bars indicate standard deviation. Data points shown are at 30-min intervals. (The internet URL for quicktime movies is http://dir.nichd.nih.gov/CBMB/pb3labob.htm) Bar, 10 μm.
Figure 3
Figure 3
Characterization of NE invaginations labeled by LBR–GFP. (A) Deconvoluted serial z-sections of nuclei of living cells expressing LBR–GFP for 48 h were used for a three-dimensional reconstruction of membrane invaginations (see methods). (Left) Confocal image of a whole cell showing membrane invaginations in the nucleus. (Middle) Deconvolved z-section close to the upper nuclear surface. (Right, top) Reconstructed projection in z through line 1 indicated in middle panel. (Right, bottom) Reconstructed projection in z through line 2 from middle panel at higher magnification. (B) Electron microscopy images of nuclei from cells transfected with LBR– GFP for 48 h. Left panels show ultrathin sections of Araldite embedded cells. (Lower left) Overview of an invagination of the NE double membrane. (Upper left) Higher magnification of boxed region with a clearly visible nuclear pore (arrowhead). (Right) A cryosection from the same cells immunostained with anti-GFP antibody and 15-nm colloidal gold protein A. Note that NE invaginations are specifically labeled with gold particles (arrowheads), preferentially between the membranes or on the nucleoplasmic face of the inner nuclear membrane, consistent with the predicted topology of LBR–GFP (Fig. 1). N, nucleus, C, cytoplasm, ne, nuclear envelope, iv, invaginations. Note the frequent contacts of electron-dense material with the NE and its invaginations. (C) Deconvoluted z-sections of nuclei as in A, except that DNA was costained with the vital dye Hoechst 33342. (Left) GFP fluorescence in a section close to the lower surface of the nucleus. (Middle) Hoechst 33342 fluorescence in pseudocolor red. (Right) A merged image, significant colocalization in yellow. Bars: (A and C) 5 μm; (B) 0.5 μm.
Figure 3
Figure 3
Characterization of NE invaginations labeled by LBR–GFP. (A) Deconvoluted serial z-sections of nuclei of living cells expressing LBR–GFP for 48 h were used for a three-dimensional reconstruction of membrane invaginations (see methods). (Left) Confocal image of a whole cell showing membrane invaginations in the nucleus. (Middle) Deconvolved z-section close to the upper nuclear surface. (Right, top) Reconstructed projection in z through line 1 indicated in middle panel. (Right, bottom) Reconstructed projection in z through line 2 from middle panel at higher magnification. (B) Electron microscopy images of nuclei from cells transfected with LBR– GFP for 48 h. Left panels show ultrathin sections of Araldite embedded cells. (Lower left) Overview of an invagination of the NE double membrane. (Upper left) Higher magnification of boxed region with a clearly visible nuclear pore (arrowhead). (Right) A cryosection from the same cells immunostained with anti-GFP antibody and 15-nm colloidal gold protein A. Note that NE invaginations are specifically labeled with gold particles (arrowheads), preferentially between the membranes or on the nucleoplasmic face of the inner nuclear membrane, consistent with the predicted topology of LBR–GFP (Fig. 1). N, nucleus, C, cytoplasm, ne, nuclear envelope, iv, invaginations. Note the frequent contacts of electron-dense material with the NE and its invaginations. (C) Deconvoluted z-sections of nuclei as in A, except that DNA was costained with the vital dye Hoechst 33342. (Left) GFP fluorescence in a section close to the lower surface of the nucleus. (Middle) Hoechst 33342 fluorescence in pseudocolor red. (Right) A merged image, significant colocalization in yellow. Bars: (A and C) 5 μm; (B) 0.5 μm.
Figure 6
Figure 6
FLIP to probe the continuity of interphase and mitotic membranes containing LBR–GFP. FLIP experiments were performed on interphase membranes (left) and metaphase membranes (right). Note the complete loss of fluorescence from both interphase ER membranes and mitotic membranes over a similar time course, but not from NE membranes in interphase. ER fluorescence that remained in interphase is from an adjacent cell whose membranes were not connected to those within the photobleached box. Bars, 10 μm.
Figure 7
Figure 7
NE membrane reassembly in vivo. (A) Time-lapse sequence from late anaphase to cytokinesis covering complete NE reformation. Confocal images were taken every 15 s. Graph shows quantitation of representative ROIs in ER and NE membranes for the time-lapse sequence shown. Note the correlation of loss of fluorescence from the ER with the sudden concentration of fluorescent material in the NE. (B) Time-lapse sequence of the first 13 min of NE membrane reassembly in late anaphase. Thin confocal sections were taken every 8 s through the reforming nuclei to resolve the ER reticulum. (The internet URL for quicktime movies is http://dir.nichd.nih.gov/CBMB/pb3labob.htm) Bar, 10 μm.
Figure 8
Figure 8
Model of nuclear envelope reassembly. In interphase (bottom left), newly synthesized integral inner nuclear membrane proteins such as LBR (green ovals) move by lateral diffusion from the ER (gray outlined network) to the inner nuclear membrane, where they are retained and immobilized (green squares) by binding to nucleoplasmic ligands (chromatin, blue). Early in mitosis, these binding interactions are disrupted, leading to equilibration of the mobilized LBR molecules within the ER/NE system. In metaphase (top left) the NE is completely disassembled and LBR diffuses freely within an interconnected ER network that surrounds the spindle apparatus (red) and the condensed chromatin. Binding sites for LBR are available again in late anaphase (top right), immobilizing the receptor at contact sites between ER and chromatin. Towards telophase (bottom right), more binding sites become exposed as the spindle retracts, trapping more LBR molecules and forcing ER membranes to wrap around the chromatin. This progressive immobilization and wrapping leads to a rapid and efficient enclosure of nuclear material by ER elements highly enriched in LBR, which form the new NE. From telophase to early interphase, the NE expands slowly into a sphere surrounding the decondensed chromatin. The majority of LBR has localized to the inner nuclear membrane and remains there throughout interphase (bottom left).

Similar articles

Cited by

References

    1. Akey CW. Structural plasticity of the nuclear pore complex. J Mol Biol. 1995;248:273–293. - PubMed
    1. Belgareh N, Doyé V. Dynamics of nuclear pore distribution in nucleoporin mutant yeast cells. J Cell Biol. 1997;136:747–759. - PMC - PubMed
    1. Bergman J, Singer J. Immunoelectron microscopic studies of the intracellular transport of the membrane glycoprotein (G) of vesicular stomatitis virus in infected Chinese hamster ovary cells. J Cell Biol. 1983;97:1777–1787. - PMC - PubMed
    1. Bione S, Maestrini E, Rivella S, Mancini M, Regis S, Romeao G, Toniolo D. Identification of a novel X-linked gene responsible for Emery-Dreifuss muscular dystrophy. Nature Genet. 1994;8:323–329. - PubMed
    1. Bourgeois CA, Hemon D, Bouteille M. Structural relationship between the nucleolus and the nuclear envelope. J Ultrastruct Res. 1979;68:328–340. - PubMed

Publication types

MeSH terms