. 1997 Sep 22;138(6):1265-78.
doi: 10.1083/jcb.138.6.1265.

Localization of p21-activated kinase 1 (PAK1) to pinocytic vesicles and cortical actin structures in stimulated cells

Affiliations

Localization of p21-activated kinase 1 (PAK1) to pinocytic vesicles and cortical actin structures in stimulated cells

S Dharmawardhane et al. J Cell Biol. .

Abstract

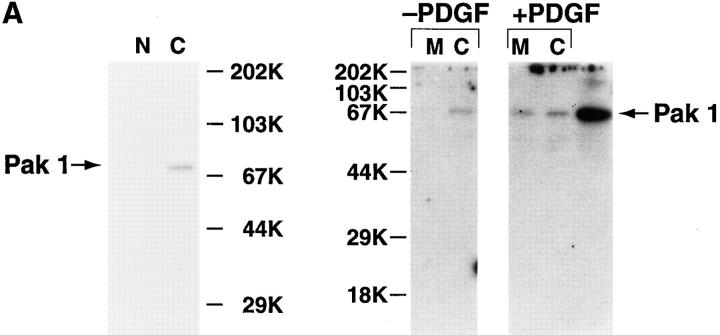
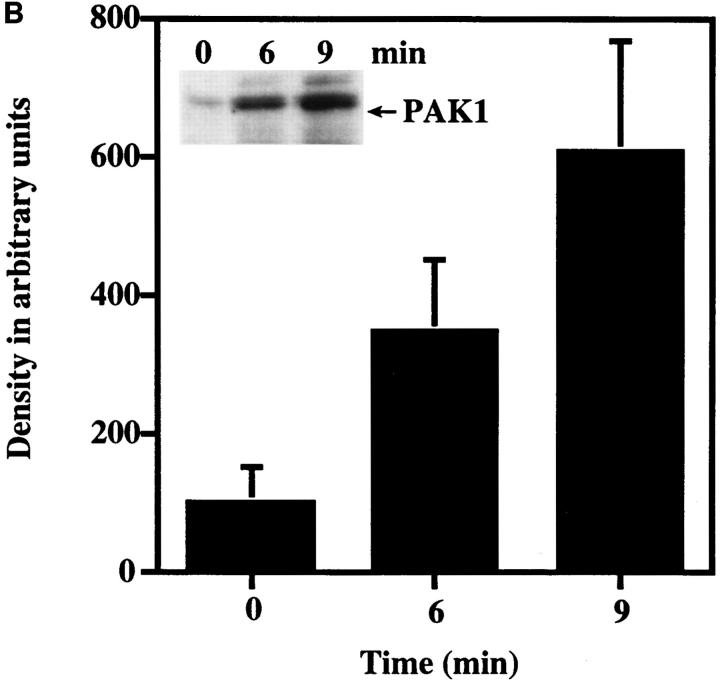
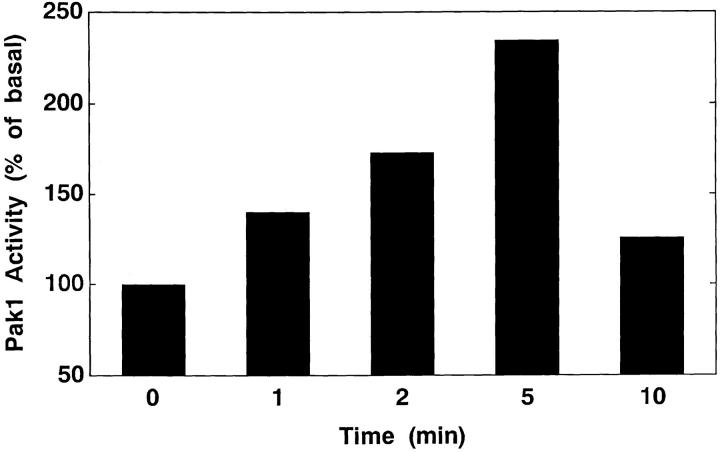
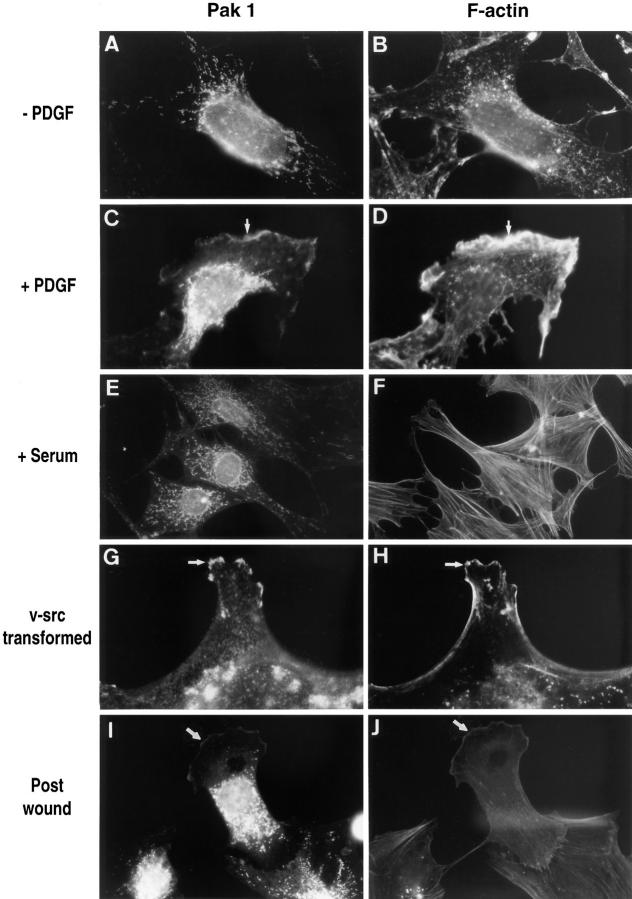
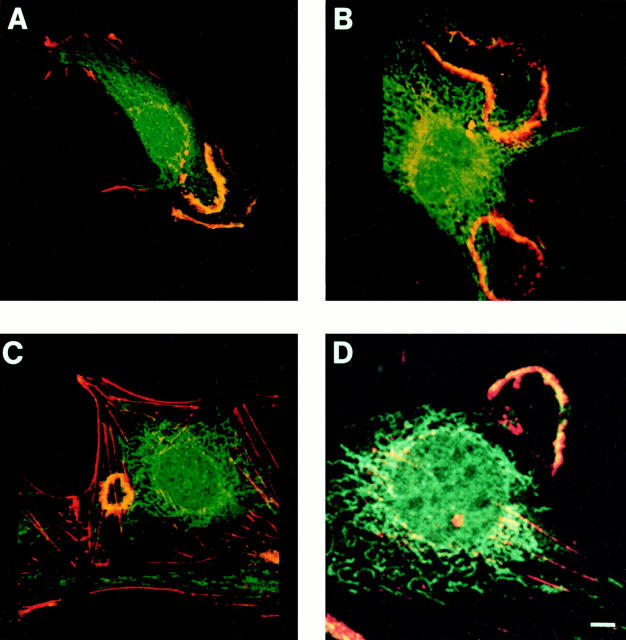
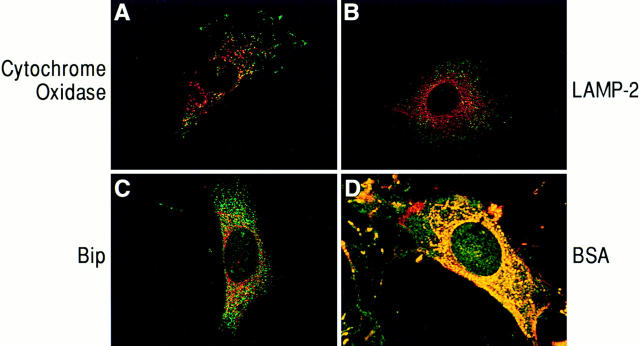
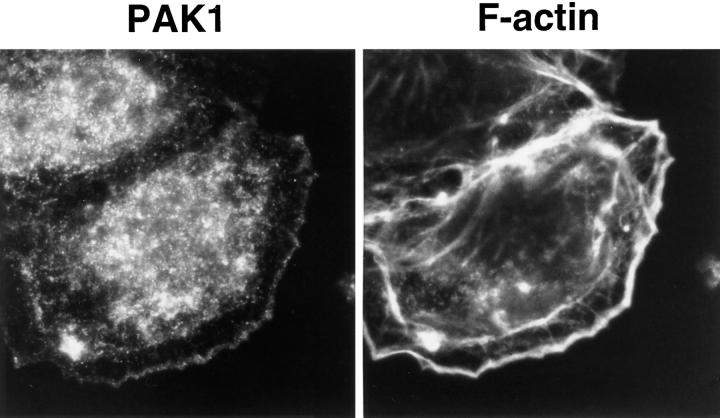
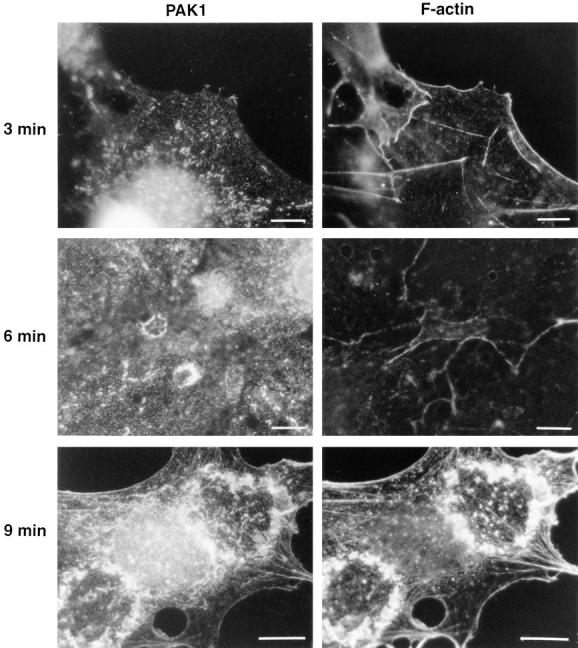
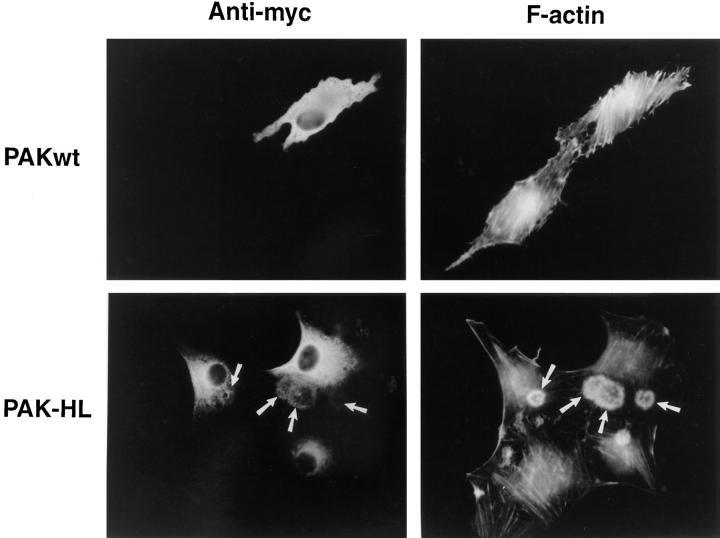
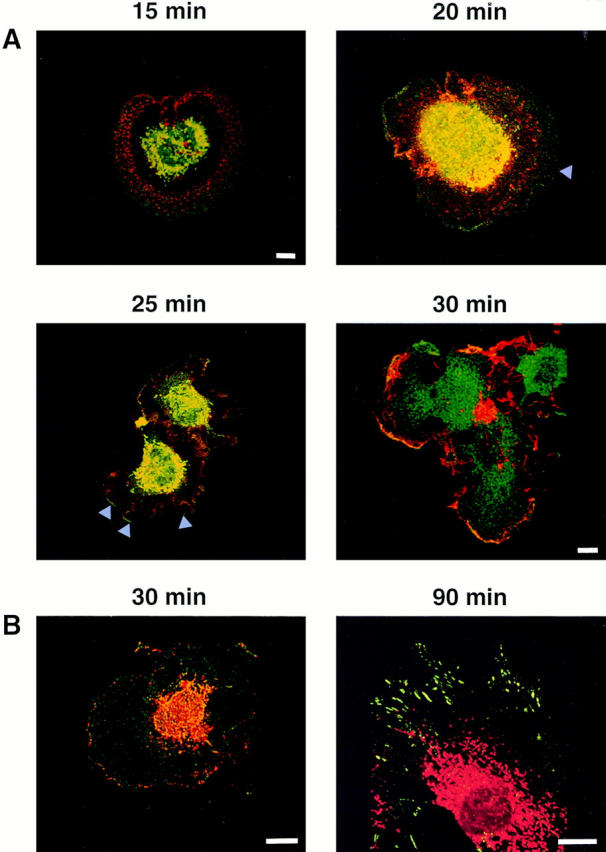
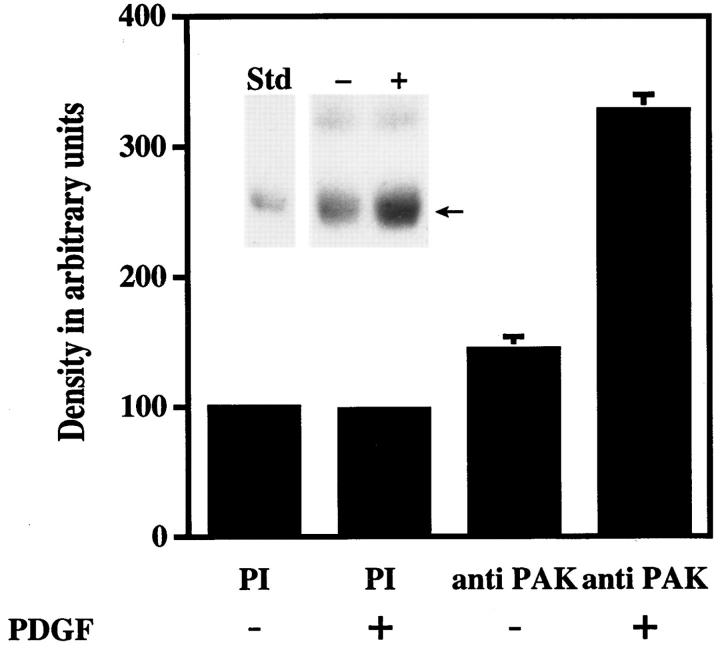
The mechanisms through which the small GTPases Rac1 and Cdc42 regulate the formation of membrane ruffles, lamellipodia, and filopodia are currently unknown. The p21-activated kinases (PAKs) are direct targets of active Rac and Cdc42 which can induce the assembly of polarized cytoskeletal structures when expressed in fibroblasts, suggesting that they may play a role in mediating the effects of these GTPases on cytoskeletal dynamics. We have examined the subcellular localization of endogenous PAK1 in fibroblast cell lines using specific PAK1 antibodies. PAK1 is detected in submembranous vesicles in both unstimulated and stimulated fibroblasts that colocalize with a marker for fluid-phase uptake. In cells stimulated with PDGF, in v-Src-transformed fibroblasts, and in wounded cells, PAK1 redistributed into dorsal and membrane ruffles and into the edges of lamellipodia, where it colocalizes with polymerized actin. PAK1 was also colocalized with F-actin in membrane ruffles extended as a response to constitutive activation of Rac1. PAK1 appears to precede F-actin in translocating to cytoskeletal structures formed at the cell periphery. The association of PAK1 with the actin cytoskeleton is prevented by the actin filament-disrupting agent cytochalasin D and by the phosphatidylinositol 3-kinase inhibitor wortmannin. Co-immunoprecipitation experiments demonstrate an in vivo interaction of PAK1 with filamentous (F)-actin in stimulated cells. Microinjection of a constitutively active PAK1 mutant into Rat-1 fibroblasts overexpressing the insulin receptor (HIRcB cells) induced the formation of F-actin- and PAK1-containing structures reminiscent of dorsal ruffles. These data indicate a close correlation between the subcellular distribution of endogenous PAK1 and the formation of Rac/Cdc42-dependent cytoskeletal structures and support an active role for PAK1 in regulating cortical actin rearrangements.


Figures

Figure 9
Figure 9
(A) Detection of PAK1 in Swiss 3T3 subcellular fractions. Serum-starved cells with either no addition (−PDGF) or with addition (+PDGF) of 5 ng/ml PDGF for 10 min were separated into membrane (M) and cytosolic (C) fractions and immunoblotted for PAK1 using affinity-purified anti-PAK1 antibody, as described in Materials and Methods. Alternatively, highly purified nuclei (N) were prepared as described in Materials and Methods for immunoblotting. PAK1 was detected as a single band at 68-kD that comigrated with authentic human PAK1 expressed in Cos cells (last lane). (B) Detection of PAK1 in the membrane fraction during PDGF stimulation. Membrane fractions of quiescent Swiss 3T3 cells with either no addition or at 6 and 9 min after the addition of 5 ng/ml of PDGF were immunoblotted for PAK1 using affinity-purified anti-PAK1 antibody. Quantitation of the 68-kD band was by phosphoimager analysis. The mean density of the 68-kD band from unstimulated membrane fractions was set at 100%. The data shown represent the mean ± SEM of three separate experiments. The presence of 20– 40% of total PAK1 immunoreactivity in the isolated membrane fraction from PDGF-stimulated but not unstimulated cells was consistently observed. (Inset) Representative Western blot of membrane fractions blotted for PAK1. Arrow indicates 68-kD band.
Figure 9
Figure 9
(A) Detection of PAK1 in Swiss 3T3 subcellular fractions. Serum-starved cells with either no addition (−PDGF) or with addition (+PDGF) of 5 ng/ml PDGF for 10 min were separated into membrane (M) and cytosolic (C) fractions and immunoblotted for PAK1 using affinity-purified anti-PAK1 antibody, as described in Materials and Methods. Alternatively, highly purified nuclei (N) were prepared as described in Materials and Methods for immunoblotting. PAK1 was detected as a single band at 68-kD that comigrated with authentic human PAK1 expressed in Cos cells (last lane). (B) Detection of PAK1 in the membrane fraction during PDGF stimulation. Membrane fractions of quiescent Swiss 3T3 cells with either no addition or at 6 and 9 min after the addition of 5 ng/ml of PDGF were immunoblotted for PAK1 using affinity-purified anti-PAK1 antibody. Quantitation of the 68-kD band was by phosphoimager analysis. The mean density of the 68-kD band from unstimulated membrane fractions was set at 100%. The data shown represent the mean ± SEM of three separate experiments. The presence of 20– 40% of total PAK1 immunoreactivity in the isolated membrane fraction from PDGF-stimulated but not unstimulated cells was consistently observed. (Inset) Representative Western blot of membrane fractions blotted for PAK1. Arrow indicates 68-kD band.
Figure 1
Figure 1
Stimulation of PAK1 activity by PDGF in Swiss 3T3 cells. Swiss 3T3 cells were stimulated with 3 ng/ml PDGF for the indicated times and PAK1 activity determined in immunoprecipitates by in vitro kinase assays as described in Materials and Methods. Activity at t = 0 was set as 100%. Results shown are representative of four similar experiments.
Figure 2
Figure 2
PAK1 and F-actin localization in Swiss 3T3 fibroblasts. (Left column) Cells stained with affinity-purified anti-PAK1 antibody; (right column) cells stained with rhodamine phalloidin. (A and B) Serum-starved cells with no addition or (C and D) stimulated for 10 min with 3 ng/ml PDGF. (E and F) Cells in fetal bovine serum. (G and H) v-Src–transformed 10 t1/2 cells; untransformed 10 t1/2 controls were similar in appearance to the serum-starved Swiss 3T3 controls in A and B and are thus not shown here. I and J show a polarized Swiss 3T3 cell migrating into the area of a wound. All procedures were as described in Materials and Methods. Arrows indicate areas where PAK1 and F-actin colocalize in membrane ruffles. Micrographs shown are at 5,000× (A–F, I, and J) and 7,000× (G and H).
Figure 4
Figure 4
PAK1 and F-actin distribution after PDGF addition. Confocal microscopy was performed on Swiss 3T3 cells after PDGF stimulation for 10 min, as described in Materials and Methods. Red, rhodamine-phalloidin staining of F-actin; green, fluorescein staining of PAK1; yellow, merged images indicating the areas of colocalization. PAK1 and F-actin are colocalized in dorsal ruffles (A and C), membrane ruffles (A and B), and lamellipodia (D). Bar, 15 μm.
Figure 3
Figure 3
Confocal micrographs of cells immunostained for PAK1 and cytoplasmic organelle markers. Swiss 3T3 cells in serum were fixed in 100% methanol and costained with anti-PAK1, and antibodies to organelle markers as described in Materials and Methods. (A, B, and D) Red, rhodamine staining of cytochrome oxidase (mitochondrial marker), LAMP-2 (lysosomal marker), and BSA, respectively; green, fluorescein staining of PAK1. (C) Green, fluorescein staining of BiP (endoplasmic reticulum marker); red, rhodamine staining of PAK1; yellow, areas of colocalization.
Figure 5
Figure 5
PAK1 and F-actin localization in Swiss 3T3 cells expressing dominant active Rac1. Swiss 3T3 cells infected with Rac1 (Q61L) virus were fixed after 14 h and immunostained for endogenous PAK1 as described in Materials and Methods. (Left) PAK1; (right) staining for F-actin using rhodamine-phalloidin.
Figure 6
Figure 6
Time course of PAK1 and F-actin localization after PDGF stimulation. (Left column) Cells stained with affinity-purified anti-Pak1 antibody; (right column) cells stained with rhodamine-phalloidin. Cells were fixed at 3, 6, and 9 min after stimulation with PDGF, as described in Materials and Methods. Bars, 15 μm.
Figure 7
Figure 7
Actin localization in HIRcB cells injected with PAK1. Quiescent HIRcB cells were microinjected with myc-tagged expression vectors carrying wild-type (top row) or mutant (H83L, H86L) PAK1 cDNA (bottom row). (Left column) Cells stained with anti-myc to localize injected PAK1 and to identify expressing cells. (Right column) Same cells stained with rhodamine-phalloidin to detect F-actin.
Figure 8
Figure 8
Distribution of PAK1 and F-actin in Swiss 3T3 cells plated on fibronectin. (A) PAK1 and F-actin distribution after stimulation with PDGF and plating on a fibronectin matrix. Confocal micrographs of quiescent Swiss 3T3 cells at 15, 20, 25, and 30 min after stimulation are shown. Red, Rhodamine-phalloidin staining of F-actin; green, fluorescein staining of PAK1; yellow, merged images indicating the areas of colocalization. (B) PAK1 and phosphotyrosine localization after PDGF stimulation when plated on fibronectin. Confocal micrographs of Swiss 3T3 cells at 30 and 90 min after stimulation are shown. (30 min) Red, Rhodamine staining of phosphotyrosine; green, fluorescein staining of PAK1; yellow, merged images indicating the areas of colocalization. (90 min) Red, rhodamine staining of PAK1: green, fluorescein staining of phosphotyrosine. Bars, 15 μm.
Figure 10
Figure 10
Coprecipitation of PAK1 with F-actin in cellular immunoprecipitates. PAK1 was immunoprecipitated from quiescent Swiss 3T3 cell lysates before and after PDGF addition (5 ng/ ml) and immunoblotted with an anti-actin antibody, as described. Quantitation of the 42-kD actin band (see inset below) was by phosphoimager analysis (Molecular Probes, Inc.). The mean density of the 42-kD band from unstimulated pre-immune serum immunoprecipitates was set at 100%. The data shown represent the mean ± SEM of duplicate determinations from three separate experiments. (Inset) Representative Western blot of PAK1 immunoprecipitates immunostained for actin. Arrow indicates 42-kD actin band that comigrated with the purified rabbit actin (Sigma Chemical Co.) standard (Std). The upper band in the immunoprecipitates is IgG heavy chain.

References

    1. Bagrodia S, Derijard B, Davis RJ, Cerione RA. Cdc42 and PAKmediated signaling leads to JUN kinase and p38MAP kinase activation. J Biol Chem. 1995a;270:27995–27998. - PubMed
    1. Bagrodia S, Taylor SJ, Creasy CL, Chernoff J, Cerione RA. Identification of a mouse p21Cdc42/Rac-activated kinase. J Biol Chem. 1995b;270:22731–22737. - PubMed
    1. Bokoch GM, Wang Y, Bohl BP, Sells MA, Quilliam LA, Knaus UG. Interaction of the Nck adapter protein with p21-activated kinase (PAK1) J Biol Chem. 1996;271:25746–25749. - PubMed
    1. Bretscher MS. Getting membrane flow and the cytoskeleton to cooperate in moving cells. Cell. 1996;87:601–606. - PubMed
    1. Burgess DR, Jiang W, Mamajiwalla S, Kinsey W. Intestinal crypt stem cells possess high levels of cytoskeletal-associated phosphotyrosine-containing proteins and tyrosine kinase activity relative to differentiated enterocytes. J Cell Biol. 1989;109:2139–2144. - PMC - PubMed

Publication types

MeSH terms