. 1997 Sep 22;138(6):1367-77.
doi: 10.1083/jcb.138.6.1367.

Cell size control and a cell-intrinsic maturation program in proliferating oligodendrocyte precursor cells

Affiliations

Cell size control and a cell-intrinsic maturation program in proliferating oligodendrocyte precursor cells

F B Gao et al. J Cell Biol. .

Abstract

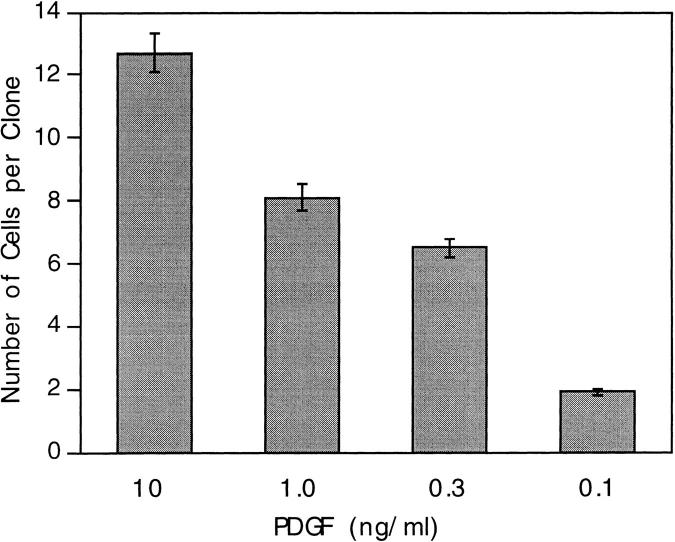
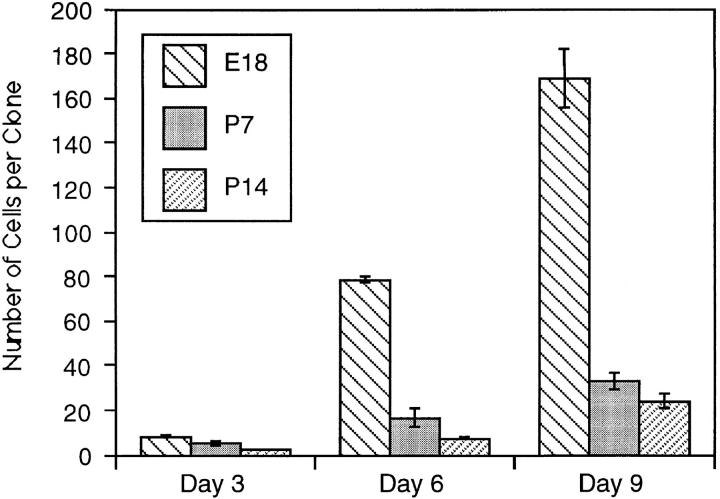
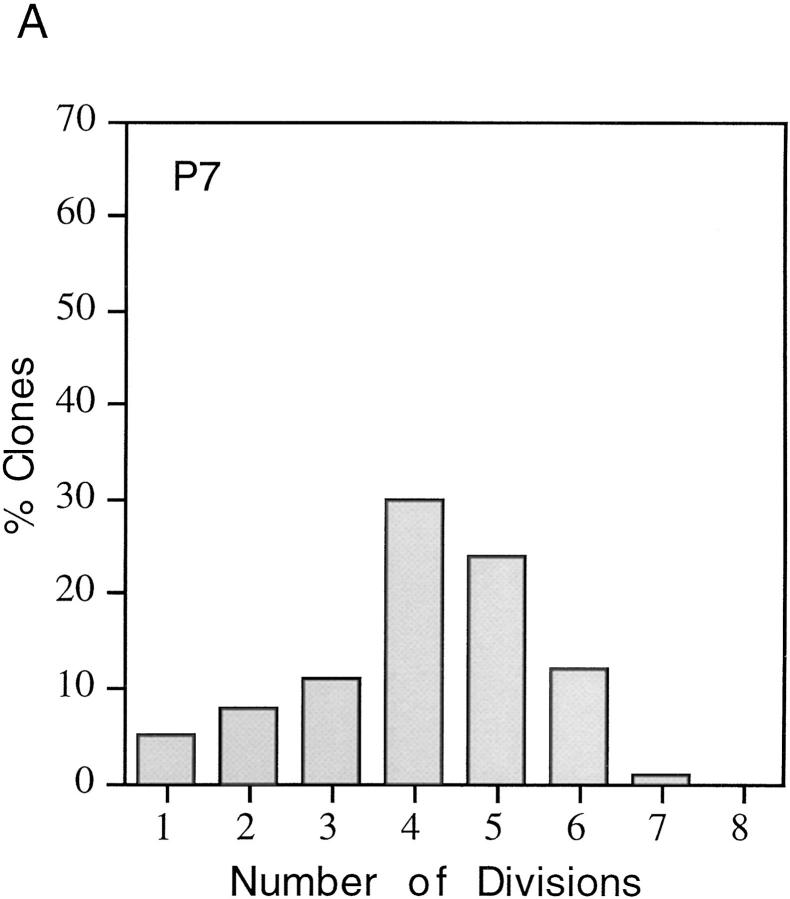
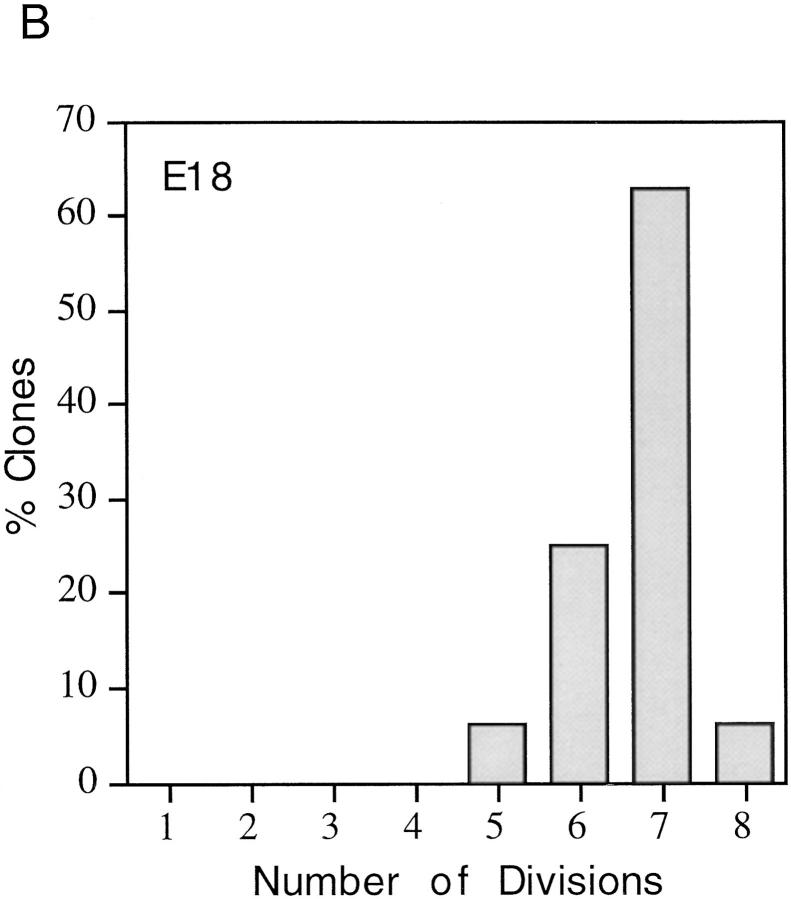
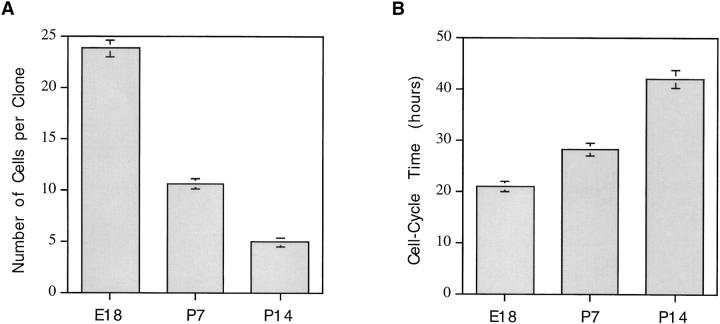
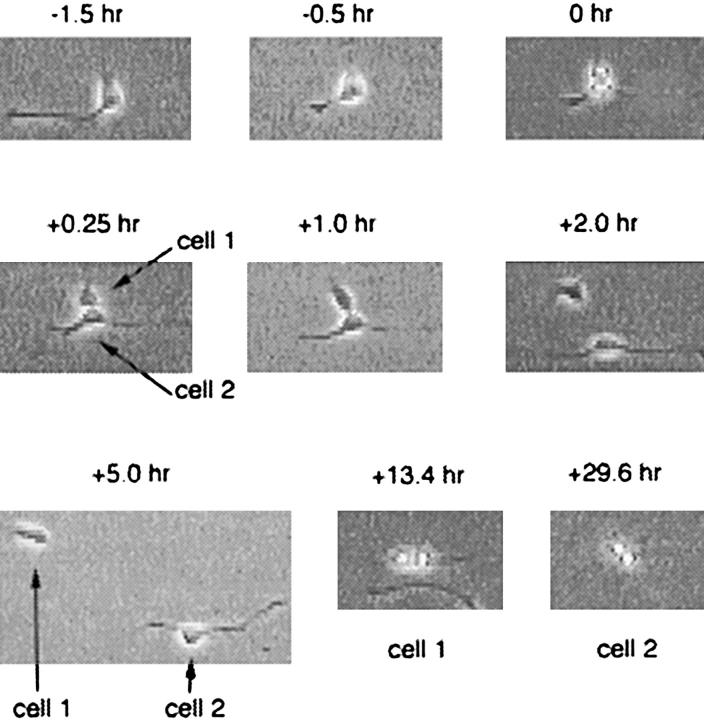
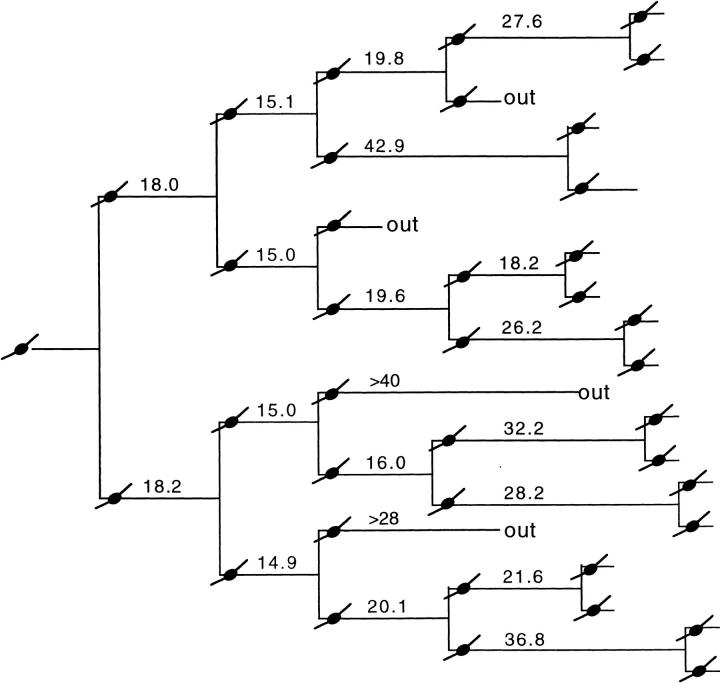
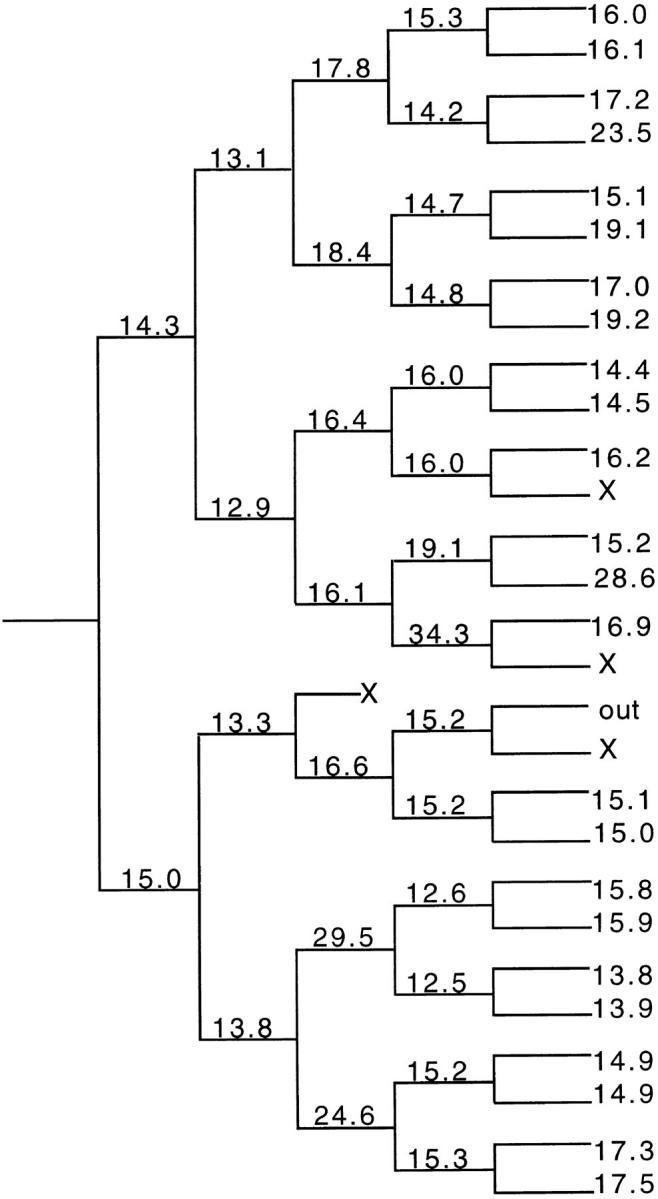
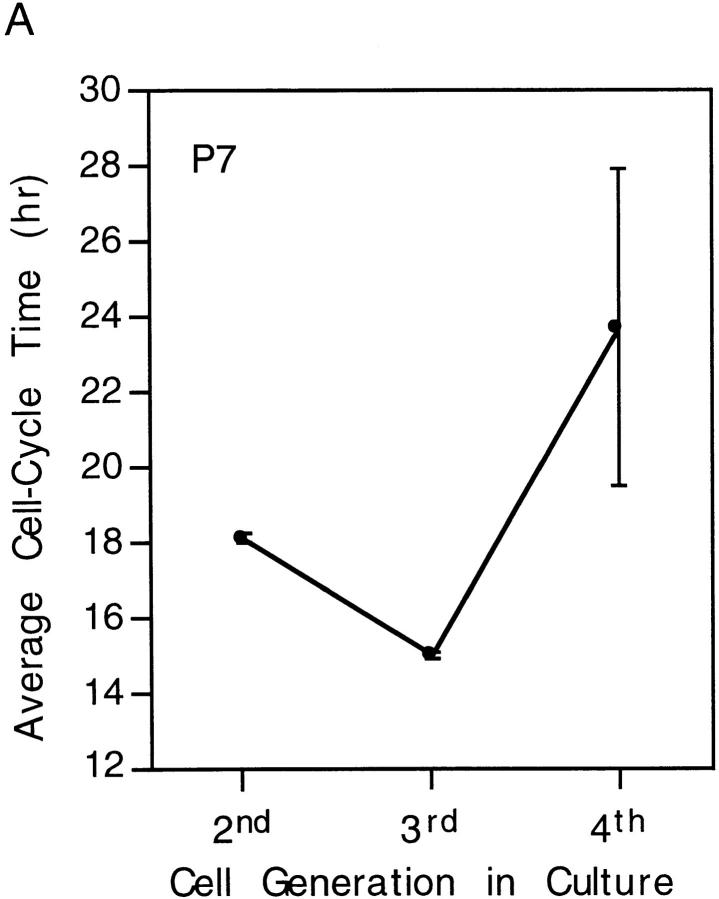
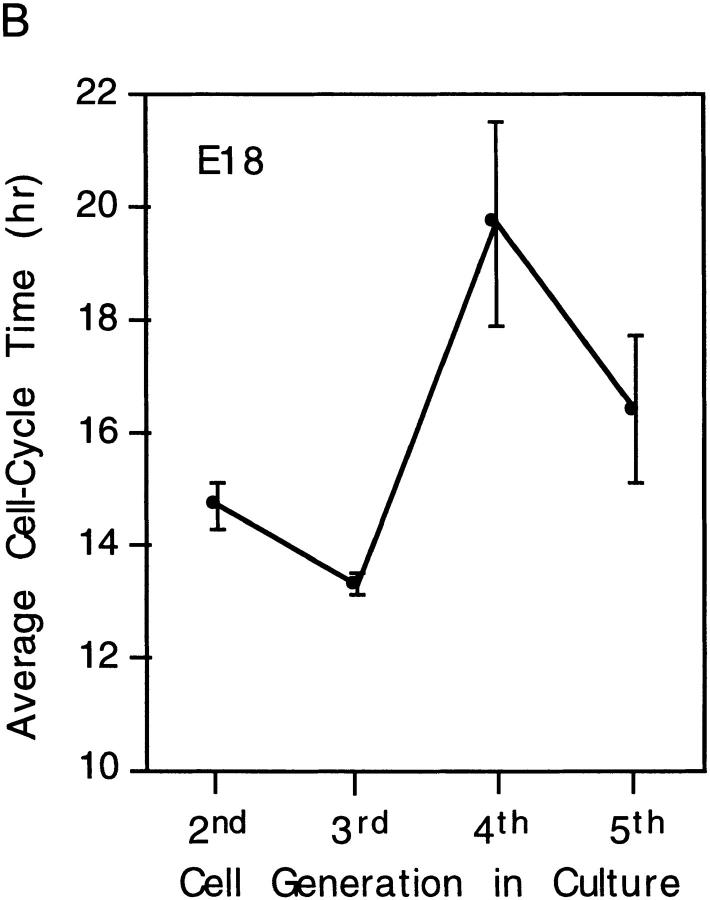
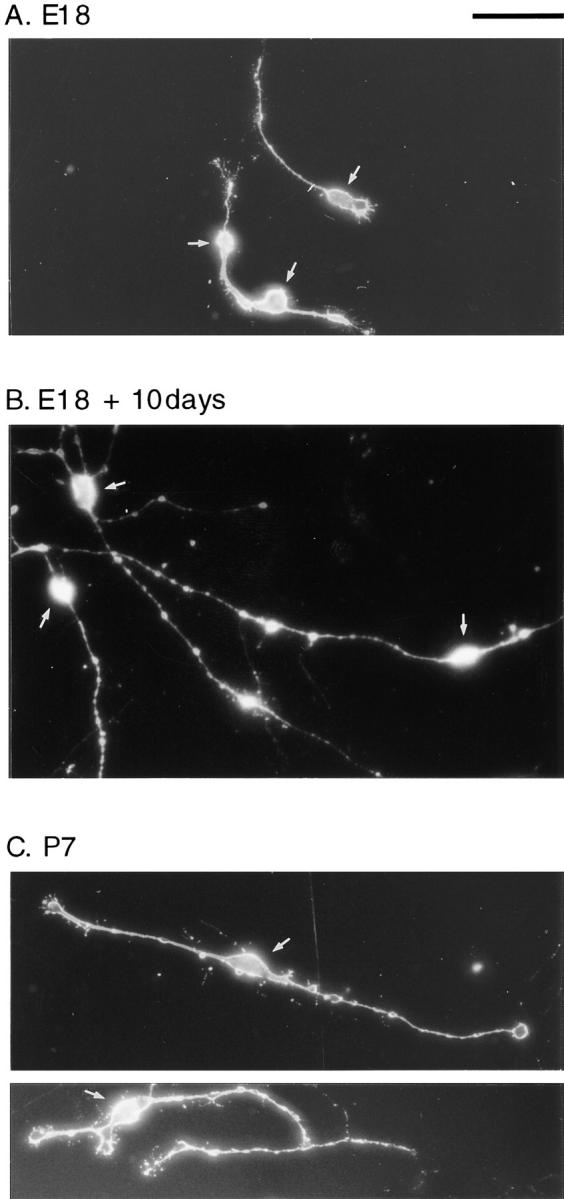
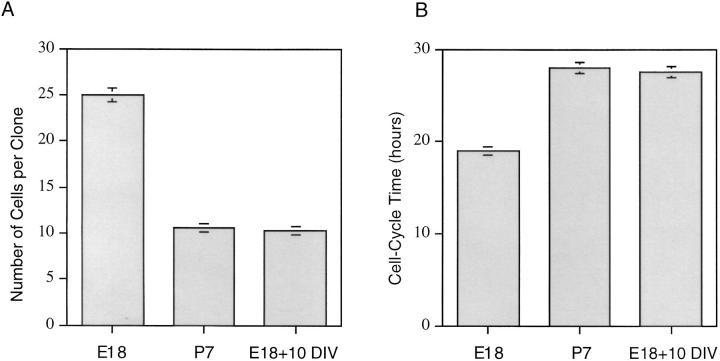
We have used clonal analysis and time-lapse video recording to study the proliferative behavior of purified oligodendrocyte precursor cells isolated from the perinatal rat optic nerve growing in serum-free cultures. First, we show that the cell cycle time of precursor cells decreases with increasing concentrations of PDGF, the main mitogen for these cells, suggesting that PDGF levels may regulate the cell cycle time during development. Second, we show that precursor cells isolated from embryonic day 18 (E18) nerves differ from precursor cells isolated from postnatal day 7 (P7) or P14 nerves in a number of ways: they have a simpler morphology, and they divide faster and longer before they stop dividing and differentiate into postmitotic oligodendrocytes. Third, we show that purified E18 precursor cells proliferating in culture progressively change their properties to resemble postnatal cells, suggesting that progressive maturation is an intrinsic property of the precursors. Finally, we show that precursor cells, especially mature ones, sometimes divide unequally, such that one daughter cell is larger than the other; in each of these cases the larger daughter cell divides well before the smaller one, suggesting that the precursor cells, just like single-celled eucaryotes, have to reach a threshold size before they can divide. These and other findings raise the possibility that such stochastic unequal divisions, rather than the stochastic events occurring in G1 proposed by "transition probability" models, may explain the random variability of cell cycle times seen within clonal cell lines in culture.


Figures

Figure 1
Figure 1
Increasing clonal size with increasing concentrations of PDGF. Purified P7 precursor cells were cultured at clonal density for 4 d in varying concentrations of PDGF and in the absence of TH, and the number of cells in each clone was counted in an inverted phase-contrast microscope. Half the medium was replaced at 2 d. The results are expressed as mean ± SEM of at least 100 clones. As judged by morphology (Temple and Raff, 1986), at 0.1 ng/ml PDGF, most clones were oligodendrocyte clones; at 0.3 ng/ ml most were still precursor clones and at 1.0 and 10 ng/ml all were still precursor clones.
Figure 2
Figure 2
Clonal size in cultures of purified E18, P7, or P14 precursor cells in the presence of both mitogens and TH. The number of cells in each clone was counted on days 3, 6, and 9 in vitro, and 50–100 clones were averaged for each E18 time point and at least 100 clones for each P7 and P14 time point. By day 9 most of the P7 and P14 cells had stopped dividing and differentiated into oligodendrocytes, while many E18 cells were still precursor cells. The results are expressed as mean ± SEM.
Figure 3
Figure 3
Proliferative capacity of purified P7 (A) and E18 (B) precursor cells cultured for 6 d at clonal density in the presence of both mitogens and TH. The cell number in each clone was recorded, and 50–100 clones were analyzed for each age. Clones containing 2 cells were classified as having gone through 1 division, 3–4 cells as 2 divisions, 5–8 cells as 3 divisions, and so on.
Figure 3
Figure 3
Proliferative capacity of purified P7 (A) and E18 (B) precursor cells cultured for 6 d at clonal density in the presence of both mitogens and TH. The cell number in each clone was recorded, and 50–100 clones were analyzed for each age. Clones containing 2 cells were classified as having gone through 1 division, 3–4 cells as 2 divisions, 5–8 cells as 3 divisions, and so on.
Figure 4
Figure 4
Clone size (A) and cell cycle time (B) in cultures of purified E18, P7, or P14 precursor cells cultured for 4 d at clonal density in the presence of mitogens but in the absence of TH to inhibit differentiation. The number of cells in each clone was counted; 50–100 clones were averaged for E18 cells and at least 100 clones for P7 and P14 cells. The cell cycle times were calculated from the average clone sizes. The results are expressed as mean ± SEM.
Figure 5
Figure 5
An unequal cell division and its consequences observed by time-lapse video recording. Purified P7 precursor cells were cultured as in Fig. 4. The cells shown at −1.5 and −0.5 h divided unequally at 0 h, with one daughter cell (cell 1) inheriting the two cell processes that failed to withdraw before cytokinesis occurred. Cell 1 went on to divide at +13.4 h, while its sister (cell 2) divided at +29.6 h.
Figure 6
Figure 6
Time-lapse video analysis of a single P7 precursor cell clone in a culture grown as in Fig. 4. The cells were cultured for 1 d before recording began, so that the first cell cycle was not recorded. Cell cycle times (in hours) were determined by measuring the time between mitotic telophases. One representative experiment is shown here; two other clones were analyzed with similar results. “Out” in this figure and the next refers to a cell that migrated out of the field of observation.
Figure 7
Figure 7
Time-lapse video analysis of a single E18 precursor cell clone in a culture grown and assessed as in Fig. 6. One representative experiment is shown here; one other clone was analyzed with similar results. Each X represents a cell that died (by apoptosis) for unknown reasons.
Figure 8
Figure 8
Oscillations in cell cycle times with each round of division in P7 and E18 clones. The data in A were taken from Fig. 6 and in B from Fig. 7; they are expressed as mean ± SEM for each cell generation.
Figure 8
Figure 8
Oscillations in cell cycle times with each round of division in P7 and E18 clones. The data in A were taken from Fig. 6 and in B from Fig. 7; they are expressed as mean ± SEM for each cell generation.
Figure 9
Figure 9
Morphological maturation of E18 precursor cells in culture. Purified E18 (A) and P7 precursor cells (C) were cultured for 2 d in slide flask as in Fig. 4. In B, E18 cells were cultured for 10 d as in Fig. 4 and were then removed with trypsin and recultured in the same conditions for an additional 2 d. The cells were fixed and stained with A2B5 antibody to visualize the cell morphology. The arrows indicate the location of the cell bodies. Bar, 50 μm.
Figure 10
Figure 10
Maturation of E18 precursor cells in culture. Purified E18 precursor cells were cultured as in Fig. 4. After 10 d, the cells were removed from the culture flask with trypsin and were then recultured at clonal density in the same conditions for an additional 4 d. Clone size (A) and cell cycle time (B) were then compared with those in clonal density cultures prepared from purified, freshly isolated E18 and P7 precursor cells and maintained in the same conditions. 50–100 clones were averaged for each data point, and the results are expressed as mean ± SEM. DIV, days in vitro.

References

    1. Barres B, Raff M. Control of oligodendrocyte number in the developing rat optic nerve. Neuron. 1994;12:935–942. - PubMed
    1. Barres B, Hart I, Coles H, Burne JF, Voyvodic J, Richardson W, Raff M. Cell death and control of cell survival in the oligodendrocyte lineage. Cell. 1992;70:31–46. - PubMed
    1. Barres B, Schmid R, Sendtner M, Raff M. Multiple extracellular signals are required for long term oligodendrocyte survival. Development. 1993;118:283–295. - PubMed
    1. Barres B, Lazar M, Raff M. A novel role for thyroid hormone, glucocorticoids and retinoic acid in timing oligodendrocyte development. Development. 1994;120:1097–1108. - PubMed
    1. Brooks RF, Bennett DC, Smith JA. Mammalian cell cycles need two random transitions. Cell. 1980;19:493–504. - PubMed

Publication types

MeSH terms

Substances