. 1997 Sep 1;11(17):2214-26.
doi: 10.1101/gad.11.17.2214.

An RNA enhancer in a phage transcriptional antitermination complex functions as a structural switch

Affiliations

An RNA enhancer in a phage transcriptional antitermination complex functions as a structural switch

L Su et al. Genes Dev. .

Abstract

Antitermination protein N regulates the transcriptional program of phage lambda through recognition of RNA enhancer elements. Binding of an arginine-rich peptide to one face of an RNA hairpin organizes the other, which in turn binds to the host antitermination complex. The induced RNA structure mimics a GNRA hairpin, an organizational element of rRNA and ribozymes. The two faces of the RNA, bridged by a sheared GA base pair, exhibit a specific pattern of base stacking and base flipping. This pattern is extended by stacking of an aromatic amino acid side chain with an unpaired adenine at the N-binding surface. Such extended stacking is coupled to induction of a specific internal RNA architecture and is blocked by RNA mutations associated in vivo with loss of transcriptional antitermination activity. Mimicry of a motif of RNA assembly by an RNA-protein complex permits its engagement within the antitermination machinery.


Figures

Figure 1
Figure 1
Overview of λ N regulatory system. (A) The N protein binds to an RNA enhancer element in the nascent message (nut site; asterisk indicates boxB RNA hairpin) and to host factors and RNAP to direct formation of a processive antitermination complex. Not shown: nut boxA RNA motif and interactions of the N–nut complex with host Nus elongation factors, including NusA. (B) Closing base pair (U5 and A11) and purine-rich pentaloop (bases 6–10; underlined) of 15-base nutL boxB (5′-GCCCUGAAGAAGGGC-3′), with numbering scheme as shown. Red-outlined box (Trp-18) and nucleoside position (7) indicate site of indole–adenine stacking; blue nucleosides (7–10) exhibit a specific pattern of base-pairing (A10), -stacking (asterisk), and flipping (G9). Black rectangles indicate stacking between closing base pair (UA) and GA sheared base pair. Bidirectional arrows indicate NOEs between purines; base 9 is “flipped out.” Peptide–RNA contacts (such as A7–Trp-18) were identified by isotope-filtered NMR experiments designed to resolve NOEs between 13C- or 15N-attached protons in a labeled peptide and 12C- or 14N-attached protons in the unlabeled RNA (Su et al. 1997). (C) Effects of base substitutions on the biological activity of the N–nut system in vivo (Doelling and Franklin 1989); analogous results have been obtained by Chattapadhyay et al. (1995a). One hundred percent is defined as the activity exhibited by the GAAAA loop. Bars are color-coded by base: dark blue (G), red (A), green (U), and black (C). (D) Structure of sheared GA base pair. The 2-amino group of guanine is shown in red; the asterisk indicates guanine imino proton (not involved in hydrogen bonding).
Figure 2
Figure 2
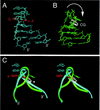
(A) Crystal structure of a GNRA (GAAA) tetraloop (Pley et al. 1994b; Brookhaven Databank accession no. 1HMH). The closing sheared GA base pair is shown in red; the structure is otherwise shown in cyan. (B) Solution structure of a non-GNRA (CUUG) tetraloop (F. Jucker and A. Pardi, in prep.; Brookhaven Databank accession no. 1RNG). The closing Watson–Crick GC base pair is shown in white; the structure is otherwise shown in green. The arrow indicates overall reorientation of the loop and redirection of CG base pair. (C) Comparison of tetraloop structures. The two structures are aligned according to the backbone atoms of the stem. The coloring scheme is as in A and B. The pairing scheme of the closing base pair (sheared GA vs. Watson–Crick CG) defines the orientation of the loop relative to the stem.
Figure 3
Figure 3
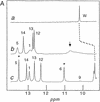
(A) 1D 1H–NMR spectra in H2O at 400 Mhz and 25°C: (a) Free λP1 with unique tryptophan (Trp-18) indole NH resonance; (b) free boxB RNA hairpin with imino resonances assigned as indicated. G1 and U5 exhibit partial broading at ends of stem. The arrow indicates additional unassigned broad imino resonance of guanine (10.75 ppm), presumably representing a fraying GA base pair. (c) Spectrum of specific complex with imino resonances assigned as indicated. Asterisks indicate sharp downfield imino resonance of U5 and sharp but upfield imino resonance of G6, proposed to participate in a sheared GA base pair (Fig. 1D). The indole NH resonance of Trp-18 exhibits a 0.9 ppm upfield complexation shift (broken line; see Fig. 5A). The peptide and RNA were each 2 mm (B) Sequential assignment of RNA in the λP1, complex at 25°C and 750 MHz. Connectivities in stem and loop are shown in red and blue, respectively. Positions of adenine H2 resonances are indicated at top. The broken line indicates only a single NOE from the H2 of A7 in this region (cross peak g, A7–H2/A8–H1′). The asterisk indicates NOE between G9–H8 and G9–H3′, the latter at an anomalous chemical shift. Assignment of cross peaks a, A10–H2/A11–H1′; c, A11–H2/G6–H1′ (immediately below is the larger A11–H2/U5–H1′); d, A8–H2/A10–H1′; and e, A10–H8/A8–H1′. Boxes b and f indicate missing NOEs between nucleosides 8–9 and 9–10, respectively, reflecting flipping out of G9 (see Fig. 1B).
Figure 3
Figure 3
(A) 1D 1H–NMR spectra in H2O at 400 Mhz and 25°C: (a) Free λP1 with unique tryptophan (Trp-18) indole NH resonance; (b) free boxB RNA hairpin with imino resonances assigned as indicated. G1 and U5 exhibit partial broading at ends of stem. The arrow indicates additional unassigned broad imino resonance of guanine (10.75 ppm), presumably representing a fraying GA base pair. (c) Spectrum of specific complex with imino resonances assigned as indicated. Asterisks indicate sharp downfield imino resonance of U5 and sharp but upfield imino resonance of G6, proposed to participate in a sheared GA base pair (Fig. 1D). The indole NH resonance of Trp-18 exhibits a 0.9 ppm upfield complexation shift (broken line; see Fig. 5A). The peptide and RNA were each 2 mm (B) Sequential assignment of RNA in the λP1, complex at 25°C and 750 MHz. Connectivities in stem and loop are shown in red and blue, respectively. Positions of adenine H2 resonances are indicated at top. The broken line indicates only a single NOE from the H2 of A7 in this region (cross peak g, A7–H2/A8–H1′). The asterisk indicates NOE between G9–H8 and G9–H3′, the latter at an anomalous chemical shift. Assignment of cross peaks a, A10–H2/A11–H1′; c, A11–H2/G6–H1′ (immediately below is the larger A11–H2/U5–H1′); d, A8–H2/A10–H1′; and e, A10–H8/A8–H1′. Boxes b and f indicate missing NOEs between nucleosides 8–9 and 9–10, respectively, reflecting flipping out of G9 (see Fig. 1B).
Figure 4
Figure 4
(A) Tryptophan fluorescence spectra of of the free peptide (open boxes), native complex (solid line), and variant complex C10 complex (thick dashed line). Peptide and RNA concentrations were 5 μm. A control for the inner filter effect is shown in the two upper control spectra: free peptide (– ⋅ –) and an equimolar mixture of free peptide and free RNA (---) in 2 m KCl (pH 7.4). (B) CD spectra of the free C10 RNA (open boxes), free peptide (– ⋅ –), and variant complex (thick dashed line). A reference spectrum of the native complex is also shown (wt; solid line). Deconvolution of the wild-type difference spectrum suggests that 16 residues are helical in the bound state. The arrow (a) indicates an attenuated signal at the helix-sensitive wavelength, 222 nm. The asterisk indicates RNA-specific perturbation in the native complex; its attenuation in the variant complex is labeled at arrow b. This perturbation, similar to that of a Rev–RRE complex (Tan and Frankel 1994), is not amendable to detailed interpretation. Analysis of difference spectra reveals attenuation of induced α-helix content (see Table 2 and footnote). Peptide and RNA concentrations were 25 μm. (C) 400-MHz 1H–NMR spectrum of amino protons in the C10 RNA variant demonstrate stabilization of the U5–A11 base pair (asterick) and extension of the stem to G6–C10. Assignments are as indicated; the arrow indicates the new G6 imino resonance of the GC base pair. (D) 600 MHz 1H–NMR spectra of 1:1 peptide–A10C RNA complex at 5°C, 15°C, and 25°C. Corresponding resonances in major and minor states are outlined; the asterisk indicates upfield indole NH resonance of Trp-18 in the minor state. In the major mode the RNA chemical shifts are similar to those of the free RNA; the chemical shifts of Trp-18 (but not those of amino acids such as Thr-5) are near those of the free peptide. In the minor mode these chemical shifts resemble those of the native complex, including the indole ring’s large upfield complexation shift. The ratio of major to minor populations increases with increasing temperature. Spectra were obtained at a complex concentration of 1 mm in 50 mm NaCl and 10 mm sodium phosphate (pH 6.0).
Figure 5
Figure 5
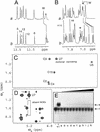
1H–NMR analysis of A7U variant complex. (A, B) Imino and nonexchangable aromatic resonances of the native (b) and variant (a) complexes. Large changes in Trp-18-specific resonances are shown as solid vertical lines (A); constancy of A10–H2 and A8–H2 resonances are shown as broken vertical lines. Assignment of imino resonances is as indicated. H2O and D2O spectra were collected at 400 and 600 MHz, respectively, at 25°C. (C) TOCSY spectrum of A7U complex (mixing time 55 msec at 25°C at 600 MHz) reveals motional narrowing of U7 base protons relative to cytosine and uridine resonances in the stem. The chemical shifts of these major groove pyrimidine resonances are not significantly changed by the A7U substitution. (D) NOESY spectrum in D2O (mixing time 300 msec at 25°C and 600 MHz) shows weak contact between Trp-18 indole ring (H5) and U7–H5 (arrow) but no other U7-base contacts. (box) The A7U complex was made 1 mm in NMR buffer. (E) GMSA showing weak binding of the A7U RNA (a–k) at concentrations 0, 10, 20, 30, 40, 50, 60, 70, 80, 90, and 100 nm. A wild-type control is provided in the first two lanes. The dissociation constant as measured by fluorescence quenching is ∼125 nm (Table 1); the disproportionately weak gel shift is attributable in part to kinetic instability of the complex during the course of electrophoresis.
Figure 6
Figure 6
(A) Alignment of arginine-rich N sequences in phages λ, P22, and φ21 (Franklin 1985b; Chattapadhyay et al. 1995b) and termination factor Nun of phage φ HK022 (Hung and Gottesman 1995). Alanine conserved among N proteins is underlined. Dashes to the left of P22 and φ21 sequences indicate the presence of amino-terminal additional residues not in λ N. Essential side chains (as inferred from genetic analysis; Franklin 1993) are indicated by dark blue squares (Ala-3, three of five arginines; and Trp-18); these have the most restricted patterns of allowed substitutions. Other contributing residues are indicated by red squares (solid  > open), including two of five arginines. Substitution of proline at position 12 (P) confers native biological activity (Franklin 1993). (B–D) Comparison of boxB sites in lamboid phages. (B) Consensus boxB hairpin in phage λ showing specific pattern of base-pairing and base-flipping (purines 7 and 9). Three sites of peptide-base contact (Su et al. 1997) are as indicated. The open box indicates a sheared GA base pair; the black box highlights the position of contact with Ala-3 in the major groove. The RNase footprint of the N protein (Chattapadhyay et al. 1995a) is shown at left; the proposed allosteric surface involved in binding to the core antitermination complex is shown at right. (R) A functional preference or requirement for purine (Fig. 1C; Doelling and Franklin 1989). The proposed interaction of the flipped base (R9) with NusA in an antitermination complex is indicated. (C,D) Putative hairpin structures of boxB sites in phages P22 and φ21. P22 sites maintain possible GA base pair but lack a purine at position 8 (circle and asterisk); substitution of a purine enhances heterospecific binding of λ N peptide (Tan and Frankel 1995). The putative P22 stem also lacks a corrsponding CC element (black square). φ21 sites lack a possible GA base pair (oval and asterisk) and CC elements (black squares). Possible 5′-CU and 5′-UU recognition elements are highlighted. The red arrow in D indicates the absence of a purine at the site corresponding to A7–Trp-18 stacking in the λ boxB–peptide complex.

Similar articles

Cited by

References

    1. Albrechtsen B, Squires CL, Li S, Squires C. Antitermination of characterized transcriptional terminators by the Escherichia coli rrnG leader sequence. J Mol Biol. 1990;213:123–134. - PubMed
    1. Antao VP, Lai SY, Tinoco I., Jr A thermodynamic study of unusually stable RNA and DNA hairpins. Nucleic Acids Res. 1991;19:5901–5905. - PMC - PubMed
    1. Barik S, Ghosh B, Whalen W, Lazinski D, Das A. An antitermination protein engages the elongating transcription apparatus at a promoter-proximal recognition site. Cell. 1987;50:885–899. - PubMed
    1. Battiste JL, Tan R, Frankel AD, Williamson JR. Binding of an HIV Rev peptide to Rev responsive element RNA induces formation of purine-purine base pairs. Biochemistry. 1994;33:2741–2747. - PubMed
    1. Battiste JL, Mao H, Rao NS, Tan R, Muhandiram DR, Kay LE, Frankel AD, Williamson JR. Alpha helix-RNA major groove recognition in an HIV-1 rev peptide-RRE RNA complex. Science. 1996;273:1547–1551. - PubMed

Publication types

MeSH terms

Substances

LinkOut - more resources