. 1997 Oct 6;139(1):219-28.
doi: 10.1083/jcb.139.1.219.

Novel cytokine-independent induction of endothelial adhesion molecules regulated by platelet/endothelial cell adhesion molecule (CD31)

Affiliations

Novel cytokine-independent induction of endothelial adhesion molecules regulated by platelet/endothelial cell adhesion molecule (CD31)

M Litwin et al. J Cell Biol. .

Abstract

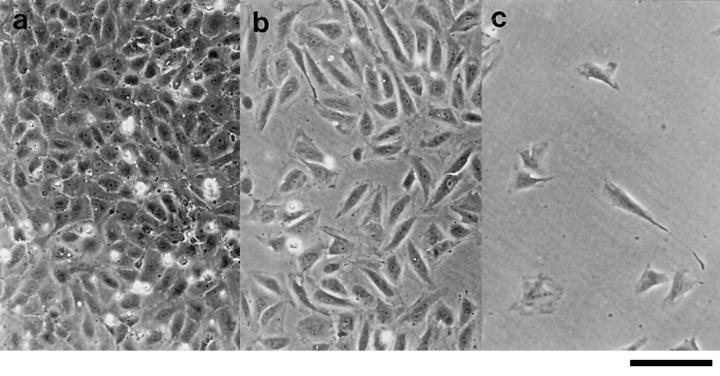
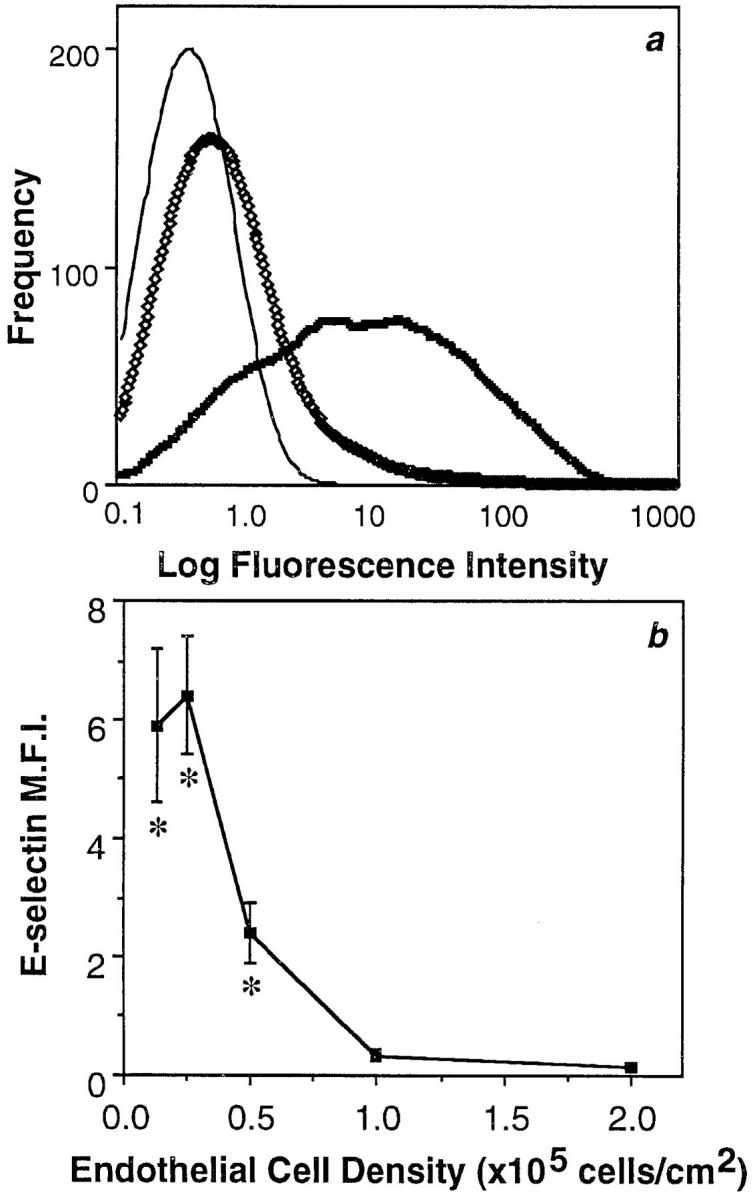
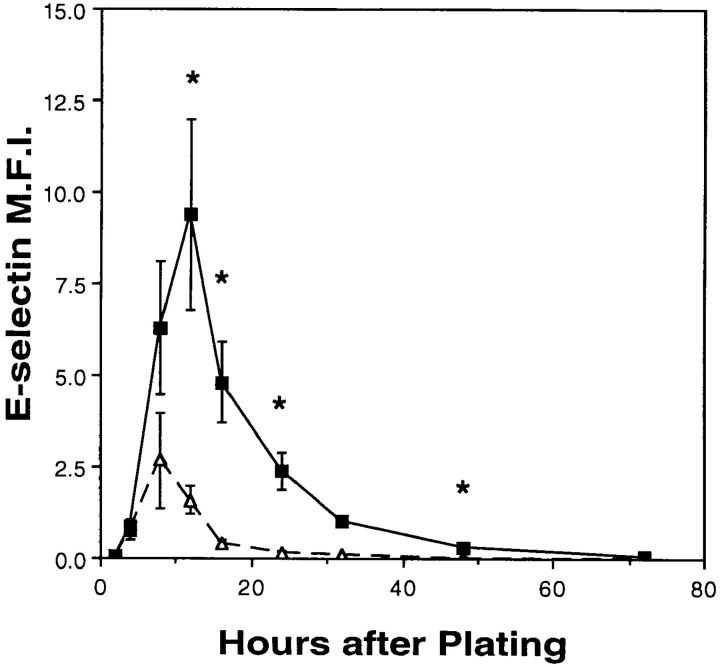
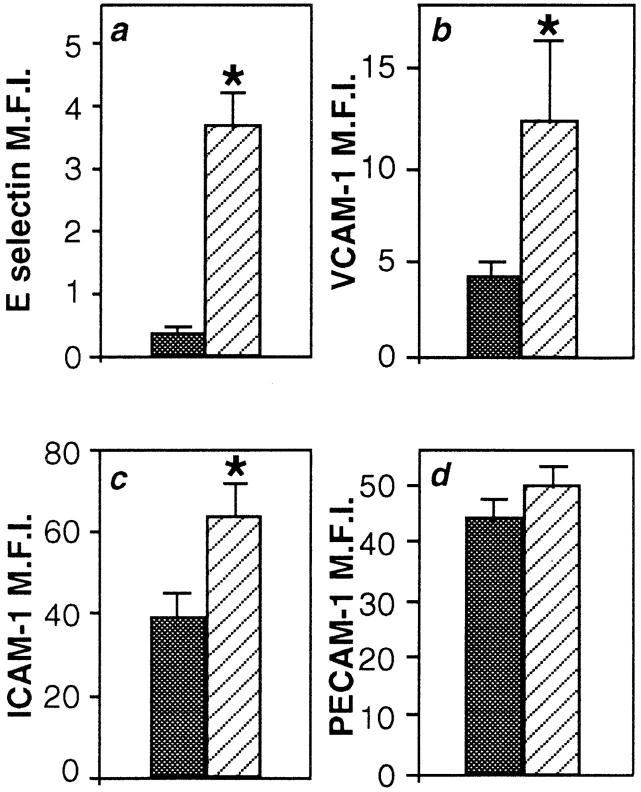
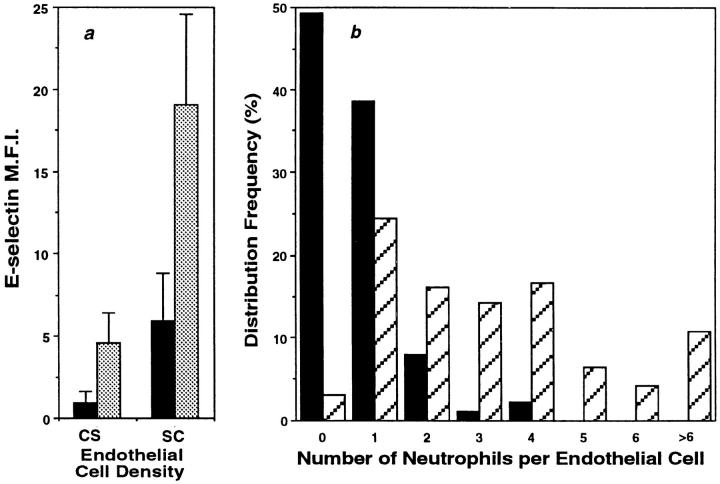
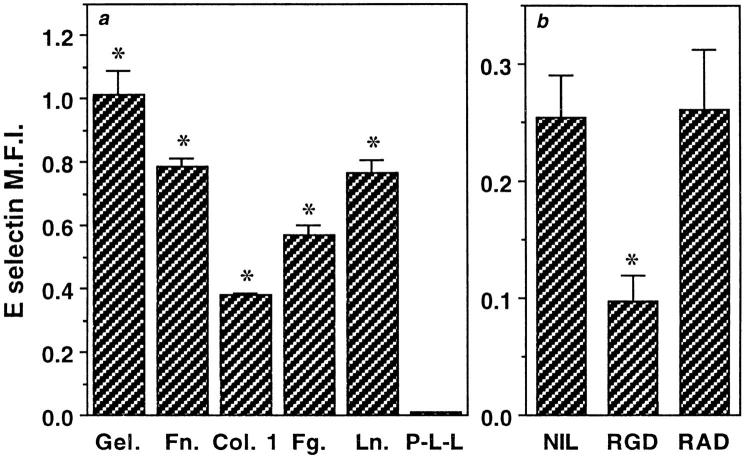
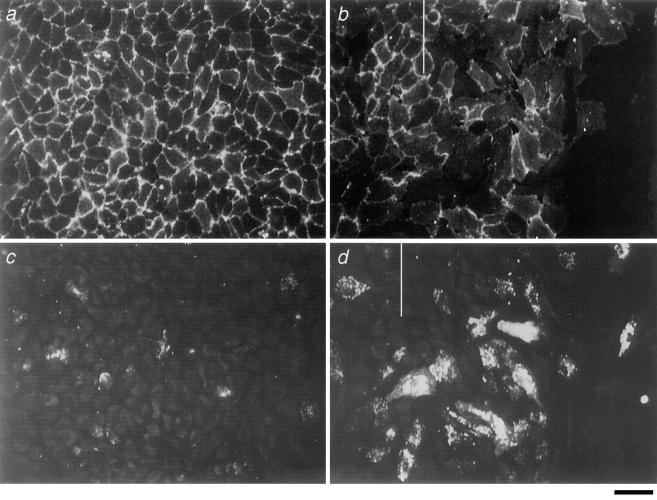
Tumor necrosis factor-alpha, interleukin-1, and endotoxin stimulate the expression of vascular endothelial cell (EC) adhesion molecules. Here we describe a novel pathway of adhesion molecule induction that is independent of exogenous factors, but which is dependent on integrin signaling and cell-cell interactions. Cells plated onto gelatin, fibronectin, collagen or fibrinogen, or anti-integrin antibodies, expressed increased amounts of E-selectin, vascular cell adhesion molecule-1, and intercellular adhesion molecule-1. In contrast, ECs failed to express E-selectin when plated on poly-L-lysine or when plated on fibrinogen in the presence of attachment-inhibiting, cyclic Arg-Gly-Asp peptides. The duration and magnitude of adhesion molecule expression was dependent on EC density. Induction of E-selectin on ECs plated at confluent density was transient and returned to basal levels by 15 h after plating when only 7 +/- 2% (n = 5) of cells were positive. In contrast, cells plated at low density displayed a 17-fold greater expression of E-selectin than did high density ECs with 57 +/- 4% (n = 5) positive for E-selectin expression 15 h after plating, and significant expression still evident 72 h after plating. The confluency-dependent inhibition of expression of E-selectin was at least partly mediated through the cell junctional protein, platelet/endothelial cell adhesion molecule-1 (PECAM-1). Antibodies against PECAM-1, but not against VE-cadherin, increased E-selectin expression on confluent ECs. Co- culture of subconfluent ECs with PECAM-1- coated beads or with L cells transfected with full-length PECAM-1 or with a cytoplasmic truncation PECAM-1 mutant, inhibited E-selectin expression. In contrast, untransfected L cells or L cells transfected with an adhesion-defective domain 2 deletion PECAM-1 mutant failed to regulate E-selectin expression. In an in vitro model of wounding the wound front displayed an increase in the number of E-selectin-expressing cells, and also an increase in the intensity of expression of E-selectin positive cells compared to the nonwounded monolayer. Thus we propose that the EC junction, and in particular, the junctional molecule PECAM-1, is a powerful regulator of endothelial adhesiveness.


Figures

Figure 1
Figure 1
Phase contrast photomicrographs of EC monolayers 15 h after seeding at confluent 1.0 (a), subconfluent 0.25 (b), and sparse 0.05 × 10⁵ cells per cm2 densities (c). Bar, 40 μm.
Figure 2
Figure 2
E-selectin expression varies with EC density. (a) Flow cytometry profile of a representative EC line stained for E-selectin 15 h after plating. Cells were plated at cobblestone (⋄⋄⋄, 105 cells per cm2) or subconfluent densities (thick line; 0.25 × 10⁵ cells per cm2). (thin line) Nonbinding control immunoglobulin, which gave a similar profile for confluent or subconfluent cells. (b) ECs were cultured for 15 h after plating at cell densities ranging from sparse to confluent (0.125– 2.0 × 10⁵ cells per cm2). The MFI ± SEM of E-selectin expression is shown for five EC lines, except for values at densities 0.5 and 2.0 × 10⁵ cells per cm2, which are triplicates. Asterisks indicate values significantly different (P < 0.003) from confluent density ECs (105 cells per cm2) by unpaired t test.
Figure 3
Figure 3
Time course of E-selectin expression after EC plating. ECs were plated at confluent (▵, 105 cells per cm2) and subconfluent (▪, 0.25 × 10⁵ cells per cm2) densities. The expression of E-selectin was assayed by flow cytometry at specified times after plating. The MFI (± SEM) of three to five cell lines is shown but values at 2, 32, and 72 h after plating are singlicates. Asterisks denote values significantly different between the two cell densities (P < 0.03) by paired t test.
Figure 4
Figure 4
Expression of E-selectin, VCAM-1, and ICAM-1 are confluency dependent. ECs plated at subconfluent density (stripes, 0.25 × 10⁵ cells per cm2) and confluent density (solid, 105 cells per cm2) were stained 20 h later for a, E-selectin, b, VCAM-1, c, ICAM-1, or d, PECAM-1. Expression is shown as the MFI of 23, 11, 7, and 7 EC lines, respectively. Error bars represent the SEM. Asterisks denote values significantly different from cells plated at cobblestone density (P < 0.03) by paired t test.
Figure 5
Figure 5
The induction of E-selectin on subconfluent ECs is not mediated through TNF-α or IL-1. (a) ECs plated at subconfluent density (0.25 × 10⁵ cells per cm2) were stimulated with 10 U/ml TNF-α (TNF) or 1 ng/ml IL-1β (IL-1) in the presence of anti–TNF-α (TNF + anti-TNF) (1:1,000), or IL-1ra (IL-1 + IL-1ra) (100 ng/ml), respectively. Inhibitors and agonists were added immediately after EC plating and E-selectin expression was assessed 12 h later. (b) ECs were plated at subconfluent density (stripes, 0.25 × 10⁵ cells per cm2) and confluent density (solid, 105 cells per cm2). Anti–TNF-α or IL-1ra were added at plating. E-selectin expression was assessed 12 h later. Results shown are of one representative experiment of four performed.
Figure 6
Figure 6
The non–cytokine-mediated pathway of E-selectin expression is additive with TNF-induced E-selectin expression and supports neutrophil adherence. (a) E-selectin expression on ECs plated at cobblestone density (105 cells per cm2) or subconfluent densities (0.25 × 10⁵ cells per cm2) 15 h after plating (black). In some groups 1 U/ml of TNF-α was added 4 h before analysis (gray). Results shown are the mean ± SEM of four EC lines. Differences between non–cytokine-induced expression and expression after TNF stimulation, were significant by paired t test (P = 0.04, confluent density ECs and P = 0.02 subconfluent density ECs). (B) 15 h after plating EC at either confluent (solid, 105 cells per cm2) or subconfluent densities (stripes, 0.25 × 10⁵ cells per cm2) neutrophils were added. 30 min later, attached neutrophils were removed by gentle washing and the number of neutrophils adherent per EC were counted using microscopy. A plot of the distribution frequency is shown. 176 ECs at cobblestone density and 168 ECs at subconfluent density were counted in the experiment shown, which is representative of at least three experiments. The two groups were statistically different (P = 0.01) by the Kolmogorov-Smirnov test.
Figure 7
Figure 7
Integrin engagement is critical for E-selectin induction. (a) ECs were plated onto multiwell dishes coated with 0.2% gelatin (Gel.) or 50 μg/ml of fibrinogen (Fg.), collagen 1 (Col. 1), fibronectin (Fn.), laminin (Ln.), or poly-l-lysine (P-L-L) for 2 h. The cells were plated at a density of 0.25 × 10⁵ cells per cm2 in 1% BSA without added FCS. Cells were stained with anti–E-selectin or control antibody 6 h later and results given as the mean ± SEM of triplicate determinations from one experiment, which is representative of at least three similar experiments. The background level of staining of cells on each matrix, using a nonbinding antibody has been subtracted. Asterisks denote values significantly different from control group, which was stained with nonbinding antibody (P < 0.002). (b) EC at subconfluent density (0.25 × 10⁵ cells per cm2) were plated onto fibrinogen-coated wells in the presence of cyclic RGD (Arg-Gly-Asp) or RAD (Arg-Ala-Asp) peptides (final concentration 10 μM) in 1% BSA-containing media. E-selectin expression was measured 6 h after plating and is given as the mean ± SEM of a representative experiment where each group was performed in triplicate. Asterisks denote values significantly different from control peptide (P < 0.01).
Figure 8
Figure 8
Anti–PECAM-1 antibody upregulates E-selectin on ECs plated at cobblestone density. (a) ECs at cobblestone density (105 cells per cm2) were treated with Ig-purified rabbit polyclonal antibody to PECAM-1 (5 μg/ml) or a control nonimmune rabbit Ig at the time of plating. E-selectin expression was assessed by flow cytometry 12 h later. The MFI (± SEM ) of two to six experiments is given where untreated confluent density ECs have been normalized to 1.0. Subconfluent ECs showed a 5.1 ± 1.4-fold increase in E-selectin expression relative to confluent EC. Asterisks denote a significant difference (P < 0.05) compared with control rabbit Ig by unpaired t test. (b) ECs at confluent density were treated with 5 μg/ml Ig-purified mAbs to PECAM-1 or VE-cadherin at the time of plating or polyclonal anti–PECAM-1 antibody. E-selectin expression was measured 12 h later. The MFI (± SEM) of three experiments is given where untreated confluent density ECs have been normalized to 1.0. Subconfluent ECs showed a 4.0 ± 0.7-fold relative increase in E-selectin expression relative to confluent EC. Asterisks denote a significant difference (P < 0.05) compared with cobblestone EC group.
Figure 9
Figure 9
Adhesion through PECAM-1–coated beads downregulates E-selectin. ECs at subconfluent density (0.25 × 10⁵ cells per cm2) were plated in the absence or presence of beads (20 beads per cell) coated either with purified PECAM-1 or the blocking agent (BSA) alone. Cells at high density (105 cells per cm2) were also plated. E-selectin expression was measured 18 h after plating. The data represents three experiments where each group was performed in triplicate and is presented relative to the E-selectin expression on subconfluent ECs, which is shown as 100%. (The mean MFI at 100% was 2.01 ± 0.09.) Asterisk indicates where PECAM-1–coated beads significantly decreased E-selectin (P < 0.001 by ANOVA) compared to BSA-coated beads.
Figure 10
Figure 10
PECAM-1–transfected L cells regulate E-selectin expression. (a) EC at subconfluent density (0.2 × 10⁵ cells per cm2) were plated in the presence or absence of various concentrations of PECAM-1–transfected L cells (○, full-length PECAM-1; □, domain 2 deletion mutant; ▵, untransfected L cells). EC were also plated at high density (♦). A ratio of 1 EC to 8 L cells would be equivalent in cell number to a high density culture of EC. 18 h later, cells were harvested and stained with goat anti–E-selectin polyclonal antibody and detected using an anti–goat labeled polyclonal antibody together with a mouse anti–VE-cadherin antibody and detected with an anti–mouse, FITC-conjugated antibody. Cells were analyzed by two color analysis, and only the fluorescein positive (i.e., EC) were analyzed for E-selectin expression. The results are given as the MFI of one representative experiment of at least four performed where a similar trend was seen in each. (b) Subconfluent EC were plated as in a but either the full-length, PECAM-1 L cell transfectants (○), or cytoplasmic tail deletion mutant (X). Analysis was as for a and is given as the MFI of a representative experiment of at least four performed.
Figure 11
Figure 11
Immunofluorescence confocal microscopy of wounded ECs 40 h after plating and 11 h after wounding. a and c are cobblestone monolayers distant from the wound front. b and d are ECs at wound edges. a and b are stained for PECAM-1, whereas c and d are stained for E-selectin. b and d are not the same area but are of representative areas along the migrating front. The wound front is marked with a vertical bar. Bar, 40 μm.

References

    1. Albelda SM, Muller WA, Buck CA, Newman PJ. Molecular and cellular properties of PECAM-1 (endoCAM/CD31): a novel vascular cell– cell adhesion molecule. J Cell Biol. 1991;114:1059–1068. - PMC - PubMed
    1. Antonelli-Orlidge A, Saunders KB, Smith SR, D'Amore PA. An activated form of transforming growth factor β is produced by cocultures of endothelial cells and pericytes. Proc Natl Acad Sci USA. 1989;86:4544–4548. - PMC - PubMed
    1. Ayalon O, Sabanai H, Lampugnani M-G, Dejana E. Spatial and temporal relationships between cadherins and PECAM-1 in cell–cell junctions of human endothelial cells. J Cell Biol. 1994;126:247–258. - PMC - PubMed
    1. Berman ME, Muller WA. Ligation of platelet/endothelial cell adhesion molecule-1 (PECAM-1, CD31) on monocytes and neutrophils increases binding capacity of leukocyte CR3 (CD11b/CD18) J Immunol. 1995;154:299–307. - PubMed
    1. Berman ME, Xie Y, Muller WA. Roles of platelet/endothelial cell adhesion molecule-1 (PECAM-1, CD31) in natural killer cell transendothelial migration and β2 integrin activation. J Immunol. 1996;156:1515–1524. - PubMed

Publication types

MeSH terms