. 1997 Oct 6;186(7):1099-106.
doi: 10.1084/jem.186.7.1099.

Peripheral selection of T cell repertoires: the role of continuous thymus output

Affiliations

Peripheral selection of T cell repertoires: the role of continuous thymus output

C Tanchot et al. J Exp Med. .

Abstract

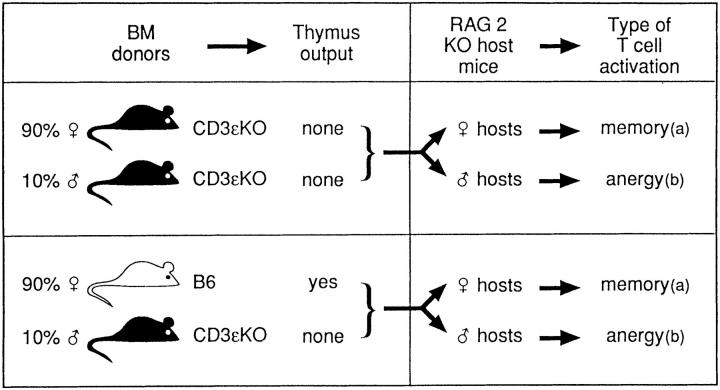
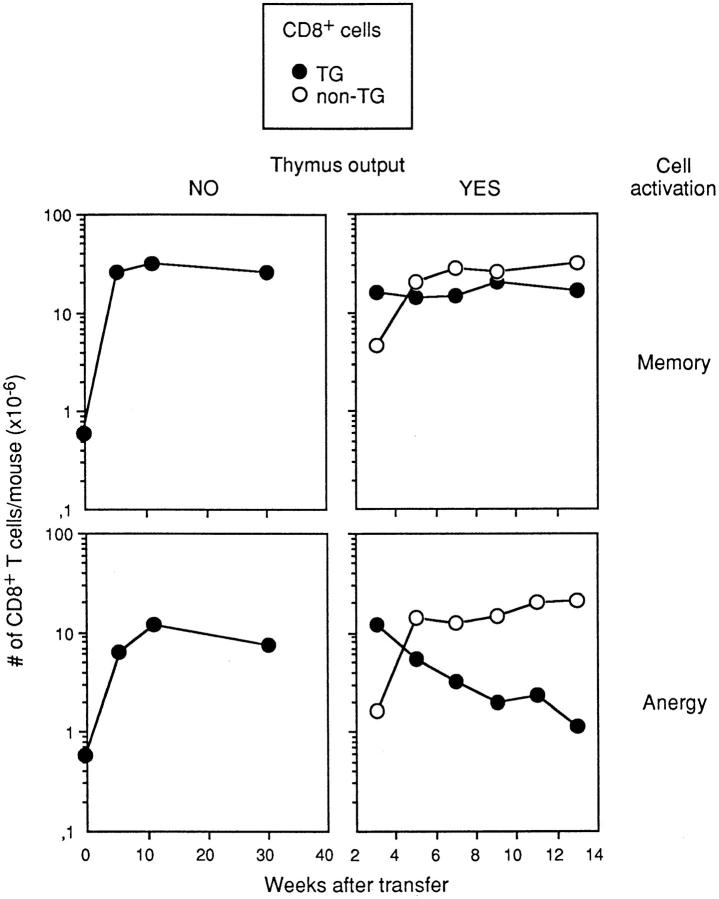
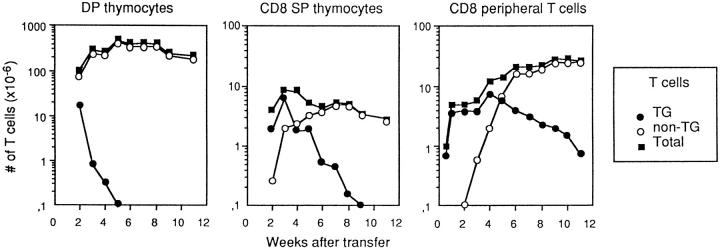
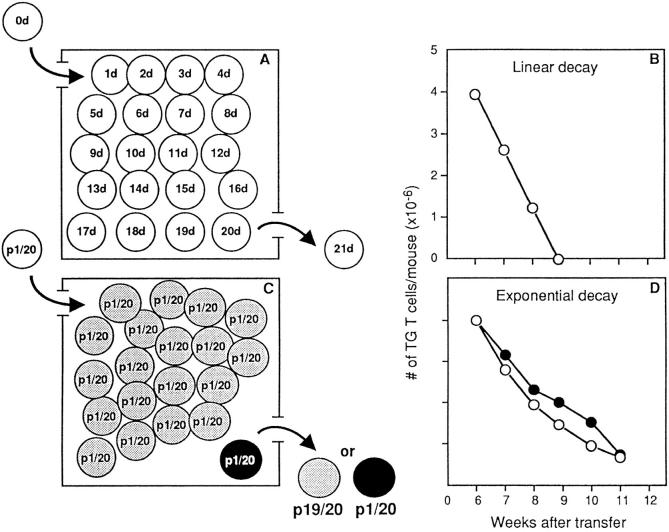
We investigated the role of continuous thymus output in the shaping of mature T cell repertoires by studying in vivo the survival of a single clone of mature Rag2-deficient T cell receptor (TCR) transgenic cells at different stages of activation in the absence or presence of thymus export. In the absence of thymus export, TCR-transgenic lymphocytes survived indefinitely in the peripheral pools. When new lymphocytes were produced in the thymus and migrated to the periphery, resident memory T cells were maintained in constant numbers, whereas naive and self-reactive T cells were replaced by recent thymus migrants. This T cell renewal ensured both the efficiency of recall responses to antigens as memory T cells persisted independently of thymus output, and the capacity of the immune system to respond to new antigen stimulation as the naive T cell pool was continuously renewed. Our results also indicate that thymus export is required to control the number of self-reactive peripheral T cells that may invade the peripheral pools if thymus output fails.


Figures

Figure 1
Figure 1
Generation of male/female chimeric mice, with our without thymus export. All male/female chimeras were injected with 0.5 × 10⁶ Tg cells. (a) Tg cells remain functional. (b) Tg cells become tolerant.
Figure 2
Figure 2
Male/female chimeras were generated as described in Fig. 1, injected with 0.5 × 10⁶ Tg cells and studied at different times after Tg cell transfer. Results represent the number of CD8+ Tg (closed circles) and non-Tg cells (open circles) recovered, and are the mean for 2–3 mice/time point. (Left) Chimeras received only CD3ε-deficient BM, and had no thymus output. (Right) Host mice received B6 BM that recolonized the thymus. (Top) Female hosts, where Tg cells acquire the properties of memory cells. (Bottom) Male hosts, where Tg cells become tolerant. The times scales on the left and right graphs are different.
Figure 3
Figure 3
Female TCR Tg mice were irradiated (400 R), injected with 5 × 10⁶ B6 BM cells, and studied at different times after T cell transfer. Results are the number of CD4+CD8+ (left) and CD8+CD4 (middle) thymocytes and CD8+ T peripheral T cells (right), and are the mean for 2 mice/experimental point in one typical experiment out of three.
Figure 4
Figure 4
The two hypotheses to explain the kinetics of substitution of naive T cells by thymus migrants. (Left) Boxes represent the periphery, where 20 different elements are pictured. Each element represents an individual cell. (Top) Substitution is conditioned by the age of the cell. (A) Each cell has a different age. Each day the younger cell (the thymus migrant) is incorporated in a peripheral pool, and the older cell dies. (B) Linear decay, calculated according to the formula Xt = X0 (1 − at). (Bottom) Substitution is cell age independent. (C) A large clone (19 elements), is shown in gray, and a small clone (1 element) in black. Each day, each cell has the same probability (1/20) of being replaced by a thymus migrant. The probability of replacing a gray cell will be 19 times higher than that of replacing the dark cell. (D) (Open circles) Exponential decay, calculated according to the formula X(t) = X0 (1 − a)t where Xt is absolute number of resident Tg cells as a function of time, X0 is absolute number of resident Tg cells at time 0, a is the ratio between the number of thymus migrants and the total number of resident T cells, and t is time in days. (Closed circles). Substitution of resident Tg cells by recent thymus migrants (experimental values). In B and D, the size of the T cell clones (y-axis) is shown on a linear scale.
Figure 5
Figure 5
Exponential decay of four T cell clones of different sizes, calculated according to the formula X(t) = X0 (1 − a)t. The clone size (y-axis) is shown on a linear scale (top) or a log scale (bottom). The life span of each clone (the number of days required for all members of the clone to disappear) was calculated as the time required for each decay curve to intercept the x-axis, i.e., to fall below one cell.

References

    1. Von Boehmer H. Developmental biology of T cells in T cell–receptor transgenic mice. Annu Rev Immunol. 1990;8:531–536. - PubMed
    1. Rocha B, Freitas AA, Coutinho AA. Population dynamics of T lymphocytes. Renewal rate and expansion in the peripheral lymphoid organs. J Immunol. 1983;131:2158–2164. - PubMed
    1. Stuttman O. Post-thymic T cell development. Immunol Rev. 1986;91:159–194. - PubMed
    1. Rocha B, Dautigny N, Pereira P. Peripheral T lymphocytes: expansion potential and homeostatic regulation of pool sizes and CD4/CD8 ratios in vivo. Eur J Immunol. 1989;19:905–911. - PubMed
    1. Rocha B, Von Boehmer H. Peripheral selection of the T cell repertoire. Science (Wash DC) 1991;251:1225–1228. - PubMed

Publication types

MeSH terms

Substances