. 1997 Oct 6;186(7):1159-63.
doi: 10.1084/jem.186.7.1159.

pH-dependent perforation of macrophage phagosomes by listeriolysin O from Listeria monocytogenes

Affiliations

pH-dependent perforation of macrophage phagosomes by listeriolysin O from Listeria monocytogenes

K E Beauregard et al. J Exp Med. .

Abstract

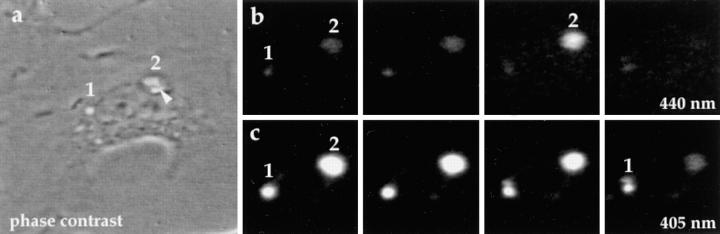
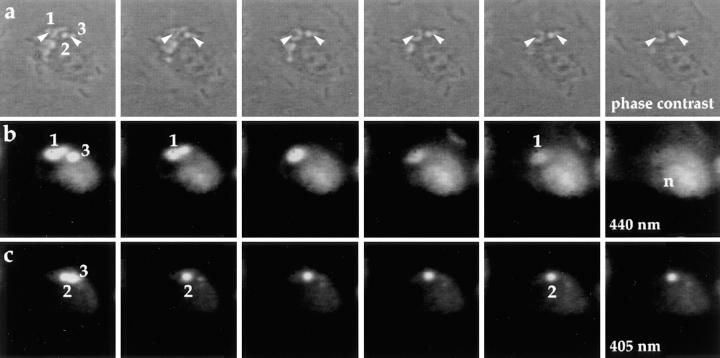
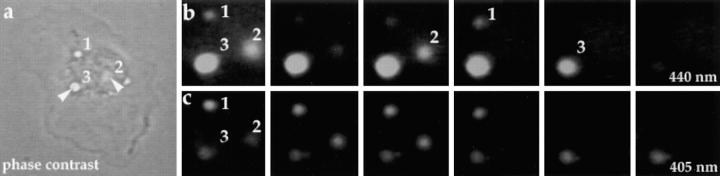
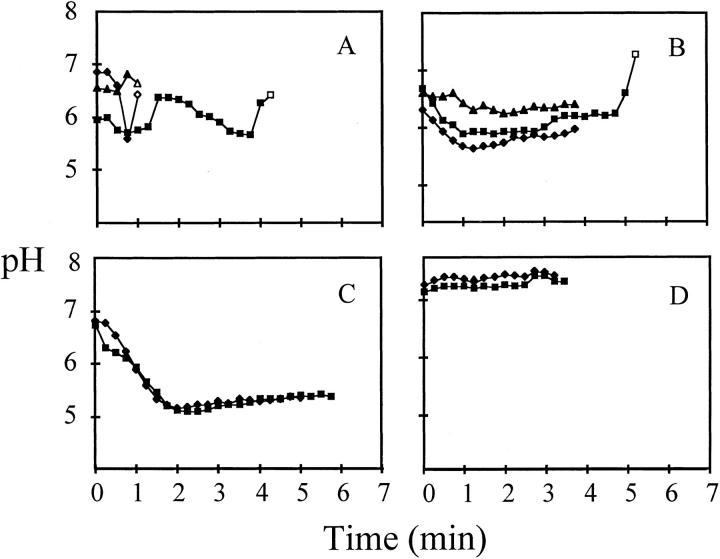
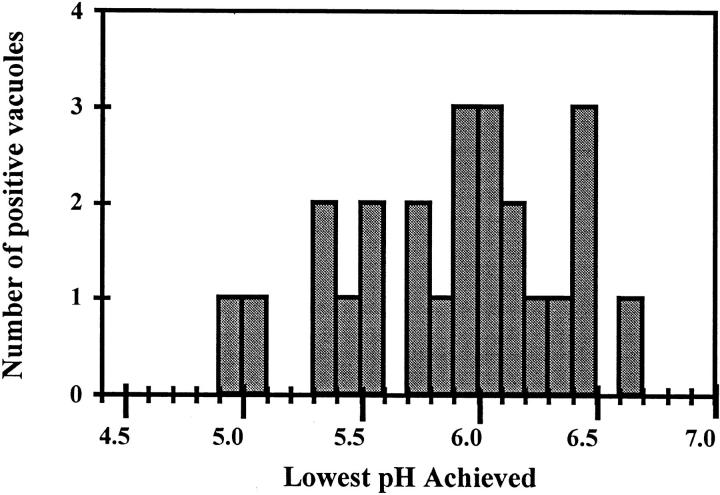
The pore-forming toxin listeriolysin O (LLO) is a major virulence factor implicated in escape of Listeria monocytogenes from phagocytic vacuoles. Here we describe the pH-dependence of vacuolar perforation by LLO, using the membrane-impermeant fluorophore 8-hydroxypyrene-1,3,6-trisulfonic acid (HPTS) to monitor the pH and integrity of vacuoles in mouse bone marrow-derived macrophages. Perforation was observed when acidic vacuoles containing wild-type L. monocytogenes displayed sudden increases in pH and release of HPTS into the cytosol. These changes were not seen with LLO-deficient mutants. Perforation occurred at acidic vacuolar pH (4.9-6.7) and was reduced in frequency or prevented completely when macrophages were treated with the lysosomotropic agents ammonium chloride or bafilomycin A1. We conclude that acidic pH facilitates LLO activity in vivo.


Figures

Figure 1
Figure 1
HPTS fluorescence indicates phagosomal pH and membrane integrity. The macrophage shown by phase contrast microscopy (a) contained two prominent phase-bright vesicles. Vesicle 1 was a macropinosome and vesicle 2 was a spacious phagosome containing three bacteria, visible as phase-dense rods. The fluorescence of HPTS contained in these vesicles is shown for exc. 440 nm (b) and 405 nm (c). The four frames in each series show images taken at 30-s intervals, with the left-most image corresponding to the phase contrast image. At low pH, the fluorescence of HPTS is greater at exc. 405 nm than at 440 nm; conversely, at neutral pH, fluorescence is greater at exc. 440 nm than at 405 nm. Hence, both vesicles appeared acidic in the early time points. Vesicle 1 remained acidic through the series, but vesicle 2 showed an abrupt increase in pH (b and c, third frame), followed by loss of dye (b and c, fourth frame).
Figure 2
Figure 2
HPTS from perforated phagosomes diffuses into the cytoplasm and nucleus. The time series shows phase contrast micrographs (a), the corresponding HPTS fluorescence excited at 440 nm (b), and 405 nm (c). Frames in each row were separated by 45-s intervals. Phase-bright phagosomes (a–c, vesicles 1 and 3) and macropinosomes (a–c, vesicle 2) contained HPTS. Initially, vesicle 1 showed bright fluorescence at exc. 440 nm, but very little fluorescence at exc. 405 nm; thus, it was relatively high pH. Its exc. 440 nm fluorescence decreased as dye entered the cytoplasm. Vesicle 2 was fluorescent at exc. 405 nm, but not detectable at 440 nm, indicating an acidic compartmental pH. It remained intact and at low pH through the time series. Vesicle 3 was initially fluorescent at both excitation wavelengths, but lost all fluorescence in the interval between the first and second frames. Accumulation of dye in the cytoplasm and nucleus (n) was indicated by the increased fluorescence at exc. 440 nm distributed diffusely throughout the cell.
Figure 3
Figure 3
LLO perforates phagosomes and macropinosomes as they acidify. Three phase-bright vesicles in a macrophage (a) were labeled with HPTS. Fluorescence images at 90-s intervals are shown as a time series in b (440 nm) and c (405 nm). Vesicle 1 was a macropinosome that acidified through the first three frames, then abruptly increased its pH (b and c, frame 4) before losing the dye (b and c, frame 5). Vesicle 2 contained L. monocytogenes; it was initially at a relatively high pH (b and c, frame 1). It then acidified (b and c, frame 2), became abruptly alkaline again (b and c, frame 3), and lost its dye (b and c, frame 4). Vesicle 3, another phagosome, was initially at high pH and remained so until it lost most of its dye.
Figure 4
Figure 4
pH analysis of L. monocytogenes–containing vacuoles. Quantitative fluorescence microscopy was used to determine the fluorescence intensities of vacuoles containing HPTS after infection with L. monocytogenes. A standard curve of pH to 440:405 nm intensity ratios was used to calibrate the pH of the fluorescence intensities. These graphs are representative time courses from several experiments. Open symbols represent a sudden loss of fluorescence from the vacuole and, therefore, the end of the experiment. Traces that end in closed symbols are those that did not show a sudden loss of fluorescence. These experiments were continued until the fluorescence signal was lost through quenching and recycling of the HPTS. (A) Phagosomes containing wild-type L. monocytogenes. Vacuoles showed sudden increases in pH followed by a decrease in the fluorescence signal as the HPTS was released to the cytoplasm. In some cases, phagosomes reacidified and showed a secondary pH increase (squares). (B) Control vacuoles in cells infected with wild-type L. monocytogenes. These vacuoles acidified and occasionally showed evidence of perforation (squares). (C) Cells were infected with DP-L2161 (diamond, phagosome; square, control vacuole). This L. monocytogenes mutant lacks LLO because of an hly deletion. (D) Cells were infected with wild-type L. monocytogenes in the presence of 0.5 μM bafilomycin A1.
Figure 5
Figure 5
Wild-type L. monocytogenes perforates vacuoles at a mean pH of 5.94. To determine whether there was a pH requirement for vacuole perforation, the lowest pH achieved by a vacuole just before the primary pH increase was recorded. The number of vacuoles that showed perforation at each pH is graphed here. The frequency of perforation increases at approximately pH 6.0.

References

    1. Tilney LG, Portnoy DA. Actin filaments and the growth, movement, and spread of the intracellular bacterial parasite, Listeria monocytogenes. . J Cell Biol. 1989;109:1597–1608. - PMC - PubMed
    1. Portnoy DA, Jones S. The cell biology of Listeria monocytogenes(escape from a vacuole) Ann NY Acad Sci. 1994;730:15–25. - PubMed
    1. Armstrong BA, Sword CP. Electron microscopy of Listeria monocytogenes–infected mouse spleen. J Bacteriol. 1966;91:1346–1355. - PMC - PubMed
    1. Camilli A, Tilney LG, Portnoy DA. Dual roles of plcA in Listeria monocytogenespathogenesis. Mol Microbiol. 1993;8:143–157. - PMC - PubMed
    1. Portnoy, D.A., A.N. Sun, and J. Bielecki. 1992. Escape from the phagosome and cell-to-cell spread of Listeria monocytogenes. In Microbial Adhesion and Invasion. M. Hook and L. Switalksi, editors. Springer Verlag, New York. 85–94.

Publication types