. 1997 Oct 15;17(20):7763-83.
doi: 10.1523/JNEUROSCI.17-20-07763.1997.

Regulation of neuroblast cell-cycle kinetics plays a crucial role in the generation of unique features of neocortical areas

Affiliations

Regulation of neuroblast cell-cycle kinetics plays a crucial role in the generation of unique features of neocortical areas

F Polleux et al. J Neurosci. .

Abstract

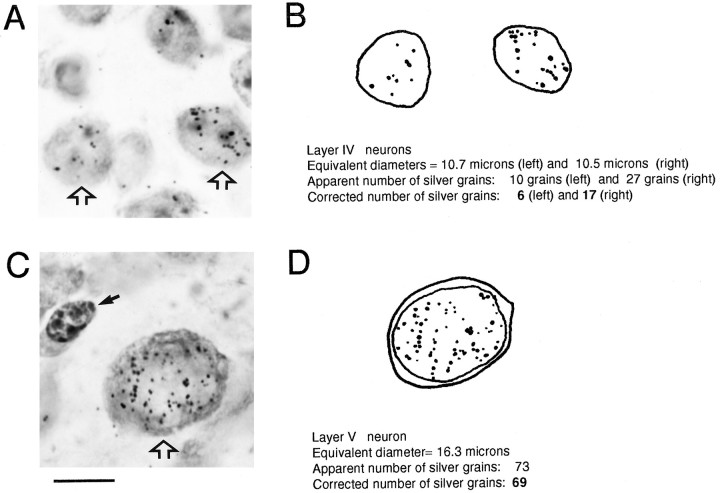
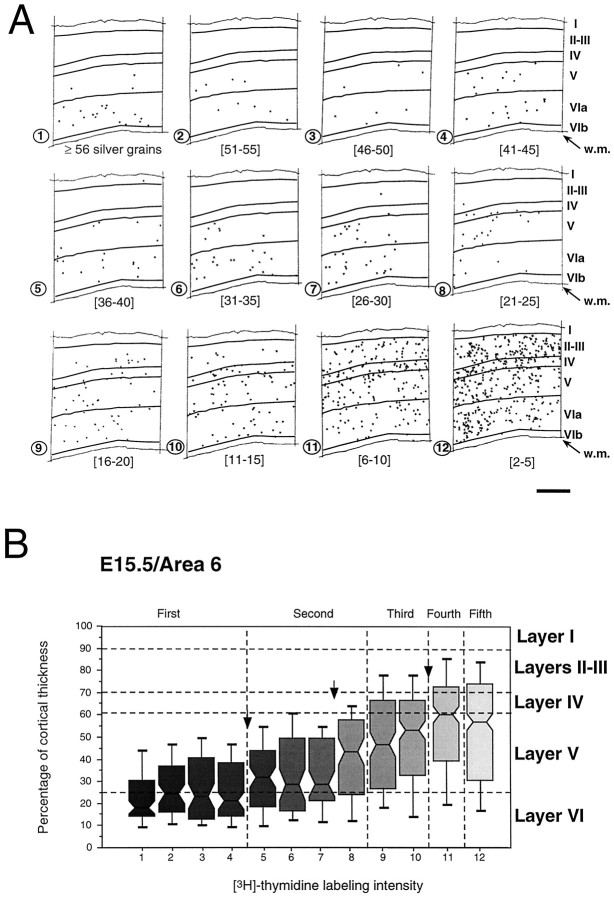
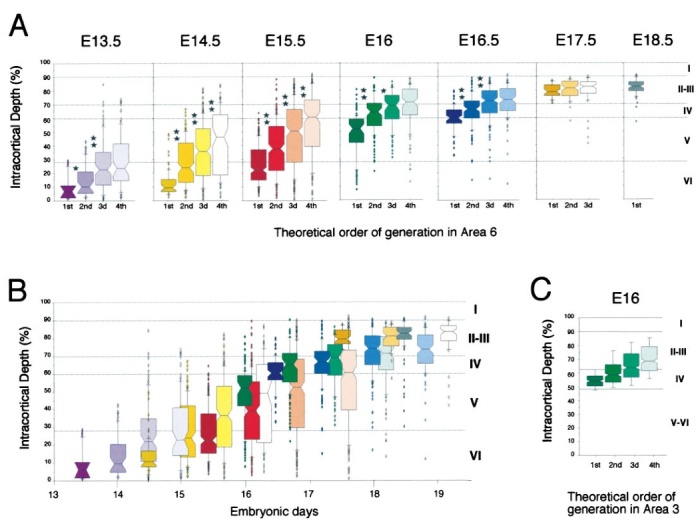
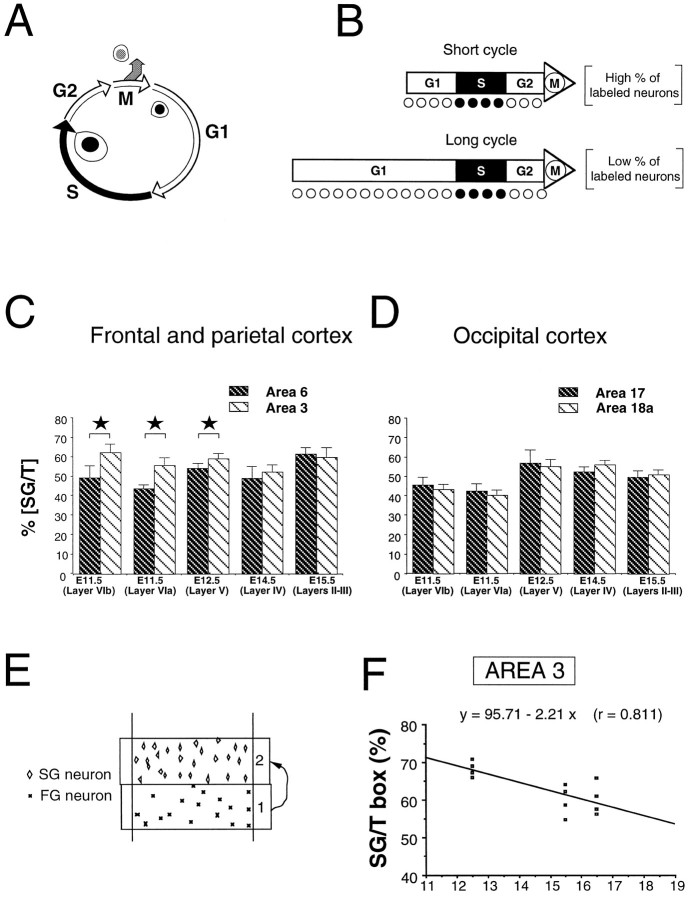
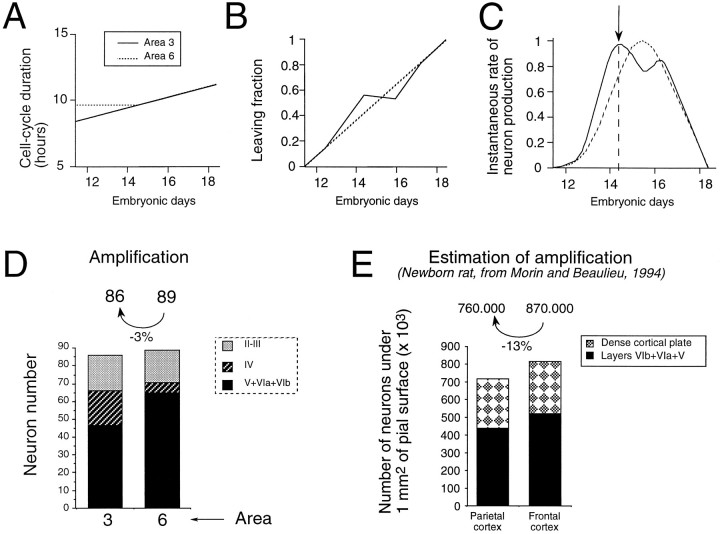
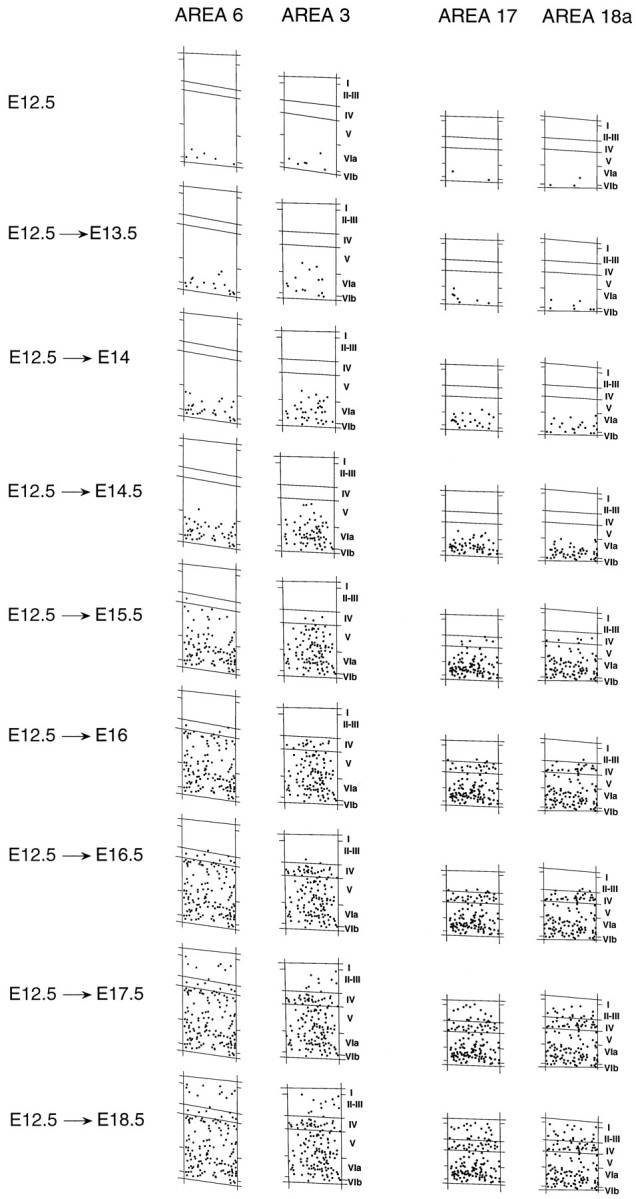
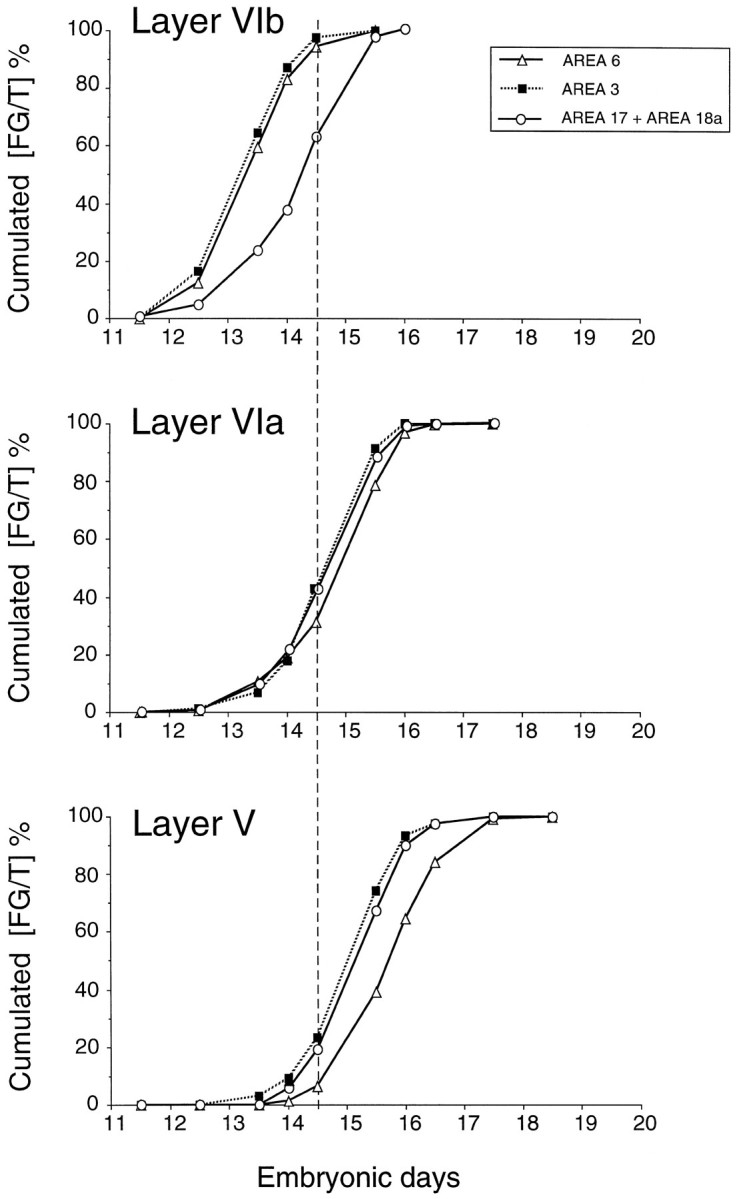
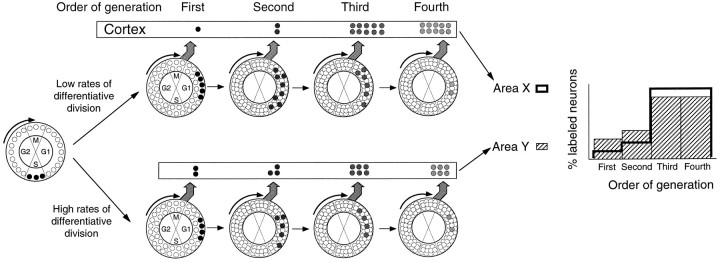
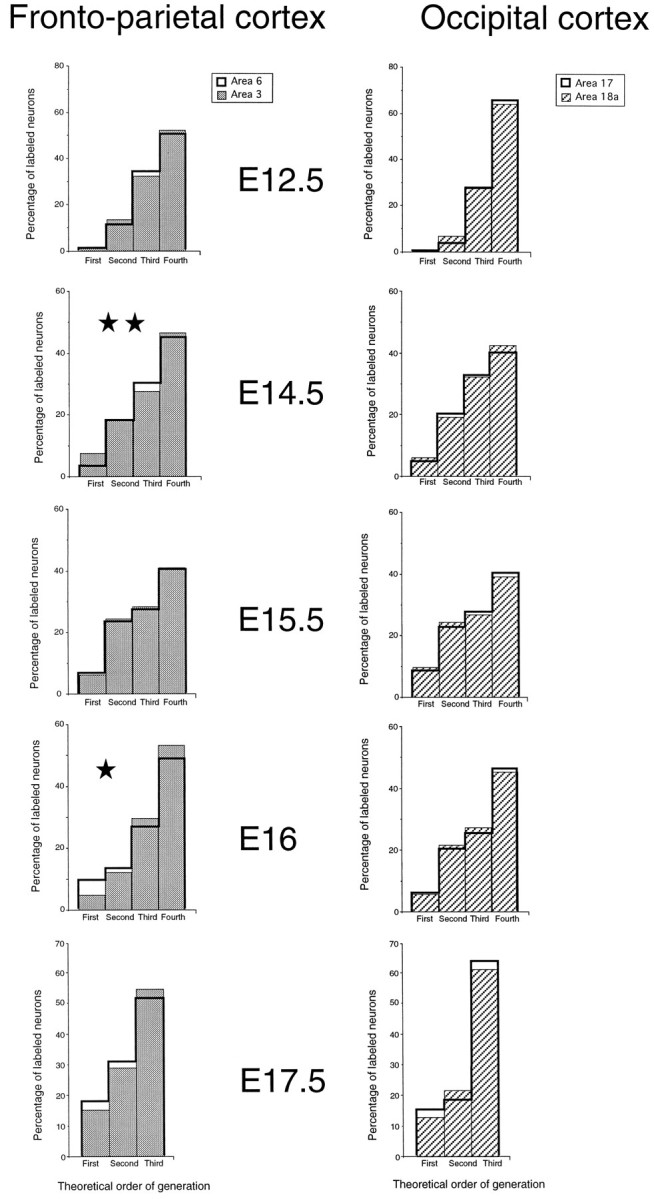
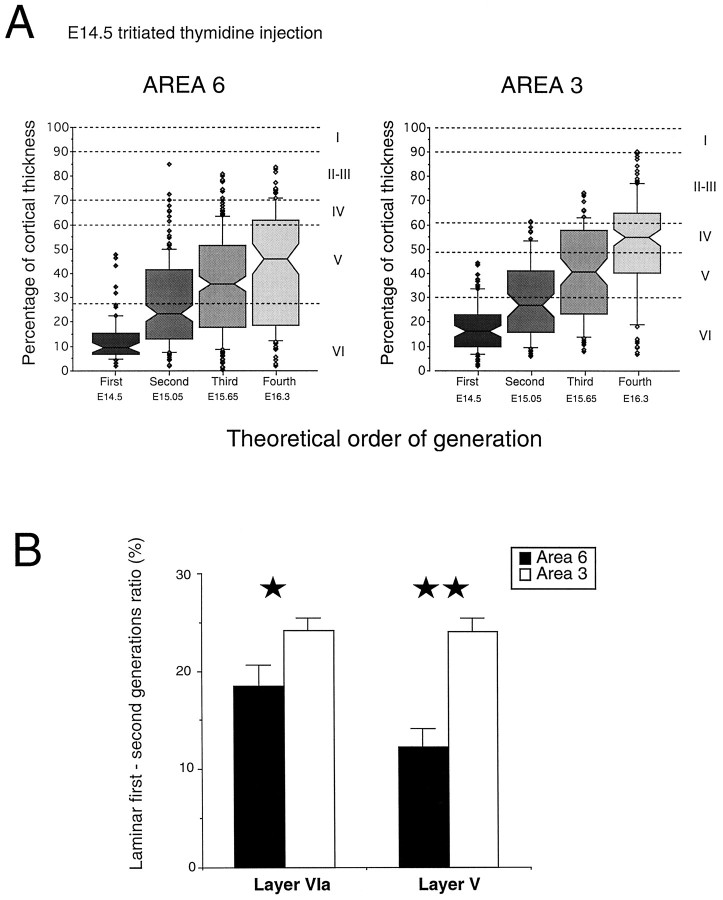
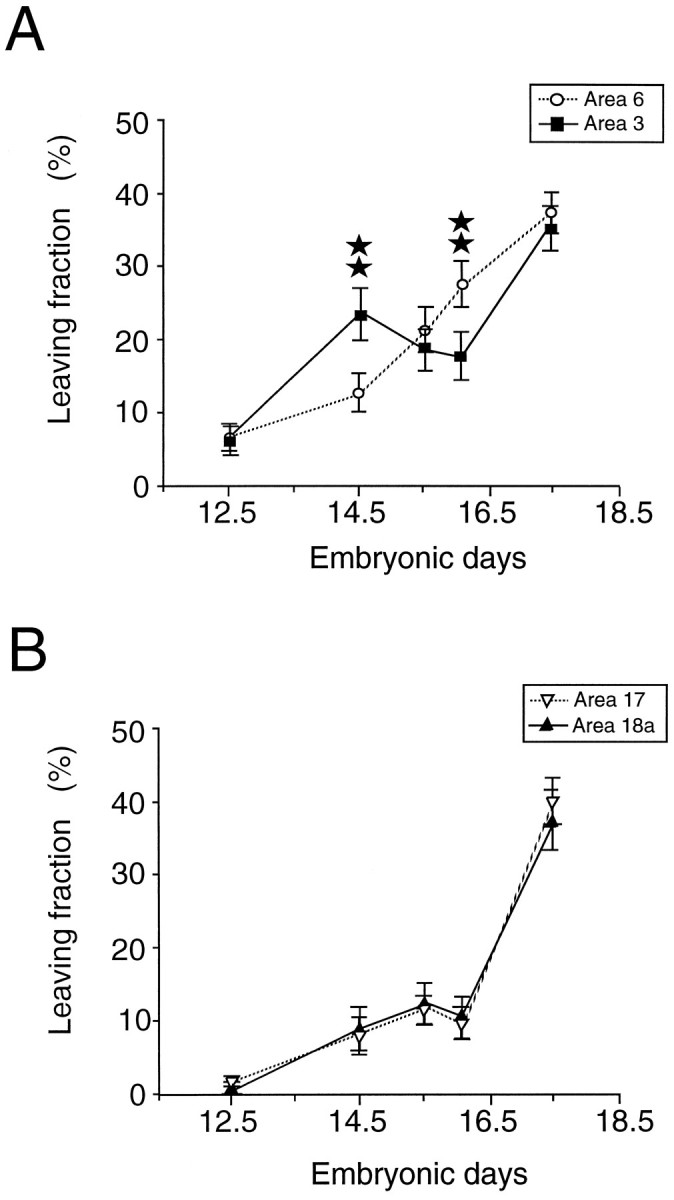
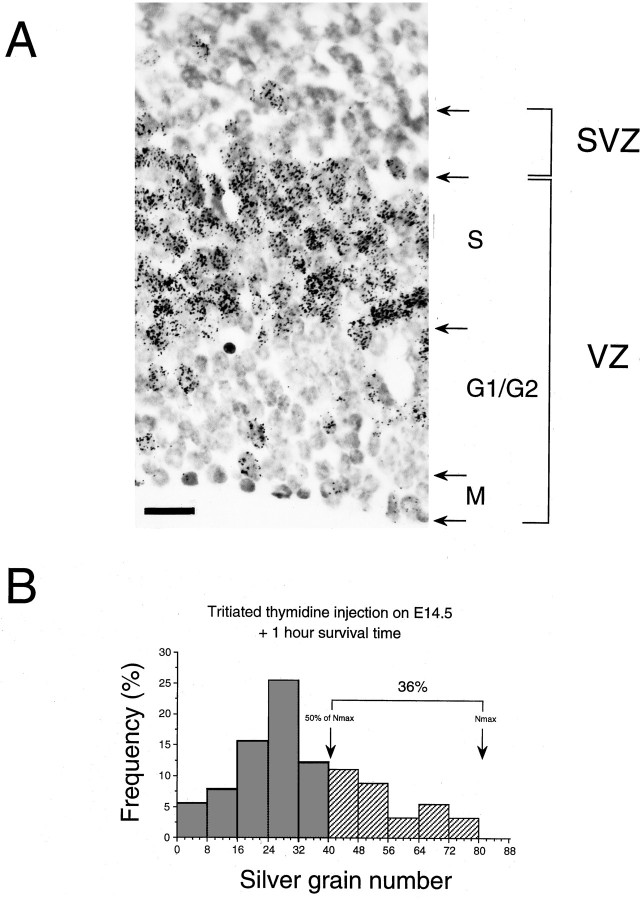
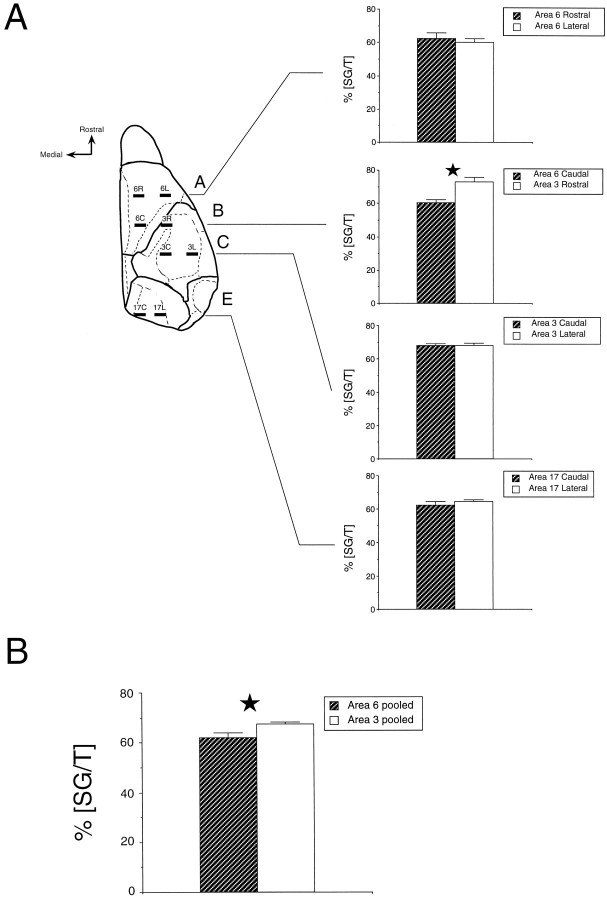
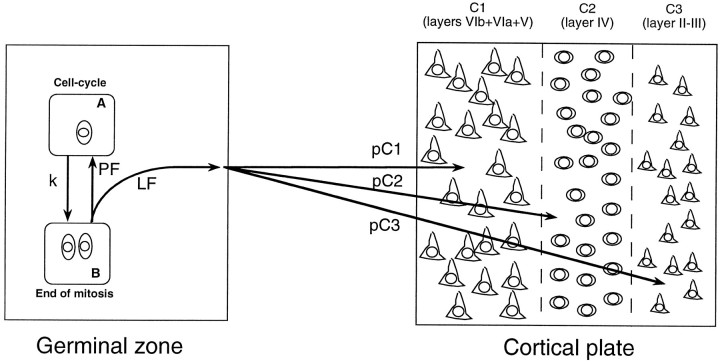
Cortical neurons are generated in the germinal zones lining the ventricles before migrating predominantly radially. To investigate regional differences in the cell-cycle kinetics of neuroblasts, pulse [3H]-thymidine injections were made throughout corticogenesis, and labeled neuron counts were compared in areas 3, 6, 17, and 18a in the adult mouse. The relationship between height in the cortex and intensity of autoradiographic signal distinguishes first generation and subsequent generations of neurons. This provides the mitotic history of defined sets of neurons and is a powerful tool for analyzing areal differences in cell-cycle kinetics. The infragranular laminar labeling indices of different generations show significant differences in areas 3 and 6. The labeling index of first generation neurons shows that the rate of neuron production is higher in area 3 than in area 6. This increased generation rate in area 3 was accompanied by two major changes. First, computation of the labeling index of the subsequent generation neurons (which reflects percentages of precursors in S-phase at the moment of the pulse) indicates a shorter cell cycle in area 3. Second, the total population of labeled neurons contains a higher proportion of first generation neurons in area 3, implying a higher leaving fraction in this area. Computer simulations of these areal differences of cell-cycle kinetics generate neuron numbers that are in close agreement with published data. Altogether these findings reveal an early regionalization of the ventricular zone that serves to generate unique features of future cortical areas.


Figures

Fig. 1.
Fig. 1.
Autoradiographic signal on neurons in parietal area 3 in layer IV (A, B) and layer V (C, D) after injection on E14.5. A–C, High-power photomicrographs of labeled neurons showing different autoradiographic intensities. B–D, Outlines of the cell body and nuclear profiles showing individual silver grains detected by visual inspection at different focal depths. Note the low level of autoradiographic background. Small solid arrow in C: glial cell; open arrows: neurons of interest. Scale bar, 10 μm.
Fig. 2.
Fig. 2.
Influence of intensity of neuron labeling in area 6 on radial location after an injection of [3H]-thymidine at E15.5. A, Each panel shows the radial distribution of a category of labeled neurons defined by the numbers of silver grains per nucleus. B, Box plots of intracortical depth of different categories of labeled neurons. Each numbered group corresponds to a panel inA. This analysis has been performed on 1377 labeled neurons in six nonadjacent sections taken from two different mice from the same litter. For each box plot the top andbottom thick lines indicate, respectively, the 90th and the 10th centiles. Horizontal lines composing each box represent the 75th (bottom), 50th (median), and 25th (top) centiles. Scale bar, 300 μm. Arrows indicate statistically significant (p < 0.05) thresholds revealed by a Kolmogorov–Smirnov nonparametric test of adjacent distributions.Vertical dashed line: 50%, 25%, 12.5%, and 6.25% of maximum labeling.
Fig. 3.
Fig. 3.
Radial location of separate generations after a single [3H]-thymidine pulse injection.A, Laminar location of the first four generations of neurons in area 6. Dots overlying each histogram indicate the radial position of individual neurons that form the 10% tails of each distribution. Stars indicate the statistical significance of the comparisons of adjacent distributions (Kolmogorov–Smirnov nonparametric test: *p < 0.05; **p < 0.01). B, Published cell-cycle duration indicates theoretical birthdate of each generation shown in A and is used to rank individual generations in chronological order. C, Radial deployment of successive generations in area 3 after injection of [3H]-thymidine on E16.
Fig. 6.
Fig. 6.
Changes in the labeling index and duration of the cell cycle. A, Different phases of the cell cycle.B, Incidence of changes in the length of the cell cycle on labeling index. S-phase has been shown to remain fairly constant throughout cortical neurogenesis so that an S-phase marker will label a high proportion of precursor cells when the cell cycle is short and a low percentage when it is high. C, Labeling index (SG/T) in the cortical layer immediately above FG neurons in areas 3 and 6.D, Labeling index (SG/T) in cortical layer immediately above FG neurons in areas 17 and 18a. E, SG/T in a restricted zone immediately above the FG neurons. F, SG/T values obtained in area 3 at E12.5, E15.5, and E16.5 using the approach illustrated in E. Individual points indicate values obtained on four nonadjacent sections taken from two animals at each age of injection. At E15.5 and E16.5, there is a significant decrease in SG/T compared with E12.5 in area 3 as shown by the negative slope of the regression line. This is compatible with the developmental decrease of labeling indices found at these stages in the ventricular zone (see text). Statistical analysis: *p < 0.05, according to a χ2 analysis.
Fig. 13.
Fig. 13.
Simulations of the consequences of (1) cell-cycle parameters Tc and LF and (2) timetable of layer production on the dynamics of neuron production in areas 6 and 3. Changes during development in areas 3 and 6 of (A) Tc, (B) LF, and (C) dynamics of neuron production (i.e., the instantaneous rate of neuron production generated by the parameters in A and B). D, The timetable of laminar production in areas 3 and 6 (see ) and the dynamics of neuron production generate (1) the amplification (number above each histogram), i.e., the number of neurons in each area produced by one initial precursor, and (2) within each area the proportion of neurons in each layer. This simulation shows that although amplification in both areas is comparable, the proportion of neurons allocated to each layer is very different in the two areas. E, Number of neurons under 1 mm2 of pial surface in frontal and parietal cortex of the newborn rat (Morin and Beaulieu, 1994). The simulated values show a relatively good fit with the published experimental values (see text).
Fig. 4.
Fig. 4.
Distribution of FG neurons in frontoparietal and occipital cortex after injections on embryonic dates spanning the entire mouse corticogenesis. Each panel represents the FG neurons on one section after injection on the embryonic day indicated, plus the FG neurons from preceding injections.
Fig. 5.
Fig. 5.
Cumulative laminar generation curves (FG/T). Thevertical dotted line indicates age limit (E14.5) before which FG neurons are limited to infragranular layers and where differences between generation curves reflect areal differences in the rate of neuron production (see text). At E14.5, the cumulative FG/T ratios in both layers VIa and V are significantly different in areas 3 and 6 (χ2 analysis; Table 1).
Fig. 7.
Fig. 7.
Influence of the exit behavior of precursors cells on proportions of successive generations (generation profiles). After differentiative divisions one or both daughter cells quit the cell cycle and lead to high proportions of heavily labeled FG neurons (bottom pathway). After proliferative divisions, daughter cells remain in the cell cycle, and this leads to low numbers of FG neurons. During early stages of corticogenesis, when the proliferative pool is increasing, the percentage of differentiative divisions is low (top pathway). At later stages, high rates of differentiative divisions (bottom pathway) lead to a steady decline in the precursor pool. Ventricular regions characterized by high rates of differentiative division (i.e., high LF) lead to large numbers of heavily labeled FG neurons immediately after the pulse and low numbers of SG neurons. Thus, differences in the ratio between FG and SG neurons reflect the differences in the rate of differentiative divisions.
Fig. 8.
Fig. 8.
Generation profiles for areas 3 and 6 (left) and 17 and 18a (right). Statistical analysis: *p < 0.05; **p < 0.01, according to a χ2analysis.
Fig. 9.
Fig. 9.
A, Box plot analysis of the radial deployment of successive generations in areas 3 and 6 after injection of [3H]-thymidine on E14.5 (area 3: 599 neurons obtained in three sections in two animals; area 6: 776 neurons, four sections, two animals). B, Ratio of the number of FG and second generation neurons within layer VIa and layer V in areas 6 and 3. Conventions as in Figure 2.
Fig. 10.
Fig. 10.
Comparison of LF characterizing neurogenesis of areas 3 and 6 (A) and of areas 17 and 18a (B). The LF has been estimated by the proportion of silver grains contained in the FG neurons expressed as a percentage of the number of silver grains contained in all labeled neurons.Stars refer to statistically significant differences (p < 0.05), according to a χ2 analysis.
Fig. 11.
Fig. 11.
[3H]-thymidine labeling in the ventricular zone of presumptive somatosensory motor cortex after injection at E14.5 with a survival time of 1 hr. A, Microphotograph of labeling in the S-phase zone. B, Grain distribution in labeled precursors (300 labeled precursors from three nonadjacent sections). G1/G2, G1/G2 zone of the ventricular zone (VZ); M, M-phase zone;S, S-phase zone; SVZ, subventricular zone. Scale bar, 30 μm.
Fig. 12.
Fig. 12.
Comparison of laminar labeling index (SG/T) within and between areas. SG/T was measured in layer VIa after a pulse at E12.5. A, Percentages were measured with constant lateromedial separations at four rostrocaudal positions. Measurements at rostrocaudal positions within areas failed to show significant differences, whereas there was a significant 13% difference between areas 3 and 6. B, Differences between areas 3 and 6 remain significant after pooling the values from all three locations within each area. Statistical analysis: *p < 0.05, according to a χ2 analysis.
Fig. 14.
Fig. 14.
Schematic view of the compartments used in our model of cortical neurogenesis. In the germinal zone (left) compartment A represents the pool of precursors progressing through the cell cycle. CompartmentB represents precursors at the end of mitosis when they either have to leave the cell cycle and become postmitotic (LF) or remain in the cell cycle and return to compartment B (PF). Transition from compartment A to B is proportional to the probability for a precursor to undergo mitosis per unit of time and thus is inversely proportional to the duration of cell cycle (Tc) (see ). Postmitotic neurons leaving the ventricular zone end their migration in the cortical plate in one of three different laminar compartments (C1, C2, or C3) according to probabilities (pC1, pC2, orpC3) that have been determined previously (Table 2) (Polleux et al., 1997).

References

    1. Acklin SE, van der Kooy D. Clonal heterogeneity in the germinal zone of the developing rat telencephalon. Development. 1993;118:175–192. - PubMed
    1. Angevine JB, Sidman RL. Autoradiographic study of cell migration during histogenesis of cerebral cortex in the mouse. Nature. 1961;192:766–768. - PubMed
    1. Appleton TC, Pelc SR, Tarbit MH. Formation and loss of DNA in intestinal epithelium. J Cell Sci. 1969;5:45–55. - PubMed
    1. Bayer SA, Altman J. Neocortical development. Raven; New York: 1991.
    1. Beaulieu C. Numerical data on neocortical neurons in adult rat, with special reference to the GABA population. Brain Res. 1993;609:284–292. - PubMed

Publication types

LinkOut - more resources