. 1997 Oct 15;17(20):7954-66.
doi: 10.1523/JNEUROSCI.17-20-07954.1997.

Correspondence noise and signal pooling in the detection of coherent visual motion

Affiliations

Correspondence noise and signal pooling in the detection of coherent visual motion

H Barlow et al. J Neurosci. .

Abstract

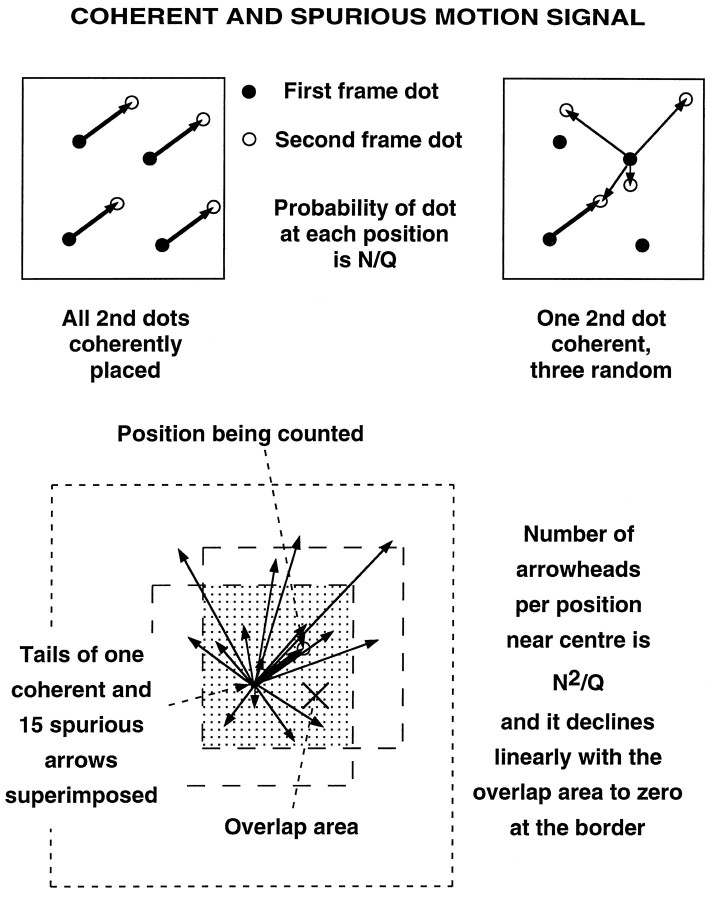
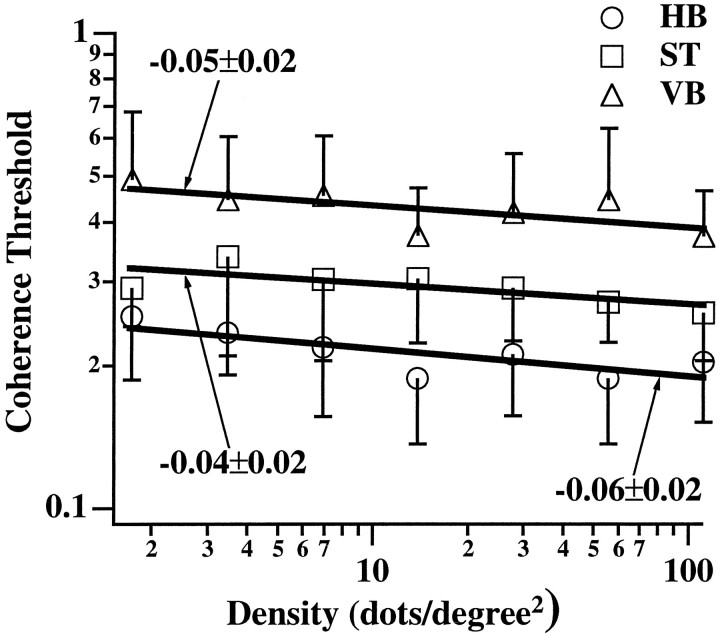
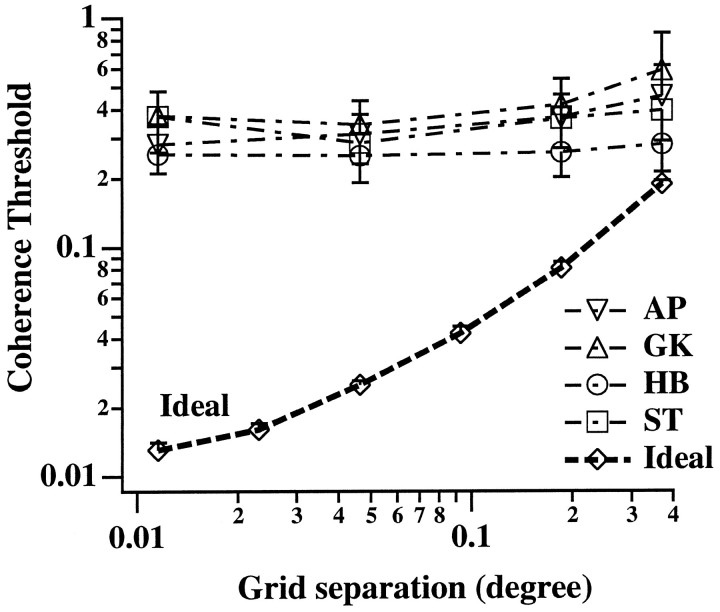
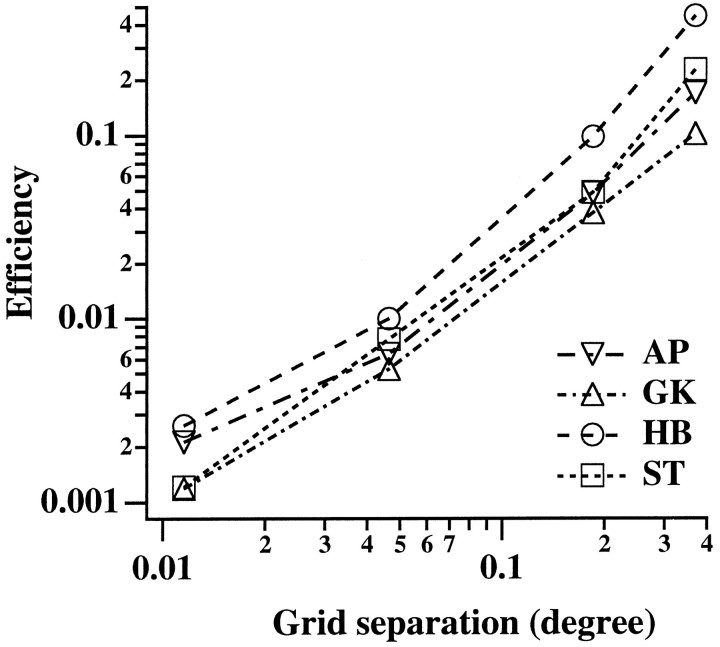
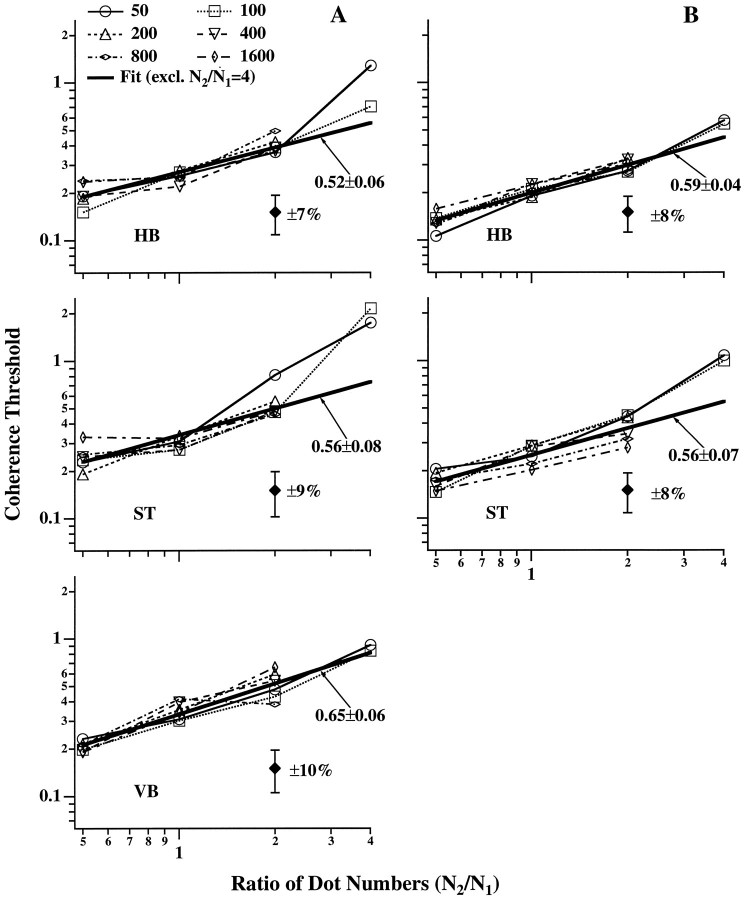
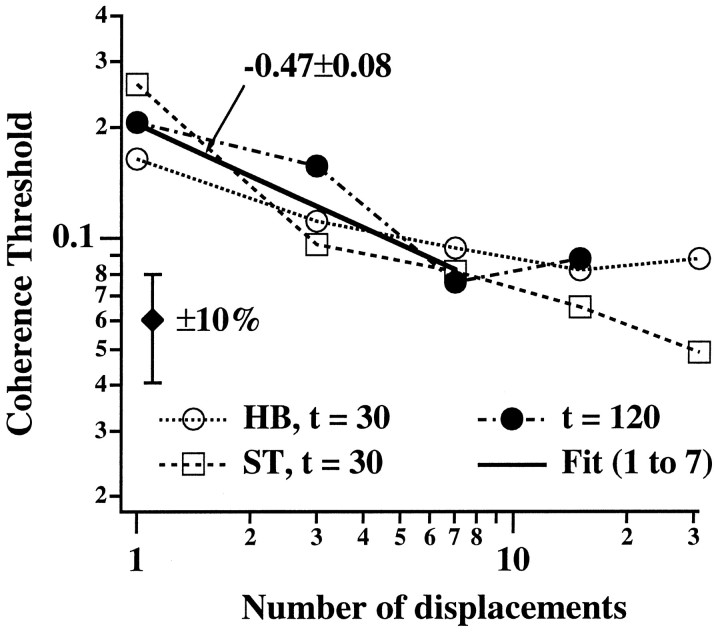
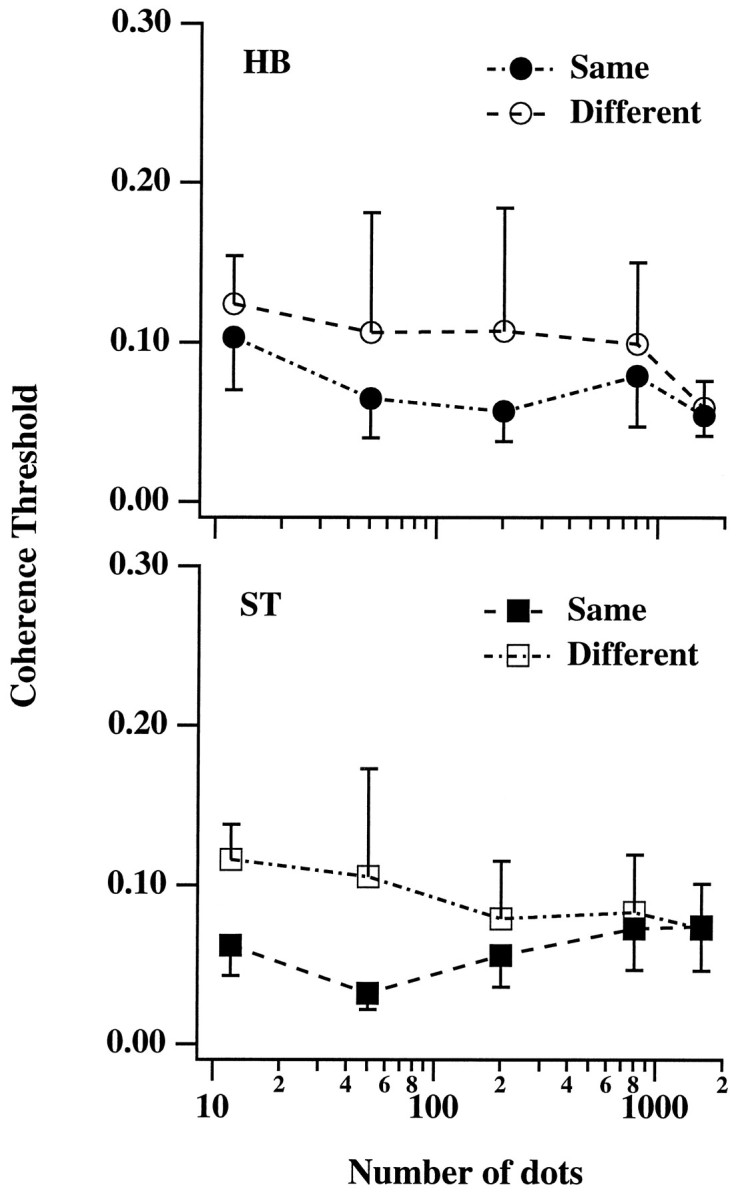
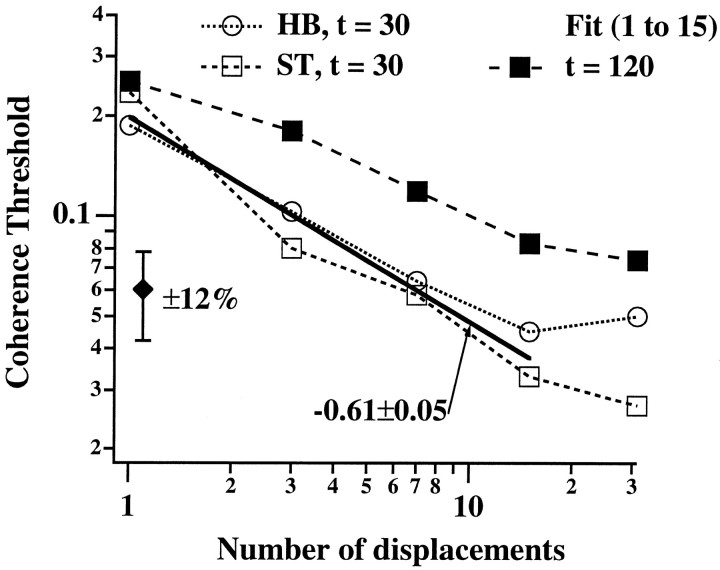
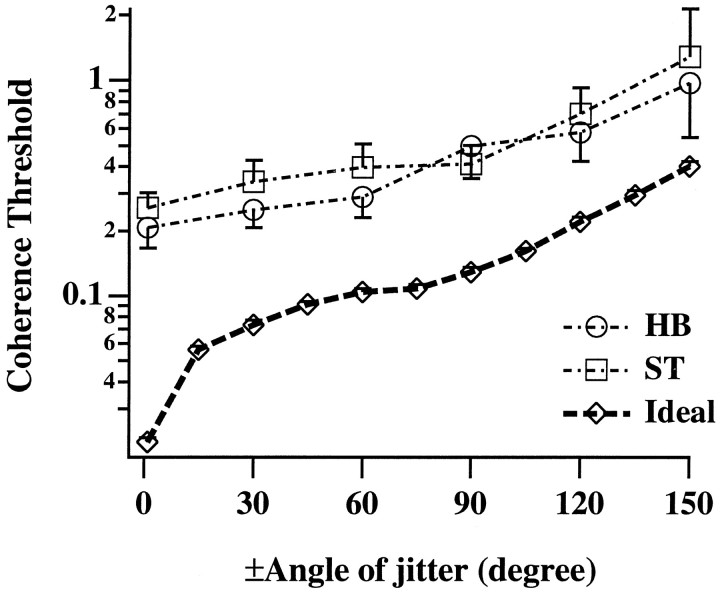
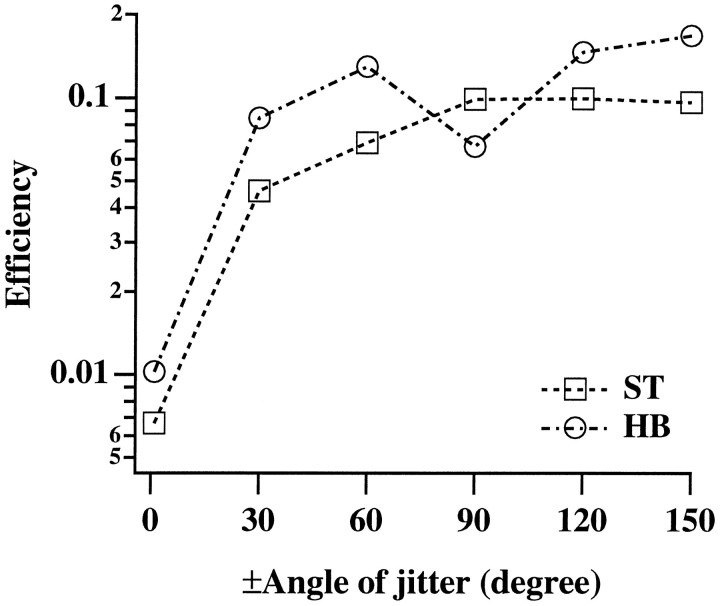
In the random dot kinematograms used to analyze the detection of coherent motion in the middle temporal visual area (MT) and in psychophysical experiments the exact way that dots are paired between successive presentations is not known by the observer. We show how to calculate the limit to coherence threshold caused by this uncertainty, which we call "correspondence noise." We compare ideal thresholds limited only by this noise with those of human observers when dot density, ratio of dot numbers in two fields, area of stimulus, number of fields, and method of generation of the coherent dots are varied. The observed thresholds vary in the same way as the ideal thresholds over wide ranges, but they are much higher. We think this difference is because the ideal detector takes advantage of the high precision with which dots are placed in the kinematograms, whereas the neural motion system can only operate with low precision. When kinematograms are generated with decreased precision of dot placement, the ideal detector no longer has this advantage, and the gap between ideal and actual performance is greatly reduced. Because the signals that result from objects moving in the real world are scattered over broad ranges of direction and velocity, high precision is not needed, and it is advantageous for the motion system to pool information over broad ranges. Other mismatches between kinematograms and the neural motion system, and internal noise, may also elevate human thresholds relative to the ideal detector. The importance of external noise suggests that the neurons of MT form a vast array of optimal filters, each matched to a different combination of parameters in the multidimensional space required to define motion in patches of the visual field.


Figures

Fig. 1.
Fig. 1.
Correspondence noise. Spurious motion signals are generated when a dot in the first frame (filled circle) is incorrectly paired with a dot in the second frame (open circles), as shown at top right. For N dots in each frame thereN2 possible pairings, of whichCN are formed by coherent displacements andN2CN are spurious.Bottom, How the noise from spurious signals is calculated. The tails of all possible motionarrows are aligned, and the number ofarrowheads is counted at the position corresponding to the motion that is to be detected. With N dots andQ possible positions, assuming a small movement and low coherence, the expected number of arrowheads at each position is nearlyN2/Q; for larger movements, this figure decreases linearly to the edge of the overlap area. Assuming Poisson statistics, the noise is the square root of the expected number, approximately (N2/Q)1/2.
Fig. 2.
Fig. 2.
Effect of dot density. Coherence thresholds are plotted against dot density using logarithmic axes. Also shown are estimated SEs and regression lines with their slopes. In these three observers (HB, ST, VB), increasing the dot density 64-fold decreases the thresholds by 22, 15, and 19%.
Fig. 4.
Fig. 4.
Effect of aperture area. Coherence thresholds are plotted against stimulus area for two observers (HB, ST) using logarithmic axes. The area of the stimulus was corrected for the border effect using the geometric principle illustrated in Figure 1. The line has a slope of −0.5, the value predicted from the correspondence noise limit. Deviations from this prediction are evident at <3 deg2 and >12 deg2.
Fig. 8.
Fig. 8.
Effect of quantization on coherence thresholds. The coherence thresholds when dots are confined to lattice points with varying grid separations are shown for four observers (AP, GK, HB, ST) on logarithmic axes. Also shown are thresholds for an ideal detector. As expected, coarse quantization impairs ideal performance greatly. It has little effect on human coherence thresholds, presumably because the neural motion system is insensitive to precise dot positioning.
Fig. 9.
Fig. 9.
Effect of quantization on efficiency. Using log axes the estimated statistical efficiency is plotted as a function of grid separation for four observers (AP, GK, HB, ST). Efficiency rises when kinematograms are generated in a way that matches the coarse resolution of the motion-detecting system, so that the ideal observer cannot gain an advantage from its greater precision.
Fig. 3.
Fig. 3.
Effect of ratioN2/N1. Coherence thresholds are plotted against the ratio of number of dots in the second frame to number of dots in the first frame using logarithmic axes. Thresholds are shown for six different first frame dot numbers for a displacement of 11 arc-min and three observers (A), and a displacement of 5.5 arc-min and two observers (B). The prediction from the correspondence noise limit is a line of slope 0.5. The thick lines are regressions excluding (excl.) the data for 4:1 ratio, in which the task was made difficult by the second frame being much brighter than the first.
Fig. 5.
Fig. 5.
Effect of multiple fields for different-generated kinematograms. Using logarithmic axes, coherence thresholds are plotted against the number of displacements for two observers at a field duration of 30 msec (frames repeated twice) and for one observer at a field duration of 120 msec (frames repeated 8 times). The correspondence noise limit predicts a slope of 0.5. The thick line with a slope of −0.47 ± 0.08 is the best fit to the data up to 7 displacements (8 fields).
Fig. 6.
Fig. 6.
Effect of dot density with multiple fields. Coherence thresholds are plotted against dot density for two observers for same-generated kinematograms of 5 fields. Results with different-generated kinematograms are included as a control. The thresholds do not rise with the dot density raised to the power of 1.5, as predicted by the correspondence noise limit under the assumption that advantage is taken of the same dots being moved coherently in the same condition (see Eq. 23).
Fig. 7.
Fig. 7.
Effect of multiple fields for same-generated kinematograms. Coherence thresholds are plotted against the number of displacements for two observers (HB, ST) at a field duration of 30 msec and one observer at a field duration of 120 msec. There is no evidence for the threshold dropping exponentially with the number of displacements, as it would if there were a mechanism taking advantage of the same dots being moved from field to field, and if correspondence noise were limiting (see Eq. 23). The thick line shows the best fit to the 30 msec field duration data for up to 15 displacements.
Fig. 10.
Fig. 10.
Effect of randomization on coherence thresholds. The positions of the coherently moved dots were randomized to varying extents. The dots were displaced to random positions within a sector of radius 8 ± 7.5 arc-min and ± angle as shown on theabscissa. The corresponding coherence thresholds of two observers (HB, ST) are shown on log-linear axes. As expected, if the neural motion system is insensitive to precise dot positioning, coarse randomization impairs ideal performance to a greater extent than it impairs human coherence thresholds.
Fig. 11.
Fig. 11.
Effect of randomization on efficiency. The coherently moved dots were displaced to random positions within a sector of radius 8 ± 7.5 arc-min and ± angle as shown on the abscissa. The corresponding statistical efficiencies of two observers (ST, HB) are shown on log-linear axes. As with quantization, randomization increases efficiency by matching the way kinematograms are generated to the coarse resolution of the motion-detecting system, so that the ideal observer cannot gain an advantage from its greater precision.

Similar articles

Cited by

References

    1. Adelsen EA, Bergen JR. Spatio-temporal energy models for the perception of motion. J Opt Soc Am A. 1985;2:284–299. - PubMed
    1. Albright TD. Direction and orientation selectivity of neurons in visual area MT of the macaque. J Neurophysiol. 1984;52:1106–1130. - PubMed
    1. Attneave F. Apparent movement and the what–where connection. Psychologia. 1974;17:108–120.
    1. Baker CL, Braddick OJ. The basis of area and dot number effects in random dot motion perception. Vision Res. 1982;22:1253–1259. - PubMed
    1. Barlow HB, Reeves HB. The versatility and absolute efficiency of detecting mirror symmetry in random dot displays. Vision Res. 1979;19:783–793. - PubMed

Publication types

LinkOut - more resources