. 1997 Oct 14;94(21):11456-60.
doi: 10.1073/pnas.94.21.11456.

Functional association between promoter structure and transcript alternative splicing

Affiliations

Functional association between promoter structure and transcript alternative splicing

P Cramer et al. Proc Natl Acad Sci U S A. .

Abstract

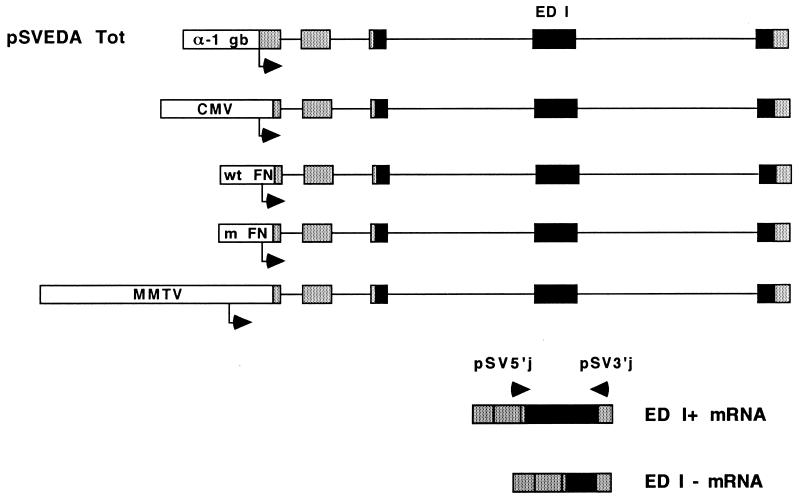
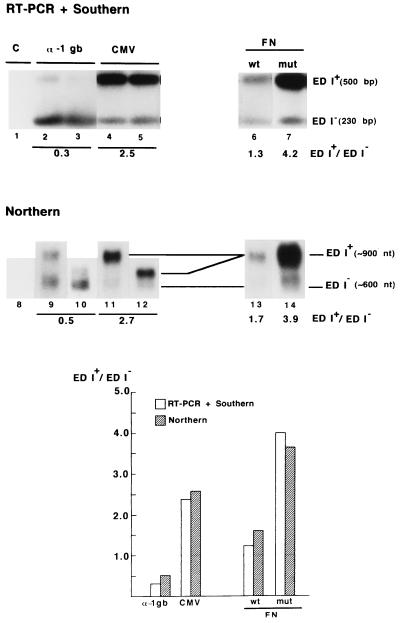
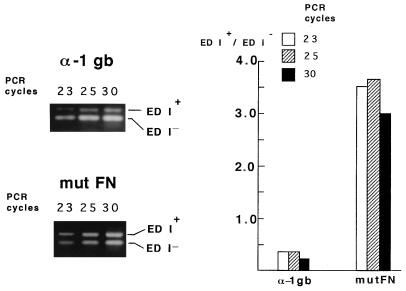
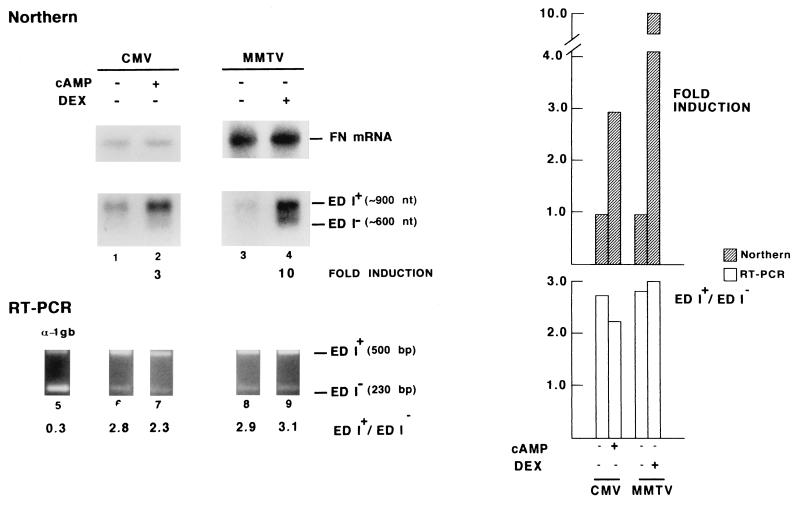
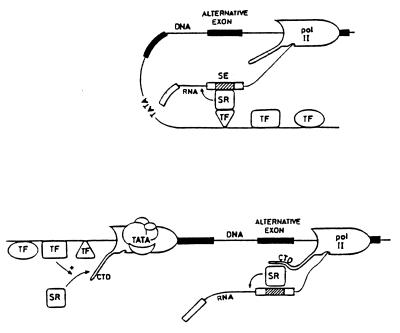
It has been assumed that constitutive and regulated splicing of RNA polymerase II transcripts depends exclusively on signals present in the RNA molecule. Here we show that changes in promoter structure strongly affect splice site selection. We investigated the splicing of the ED I exon, which encodes a facultative type III repeat of fibronectin, whose inclusion is regulated during development and in proliferative processes. We used an alternative splicing assay combined with promoter swapping to demonstrate that the extent of ED I splicing is dependent on the promoter structure from which the transcript originated and that this regulation is independent of the promoter strength. Thus, these results provide the first evidence for coupling between alternative splicing and promoter-specific transcription, which agrees with recent cytological and biochemical evidence of coordination between splicing and transcription.


Figures

Figure 1
Figure 1
Structure of the α-1 globin-FN constructs used to transfect Hep3B cells. Globin and FN exons are depicted by shaded and solid boxes, respectively. All exons are included constitutively except for ED I, which is facultatively spliced. Arrows on mRNA indicate approximate location of primers pSV5′j and pSV3′j (8) that overlap globin/FN exon boundaries, used to detect specific mRNA products by RT-PCR (see Experimental Procedures). Promoter regions used to replace the α-1 globin promoter of pSVEDA Tot (8) are depicted in scale. Transcription start sites are indicated by arrows underneath each promoter. Distances between each start site and the BssHII site used for cloning the promoters (see Experimental Procedures) are as follows: α-1 globin, 92 bp; CMV, 62 bp; wild-type and mutant (m) FN, 43 bp and MMTV, 289 bp.
Figure 2
Figure 2
Promoter structure affects ED I alternative splicing. RT-PCR + Southern blot analysis (lanes 1–7) and Northern blot analysis (lanes 8–14) of ED I+ and ED I mRNA isoforms produced in Hep3B cells transiently transfected with α-1 globin/FN chimaeric constructs (Fig. 1) under the control of the α-1 globin (lanes 2, 3, 9, and 10), CMV (lanes 4, 5, 11, and 12), wild-type FN (lanes 6 and 13) and CRE/CCAAT mutant FN (lanes 7 and 14) promoters. Duplicates of transfection are shown for the α-1 globin and CMV promoters. Northern duplicates correspond to electrophoresis runs of different lengths. Cells were cotransfected with a CMV promoter-β-gal reporter plasmid as a measure of transfection efficiency. Lane 1 is a control transfected with the β-gal plasmid and pBS SK+ (Stratagene) as carrier DNA. Quantification of scanned autoradiographs was carried out with the NIH image 1.60 software. ED I+/ED I ratios shown at the bottom of each lane and in the histogram are the average of three experiments. A thin horizontal line in the histogram indicates an ED I+/ED I ratio of 1.
Figure 3
Figure 3
Promoter-dependent ED I+/ED I mRNA ratios determined by RT-PCR are not influenced by the number of PCR cycles. Low and high ED I+/ED I ratios, characteristic of the α-1 globin and mutant FN promoters, respectively, remain constant in PCRs of 23, 25, and 30 cycles.
Figure 4
Figure 4
Transcriptional activation of two different promoters does not affect ED I inclusion. Northern blot analysis (lanes 1–4) and RT-PCR (lanes 5–9) of ED I+ and ED I mRNA isoforms produced in Hep3B cells transiently transfected with α-1 globin/FN chimaeric constructs under the control of the α-1 globin (lane 5), CMV (lanes 1, 2, 6, and 7) and MMTV (lanes 3, 4, 8, and 9) promoters. The CMV promoter was activated by incubation of the transfected cells with 1 mM dibutyryl cAMP for 48 hr beginning 6 hr after DNA addition (lanes 2 and 7). Activation of the MMTV promoter (lanes 4 and 9) was achieved by cotransfection with plasmid 6RGR (29) expressing the glucocorticoid receptor and incubation with 400 ng/ml dexamethasone for 48 hr beginning 6 hr after DNA addition. Cells were cotransfected with a Rous sarcoma virus (RSV) promoter-β-gal reporter plasmid to assess transfection efficiencies. Transfection and quantification conditions were as in Fig. 2. Hybridization to FN mRNA (8 kb) is shown as internal control.
Figure 5
Figure 5
Two alternative models for putative interactions between SR proteins bound to the ED I splicing enhancer (SE, hatched box) with transcription proteins. (Upper) SR protein activity is modulated by interaction with a regulatory transcription factor (TF) positioned on its cognate promoter site at the time splicing occurs. (Lower) Regulatory transcription factors interacting with the initiation complex promote loading of SR proteins (or other splicing factors) onto the moving RNA pol II complex.

References

    1. Xing Y, Lawrence J B. Trends Cell Biol. 1993;3:346–353. - PubMed
    1. Xing Y, Johnson C V, Dobner P R, Lawrence J B. Science. 1993;259:1326–1330. - PubMed
    1. Misteli T, Cáceres J F, Spector D L. Nature (London) 1997;387:523–526. - PubMed
    1. Kornblihtt A R, Vibe-Pedersen K, Baralle F E. EMBO J. 1984;3:221–226. - PMC - PubMed
    1. Gutman A, Kornblihtt A R. Proc Natl Acad Sci USA. 1987;84:7179–7182. - PMC - PubMed

Publication types

LinkOut - more resources