. 1997 Oct 14;94(21):11633-8.
doi: 10.1073/pnas.94.21.11633.

Decoding temporally encoded sensory input by cortical oscillations and thalamic phase comparators

Affiliations

Decoding temporally encoded sensory input by cortical oscillations and thalamic phase comparators

E Ahissar et al. Proc Natl Acad Sci U S A. .

Abstract

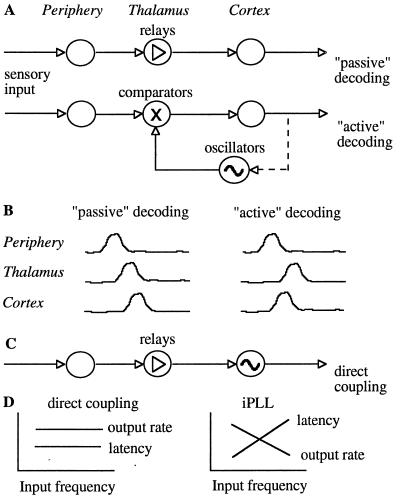
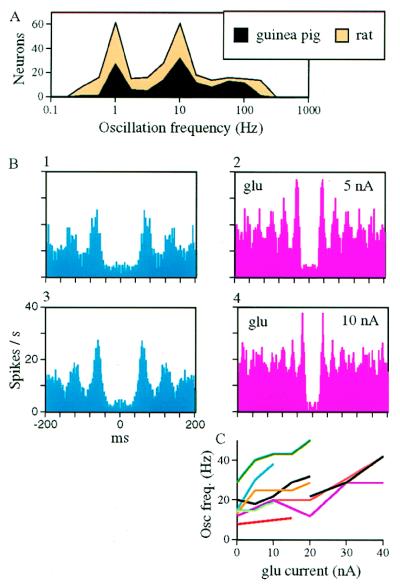
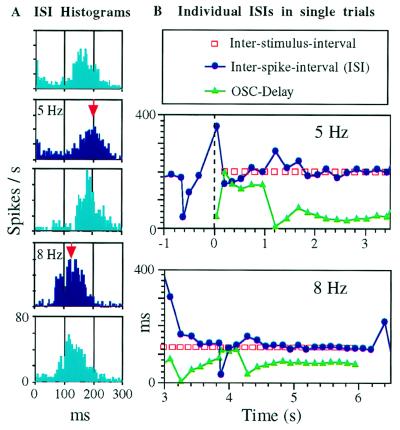
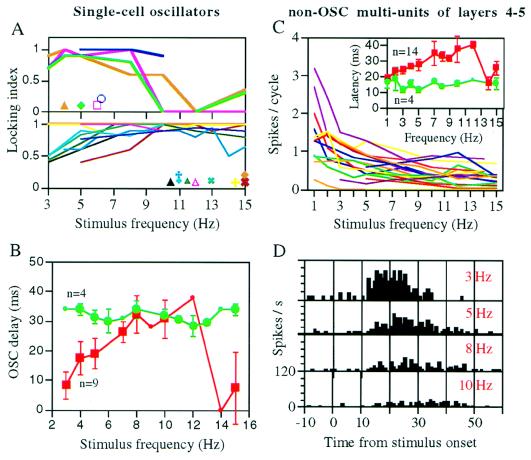
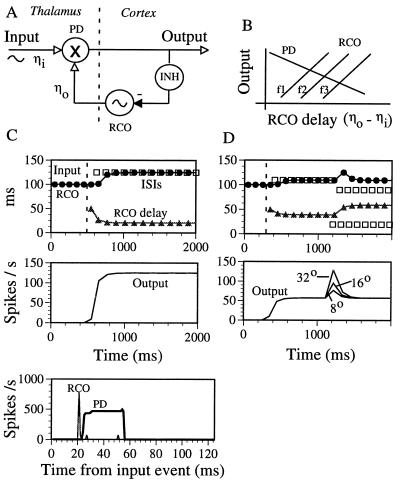
The temporally encoded information obtained by vibrissal touch could be decoded "passively," involving only input-driven elements, or "actively," utilizing intrinsically driven oscillators. A previous study suggested that the trigeminal somatosensory system of rats does not obey the bottom-up order of activation predicted by passive decoding. Thus, we have tested whether this system obeys the predictions of active decoding. We have studied cortical single units in the somatosensory cortices of anesthetized rats and guinea pigs and found that about a quarter of them exhibit clear spontaneous oscillations, many of them around whisking frequencies ( approximately 10 Hz). The frequencies of these oscillations could be controlled locally by glutamate. These oscillations could be forced to track the frequency of induced rhythmic whisker movements at a stable, frequency-dependent, phase difference. During these stimulations, the response intensities of multiunits at the thalamic recipient layers of the cortex decreased, and their latencies increased, with increasing input frequency. These observations are consistent with thalamocortical loops implementing phase-locked loops, circuits that are most efficient in decoding temporally encoded information like that obtained by active vibrissal touch. According to this model, and consistent with our results, populations of thalamic "relay" neurons function as phase "comparators" that compare cortical timing expectations with the actual input timing and represent the difference by their population output rate.


Figures

Figure 1
Figure 1
Possible pathways for temporal decoding. (A) Passive decoding is assumed to flow through feed-forward connections where the activity at each level depends on the activity at a lower (more peripheral) level. Arrows represent feed-forward elements including “simple” axons, delay lines, and synapses. Active decoding involves an independent cortical source of information—local oscillators; information flows both ways and compared, in this example, in the thalamus. The circuits can be closed (dashed lines) or open loops. (B) Possible orders of activations determined by the causal dependencies. With passive decoding the cortical neurons must lag at least some of the thalamic neurons, whereas with active decoding cortical neurons can fire at any time due to their intrinsic oscillatory sources. When operating as comparators, thalamic neurons should lag at least some of the cortical neurons. (C) Active decoding by direct coupling between input oscillations and cortical oscillators. (D) Predicted dependencies of thalamic responses on the input frequency.
Figure 2
Figure 2
(A) Distribution of clear oscillation frequencies in the somatosensory cortices of rats (n = 152 frequencies) and guinea pigs (n = 132). Of the 256 clearly oscillating neurons, 26 exhibited more than one oscillating frequency. (B) Effect of glutamate on oscillation frequencies. Autocorrelograms of a guinea pig OSC before (panel 1), during (panels 2 and 4), and between (panel 3) glutamate applications at 30 s each. (C) Current-frequency curves for nine OSCs (two from rats and seven from guinea pigs).
Figure 3
Figure 3
Frequency locking of a single-cell cortical oscillator (OSC) recorded from layers 2–3 of the barrel cortex of an anesthetized rat during stimulations of whisker E2 with square-wave stimuli (see Materials and Methods). (A) ISI histograms computed during the entire stimulation periods (blue) and the interleaved spontaneous periods (cyan). Red arrows point to the interstimulus intervals. (B) Lock-in dynamics during single stimulus trains. ISls (blue), inter-stimulus-intervals (red) and OSC-delays (green) are plotted as a function of time. Time 0 and the dashed line denote the beginning of a stimulus train. Note the 1:1 firing (one OSC spike per stimulus cycle) and constant phase difference during stabilized states. In the trial presented at the Bottom, the OSC remained “locked” for two additional cycles after the stimulus train ended.
Figure 4
Figure 4
Comparison of OSCs and non-OSCs response characteristics. (A) Entrainment tuning curves for 13 OSCs of the barrel cortex. OSCs were recorded from layers 2–3 (n = 4), 4 (n = 3), and 5–6 (n = 6) and their principal whiskers were stimulated with either square-wave or pulse stimuli. Symbols show the spontaneous frequencies of these oscillators. Locking index = 1 − |fifo|/(fi + fo), where fi is the stimulation frequency and fo is the oscillator frequency during stimulation. Oscillators were grouped by their locking ranges. (B) OSC delays of the 13 OSCs. OSC delays were measured from PSTHs as the delays between stimulus onset and onset of the closest activity peak of the oscillator. Oscillators that showed no dependency [n = 4, green symbols, all showed wide lock-in ranges (A Lower)] were pooled up separately. Different OSCs were tested with different frequencies. Small symbols indicate n = 1 for that frequency. Vertical lines indicate standard errors of the means. (C and D) Responses of non-OSC multiunits from layers 4–5 of the rat barrel cortex to pulse-stimuli applied to their principal whiskers. (C) Dependency of multiunit (n = 18) output rates and latencies-to-peak (Inset) on the stimulus frequency. All spikes that were elicited between 10 to 60 ms from the stimulus onset were counted and averaged over all repetitions of the same stimulus frequency. Latencies to peak response were measured from PSTHs, such as those in D. Neurons that showed no dependency (n = 4, green symbols) were pooled up separately. Symbols and vertical lines as in B. (D) PSTHs of a layer 5 non-OSC multiunit to different stimulus frequencies. Increased latency and reduced output rate accompanied increased stimulus frequency.
Figure 5
Figure 5
(A) The thalamo-cortical iPLL decoder. INH, inhibitory neuron(s); -, inhibitory connection; ηo, time of the recent RCO spike; ηi, time of the recent input spike. (B) iPLL transfer functions. The transfer functions should be monotonic, but not necessarily linear, within the PLL’s working ranges. The PD’s output decreases as the RCO delay (ηo − ηi) increases (PD curve). The RCO’s firing time is delayed as the PD’s output is increased (RCO curves). The exact relation between the two transfer functions depends on the input frequency (f1 < f2 < f3); stable (crossing) working points for higher frequencies are associated with larger RCO delays and lower outputs. (C) Simulation of an iPLL: steady input. (Upper) Frequency and phase locking-in are depicted. Stimulus started at t = 500 ms (dashed line). The RCO’s ISI (•) followed the input’s ISI (□). During the phase-locked state, the RCO-delay (Top) and the output rate (Nd/Io) of the average single PD neuron (Middle) were stabilized at values that represented the input frequency. The cycle histograms (Bottom) describe the instantaneous firing rates of the RCO and of the PD as functions of the input phase. After phase-locking was achieved, the RCO’s firing always preceded the PD’s firing. (D) Simulation of an iPLL: object localization. The whisking (period of 110 ms) commenced at t = 410 ms and the object was introduced at t = 1200 ms and at a spatial angle of 32°. The introduction of the object was simulated by inserting, in every whisking cycle, an additional input spike at the time when the whisker would have touched the object (20 ms from the protraction onset). After a transient response, the PLL relocked to the full whisking cycle, but with a new phase (upper panel). Different object locations (8°, 16°, and 32°) yielded, and thus are encoded by, different magnitudes of the transient response (Lower).

References

    1. Welker W I. Behavior. 1964;22:223–244.
    1. Carvell G E, Simons D J. J Neurosci. 1990;10:2638–2648. - PMC - PubMed
    1. Gustafson J W, Felbain-Keramidas S L. Psychol Bull. 1977;84:477–488. - PubMed
    1. Simons D J. In: Cerebral Cortex. Jones E G, Diamond I T, editors; Jones E G, Diamond I T, editors. Vol. 11. New York: Plenum; 1995. pp. 263–297.
    1. Zucker E, Welker W I. Brain Res. 1969;12:138–156. - PubMed

Publication types

LinkOut - more resources