Comparative Study
. 1997 Oct 14;94(21):11651-6.
doi: 10.1073/pnas.94.21.11651.

A human intermediate conductance calcium-activated potassium channel

Affiliations
Comparative Study

A human intermediate conductance calcium-activated potassium channel

T M Ishii et al. Proc Natl Acad Sci U S A. .

Abstract

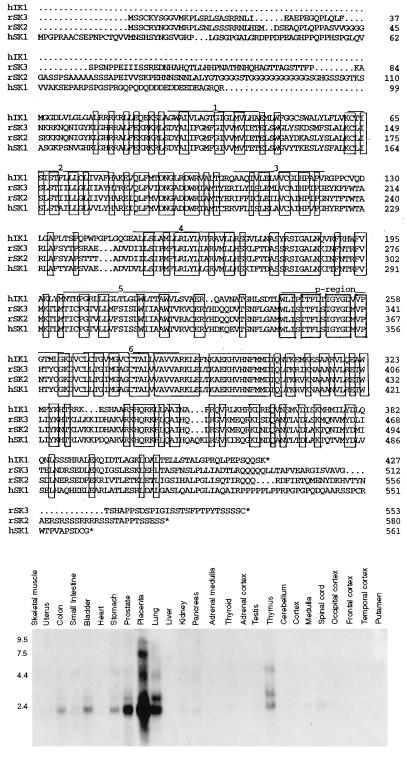
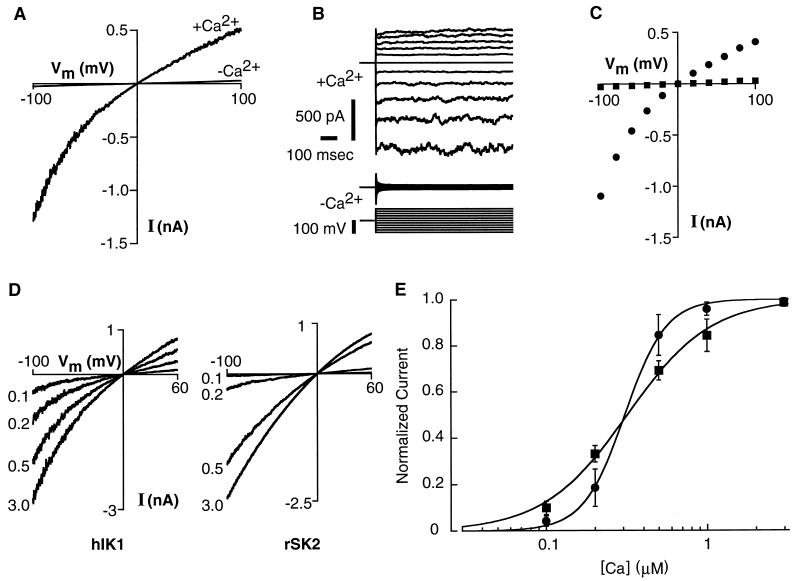
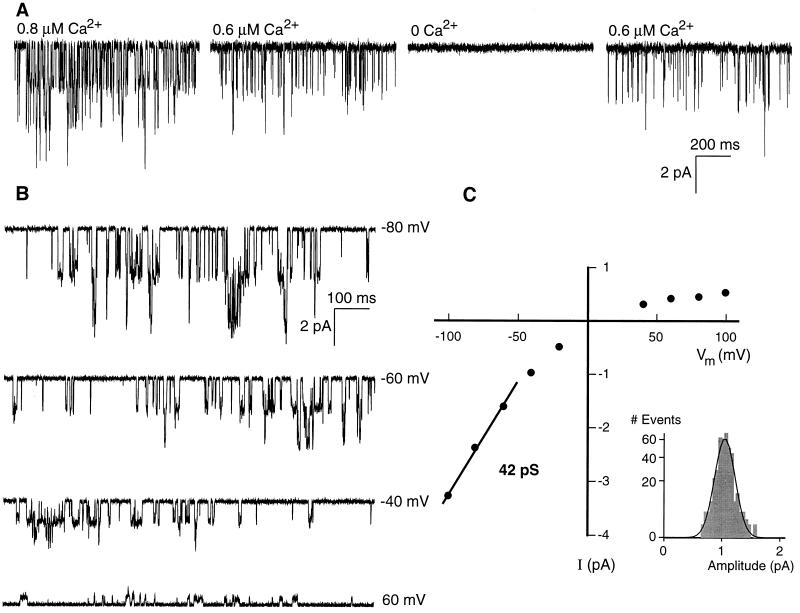
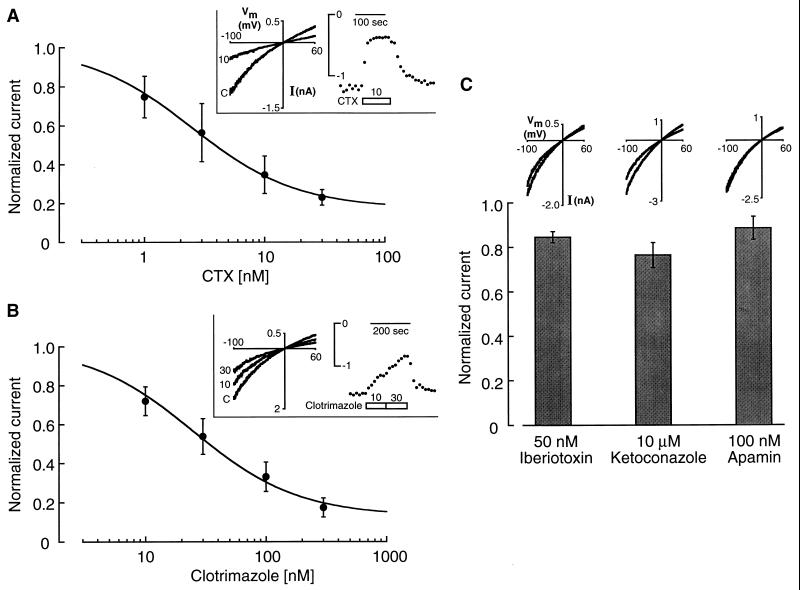
An intermediate conductance calcium-activated potassium channel, hIK1, was cloned from human pancreas. The predicted amino acid sequence is related to, but distinct from, the small conductance calcium-activated potassium channel subfamily, which is approximately 50% conserved. hIK1 mRNA was detected in peripheral tissues but not in brain. Expression of hIK1 in Xenopus oocytes gave rise to inwardly rectifying potassium currents, which were activated by submicromolar concentrations of intracellular calcium (K0.5 = 0.3 microM). Although the K0.5 for calcium was similar to that of small conductance calcium-activated potassium channels, the slope factor derived from the Hill equation was significantly reduced (1.7 vs. 3. 5). Single-channel current amplitudes reflected the macroscopic inward rectification and revealed a conductance level of 39 pS in the inward direction. hIK1 currents were reversibly blocked by charybdotoxin (Ki = 2.5 nM) and clotrimazole (Ki = 24.8 nM) but were minimally affected by apamin (100 nM), iberiotoxin (50 nM), or ketoconazole (10 microM). These biophysical and pharmacological properties are consistent with native intermediate conductance calcium-activated potassium channels, including the erythrocyte Gardos channel.


Figures

Figure 1
Figure 1
(Upper) Amino acid sequence of hIK1 and comparison with SK channel subunits. Alignments were generated by eye; dots represent gaps introduced to optimize the alignment. The six predicted transmembrane domains and the pore region are overlined. Residues that are conserved between hIK1 and any of the SK sequences are boxed. Amino acid numbers for the full-length coding sequences are given on the right. The hIK1 sequence has been deposited in GenBank (accession number AF022150). The asterisks indicate stop codons. (Lower) Northern blot analyses of hIK1 mRNA distribution. Poly(A)+ mRNA (2 μg), isolated from the indicated tissue sources, was loaded in each lane. Sizes are indicated to the left. hIK1 mRNA was detected in many peripheral tissues, particularly smooth muscle tissues, but not in brain.
Figure 2
Figure 2
(A) Current traces elicited by 2.5-s voltage ramps from −100 to 100 mV from inside-out macropatches excised from oocytes expressing hIK1. The traces were obtained in the presence (+Ca2+) or absence (−Ca2+) of 5 μM internal Ca2+. (B) Currents evoked by voltage steps from inside-out macropatches excised from an oocyte expressing hIK1, in the presence (Upper) or absence (Lower) of 5 μM internal Ca2+; voltage protocol is shown below the current traces. The membrane was stepped from a holding potential of 0 mV to test potentials between −100 and 100 mV. Currents activated instantaneously within the resolution of the recording configuration and showed no inactivation during the 900-ms test pulses. (C) Current–voltage relationship for the traces shown in B. Squares are in the absence of Ca2+; circles are in the presence of 5 μM Ca2+. (D) Current traces elicited by 2.5-s voltage ramps from −100 to 60 mV from inside-out macropatches excised from oocytes expressing hIK1 or rSK2. The traces were obtained in the presence of the indicated concentrations of intracellular Ca2+; current amplitudes increased as the Ca2+ concentration was raised. (E) Calcium concentration response for hIK1 and rSK2. For hIK1 (solid squares; n = 7) and rSK2 (solid circles; n = 4), the current measured at −100 mV normalized by the response in saturating Ca2+ (10 μM for hIK1 and 3 μM for rSK2) was plotted as a function of the calcium concentration. The data were fit with the Hill equation, yielding a K0.5 of 0.3 μM for both channels and a Hill coefficient of 1.7 for hIK1 and 3.5 for rSK2. (Error bars are ±SD.)
Figure 3
Figure 3
(A) Continuous recording at different internal calcium concentrations from a representative inside-out patch containing several hIK1 channels. Decreasing the calcium concentration from 0.8 to 0.6 μM decreased channel activity. Channel activity ceased when calcium was removed and returned following reapplication of 0.6 μM calcium. Gaps represent breaks in the continuously acquired recording. (B) Channel activity from a representative patch recorded in the presence of 0.4 μM calcium at −80, −60, −40, and 60 mV. The patch contained more than one channel, and double openings are apparent. (C) Single channel current–voltage relationship for the patch presented in B. Data points were derived from fitting amplitude histograms at each membrane potential; a representative histogram (−40 mV) and fit are shown as an Inset. Linear regression fitting of the current–voltage relationship between −60 and −100 mV yielded a single channel conductance of 42 pS.
Figure 4
Figure 4
(A and B) Dose response for block by external CTX (A) or clotrimazole (B). Block was determined from outside-out patches exposed to increasing concentrations of blocker. Each data point represents the fractional current (drug/control) at −100 mV. Currents were elicited by voltage ramps; representative traces with the concentrations of blockers (nM) are shown as Insets. Nonlinear least squares fit to a Langmuir isotherm (continuous line) yielded a Ki of 2.5 nM for CTX and 24.8 nM for clotrimazole. An offset was included to account for residual, unblocked current (0.17 for CTX and 0.13 for clotrimazole). (Error bars are ±SD.) Insets show onset and reversal of block. (C) Bar graph showing normalized current in the presence of IBX (50 nM; n = 4), ketoconazole (10 μM; n = 4), and apamin (100 nM; n = 5). Normalized current was determined by comparing the current amplitude at −100 mV in the presence or absence of drug. Currents were elicited by voltage ramp commands, and representative traces are shown above each column. Reduced current traces are in the presence of drug. (Error bars are ±SD.)

References

    1. Latorre R, Oberhauser A, Labarca P, Alvarez O. Annu Rev Phys. 1989;51:385–399. - PubMed
    1. Atkinson N S, Robertson G A, Ganetzky B. Science. 1991;253:551–555. - PubMed
    1. Adelman J P, Shen K Z, Kavanaugh M P, Warren R A, Wu Y N, Lagrutta A, Bond C T, North R A. Neuron. 1992;9:209–216. - PubMed
    1. Butler A, Tsunoda S, McCobb D P, Wei A, Salkoff L. Science. 1993;261:221–224. - PubMed
    1. Köhler M, Hirschberg B, Bond C T, Kinzie J M, Marrion N V, Maylie J, Adelman J P. Science. 1996;273:1709–1714. - PubMed

Publication types

MeSH terms

Substances

Associated data