. 1997 Oct 14;94(21):11710-5.
doi: 10.1073/pnas.94.21.11710.

A mouse model for the renal salt-wasting syndrome pseudohypoaldosteronism

Affiliations

A mouse model for the renal salt-wasting syndrome pseudohypoaldosteronism

E Hummler et al. Proc Natl Acad Sci U S A. .

Abstract

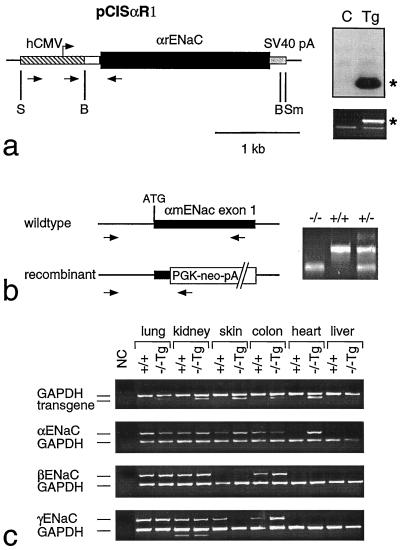
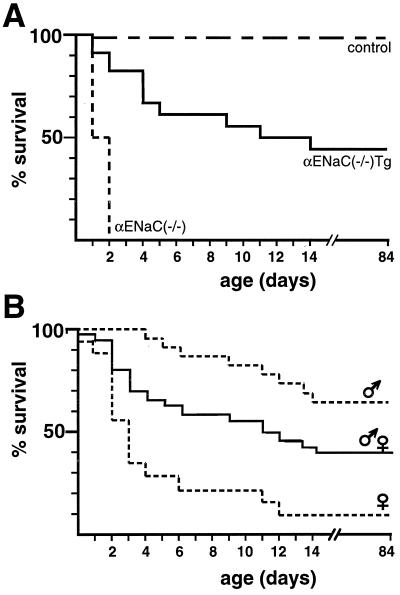
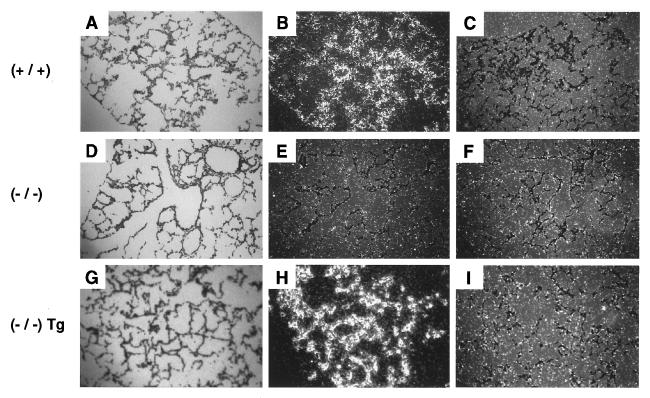
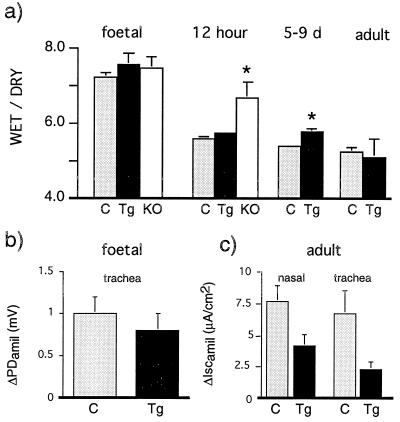
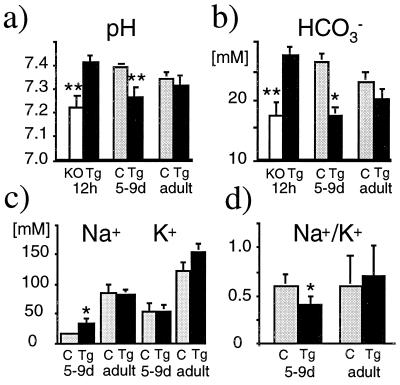
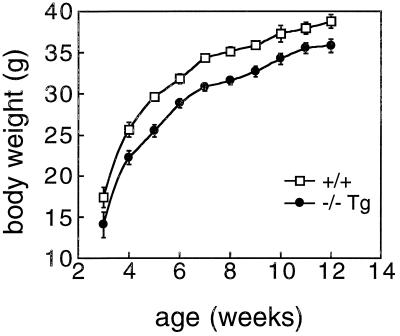
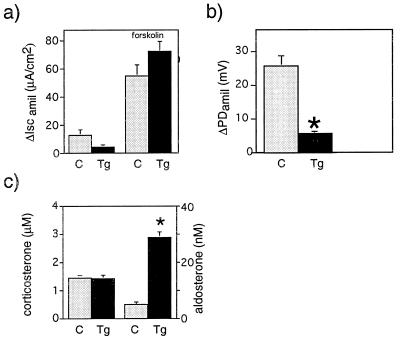
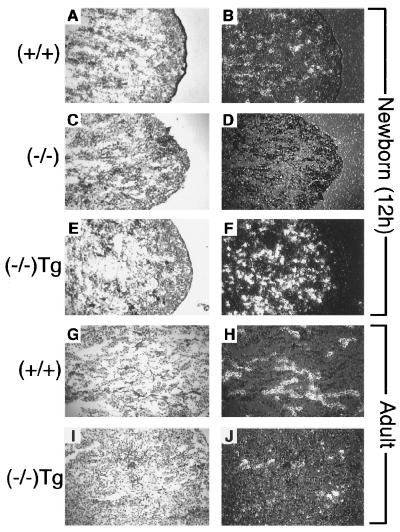
Aldosterone-dependent epithelial sodium transport in the distal nephron is mediated by the absorption of sodium through the highly selective, amiloride-sensitive epithelial sodium channel (ENaC) made of three homologous subunits (alpha, beta, and gamma). In human, autosomal recessive mutations of alpha, beta, or gammaENaC subunits cause pseudohypoaldosteronism type 1 (PHA-1), a renal salt-wasting syndrome characterized by severe hypovolemia, high plasma aldosterone, hyponatremia, life-threatening hyperkaliemia, and metabolic acidosis. In the mouse, inactivation of alphaENaC results in failure to clear fetal lung liquid at birth and in early neonatal death, preventing the observation of a PHA-1 renal phenotype. Transgenic expression of alphaENaC driven by a cytomegalovirus promoter in alphaENaC(-/-) knockout mice [alphaENaC(-/-)Tg] rescued the perinatal lethal pulmonary phenotype and partially restored Na+ transport in renal, colonic, and pulmonary epithelia. At days 5-9, however, alphaENaC(-/-)Tg mice showed clinical features of severe PHA-1 with metabolic acidosis, urinary salt-wasting, growth retardation, and 50% mortality. Adult alphaENaC(-/-)Tg survivors exhibited a compensated PHA-1 with normal acid/base and electrolyte values but 6-fold elevation of plasma aldosterone compared with wild-type littermate controls. We conclude that partial restoration of ENaC-mediated Na+ absorption in this transgenic mouse results in a mouse model for PHA-1.


Figures

Figure 1
Figure 1
(a) Generation of αENaC(−/−)Tg mice. (Left) pCisαR1 transgene vector containing human cytomegalovirus promoter (hatched box) with an artificial intron (open box), rat αENaC cDNA (black box), and simian virus 40 large T poly(A) (stippled box). S = SpeI; B = BamHI; Sm = SmaI. (Right, Upper) Southern blot of BamHI-digested DNA from transgenic mouse (Tg; line 1352) and nontransgenic control (C) littermate probed with αrENaC cDNA. ∗, transgene-specific fragment. (Right, Lower) PCR-based genotyping for the transgene (651 bp*) using a set of specific primers as indicated in a. (b) PCR-based genotyping for the gene targeting status (−/−, +/+, +/−) using specific primers (arrows). (c) Detection of mRNA transcripts (reverse transcription-PCR) for transgene (507 bp; primers indicated in a), αENaC, βmENaC, and γmENaC in transgenic homozygous mutant [αENaC(−/−)Tg] mice and wild-type αENaC(+/+) mice using specific intron-spanning primers (15). γENaC mRNA transcript in skin of αENaC(−/−)Tg mice is visible on the original.
Figure 2
Figure 2
Survival of αENaC(−/−)Tg mice (A) Survival rate of αENaC(−/−)mice, αENaC(−/−)Tg mice, and control mice [αENaC(+/+) and αENaC(+/−) mice, transgenic and nontransgenic]. Sixteen complete litters from heterozygous breeding (in total 181 mice) were analyzed [αENaC(+/+), n = 29; αENaC(+/+) Tg, n = 26; αENaC(+/−), n = 59; αENaC(+/−) Tg, n = 39; αENaC(−/−), n = 10; and αENaC(−/−)Tg, n = 18]. Dead animals were collected and recorded daily. (B) Overall survival rate of male [14/22 (64%); n = 22] vs. female [2/18 (11%); n = 18] αENaC(−/−)Tg mice.
Figure 3
Figure 3
In situ hybridization analysis in lung. Localization of αENaC mRNA and αrENaC transgene mRNA in lung of 12-h-old pups. Bright-field (A, D, and G) and dark-field (B, C, E, F, H, and I) photographs of sections from wild-type (+/+; A, B, and C), αENaC(−/−) (D, E, and F), and αENaC(−/−)Tg mice (G, H, and I) after hybridization with α antisense (B, E, and H) or α sense (C, F, and I) rENaC 35S-labeled probes.
Figure 4
Figure 4
Physiological measurements in lung. Control littermates (C, light gray column), αENaC(−/−)Tg mice (Tg, black column), and αENaC(−/−) mice (KO, white column) of different ages. (a) Mean whole lung water content (wet/dry ratio); 12 h: αENaC(−/−) vs. αENaC(−/−)Tg and control littermates, ∗, P < 0.05; 5–9 days: αENaC(−/−)Tg vs. control littermates, ∗, P < 0.05. (b) Amiloride-sensitive inhibition of potential difference (ΔPDamil) in tracheal explants from 19-day-old fetuses. αENaC(−/−)Tg, n = 7 vs. control littermates, n = 22. (c) Amiloride-sensitive short circuit current (ΔIscamil) in excised adult nasal and tracheal epithelium. αENaC(−/−)Tg, n = 4 vs. control littermates, n = 4.
Figure 5
Figure 5
Physiological parameters in αENaC(−/−)Tg. pH (a) and bicarbonate measurements (b) and urinary Na+ and K+ measurements (c and d) in control littermates (C, light gray column), αENaC(−/−)Tg mice (Tg, black column), and αENaC(−/−) mice (KO, white column) of different ages. ∗, P < 0.05; ∗∗, P < 0.01.
Figure 6
Figure 6
Growth curve of αENaC(−/−)Tg mice. Growth curve of male αENaC(−/−)Tg mice (closed circles) and male littermate controls (+/+; open squares). Mice were weighed once a week on the same day and time.
Figure 7
Figure 7
Bioelectric measurements (a and b) and hormone levels (c) of control (C, light gray column) and αENaC(−/−) Tg mice (Tg, black column); mean ± SEM. (a) Amiloride-sensitive short circuit current (ΔIscamil) in fetal colon epithelia (19 days old). Responses to intracellular cAMP stimulant, forskolin were similar in both groups. (b) In vivo measurements of amiloride-sensitive rectal PD (ΔPDamil) in adult male αENaC(−/−)Tg and αENaC(+/+) mice. ∗, P < 0.001. (c) Plasma corticosterone levels (μM) (left columns) and plasma aldosterone levels (nM) (right columns) in adult αENaC(−/−)Tg vs. control littermates [αENaC(+/+); ∗, P < 0.001].
Figure 8
Figure 8
In situ hybridization analysis in kidney. Bright-field (Left) and dark-field (Right) photographs of kidney sections from 12-h-old pups. A and B, (+/+), wild-type; C and D, (−/−), αENaC(−/−); E and F, (−/−)Tg, αENaC(−/−)Tg from adult; G and H, (+/+) wild-type; and I and J, (−/−)Tg, αENaC(−/−)Tg after hybridization with αENaC antisense probe (right columns).

References

    1. Canessa C M, Schild L, Buell G, Thorens B, Gautschi I, Horisberger J D, Rossier B C. Nature (London) 1994;367:463–467. - PubMed
    1. Duc C, Farman N, Canessa C M, Bonvalet J-P. J Cell Biol. 1994;127:1907–1921. - PMC - PubMed
    1. Rossier B C. Adv Nephrol. 1996;25:275–286. - PubMed
    1. Pacha J, Frindt G, Antonian L, Silver R B, Palmer L G. J Gen Physiol. 1993;102:25–42. - PMC - PubMed
    1. Rajendran V M, Kashgarian M, Binder H J. J Biol Chem. 1989;264:18638–18644. - PubMed

Publication types

MeSH terms

LinkOut - more resources