

K-ras is an essential gene in the mouse with partial functional overlap with N-ras
- PMID: 9334313
- PMCID: PMC316567
- DOI: 10.1101/gad.11.19.2468
K-ras is an essential gene in the mouse with partial functional overlap with N-ras
Erratum in
- Genes Dev 1997 Dec 1;11(23):3277
Abstract
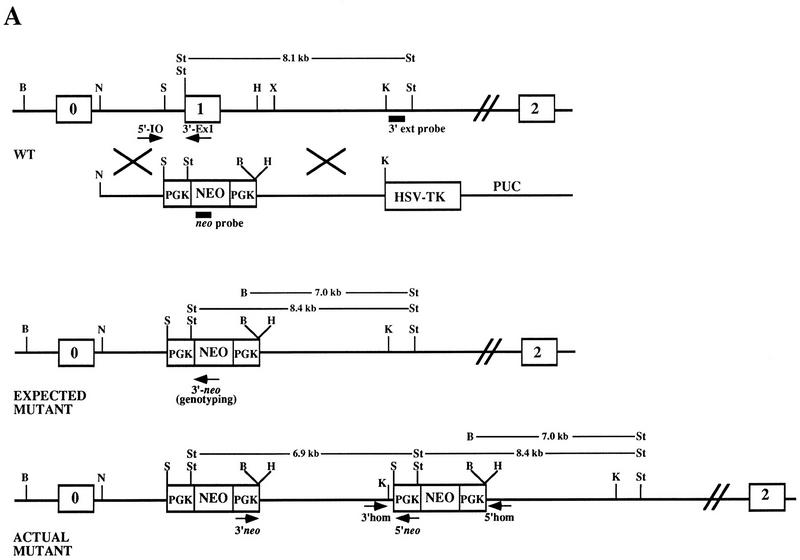
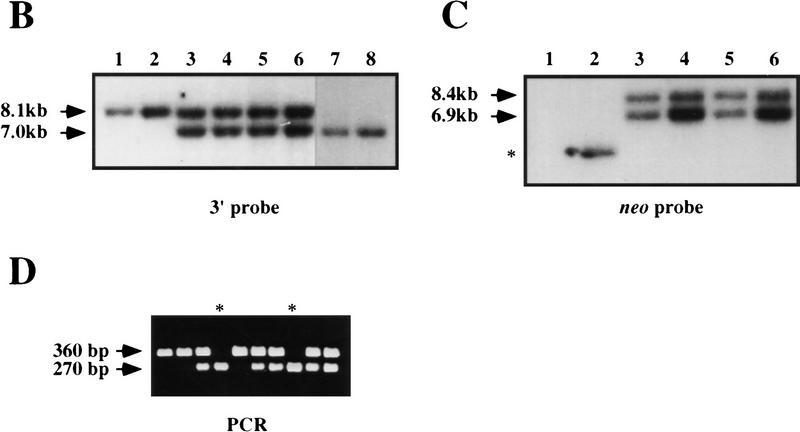
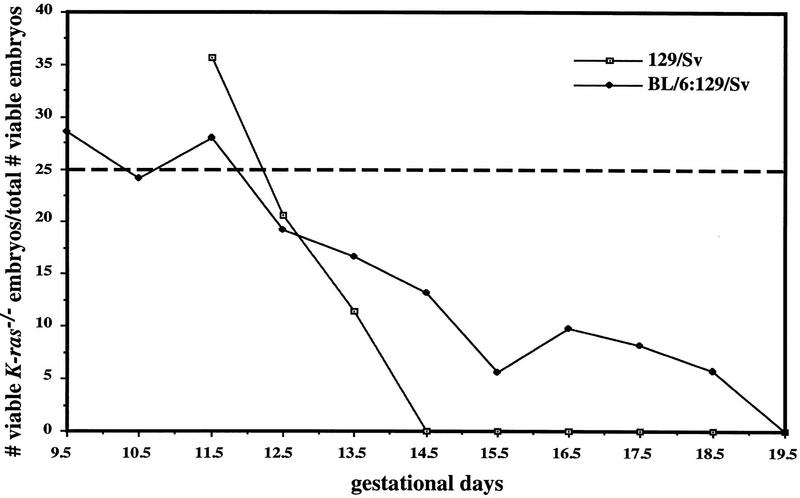
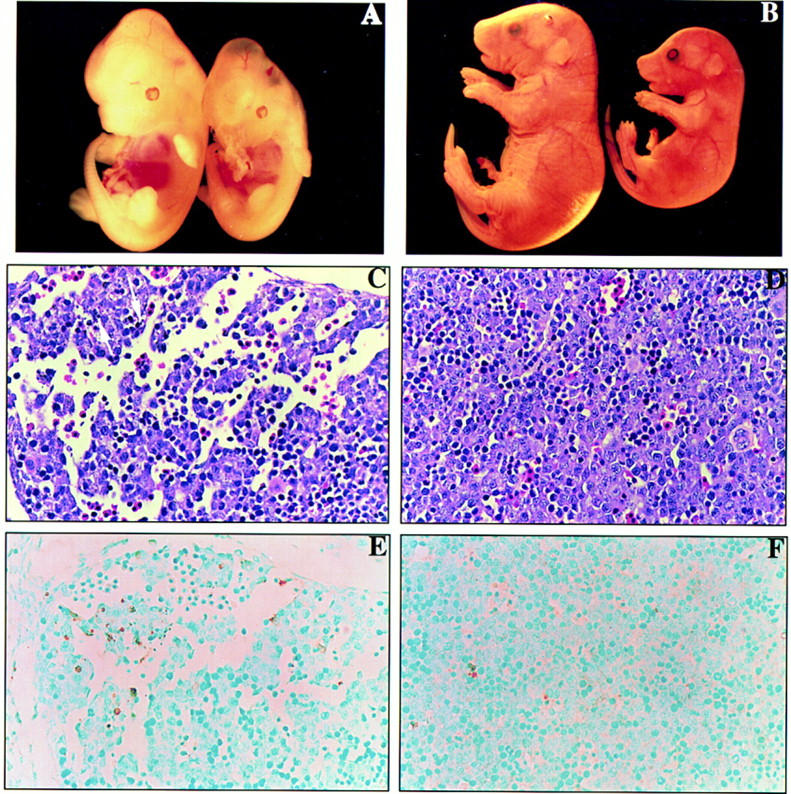
Mammalian ras genes are thought to be critical in the regulation of cellular proliferation and differentiation and are mutated in approximately 30% of all human tumors. However, N-ras and H-ras are nonessential for mouse development. To characterize the normal role of K-ras in growth and development, we have mutated it by gene targeting in the mouse. On an inbred genetic background, embryos homozygous for this mutation die between 12 and 14 days of gestation, with fetal liver defects and evidence of anemia. Thus, K-ras is the only member of the ras gene family essential for mouse embryogenesis. We have also investigated the effect of multiple mutations within the ras gene family. Most animals lacking N-ras function and heterozygous for the K-ras mutation exhibit abnormal hematopoietic development and die between days 10 and 12 of embryogenesis. Thus, partial functional overlap appears to occur within the ras gene family, but K-ras provides a unique and essential function.
Figures
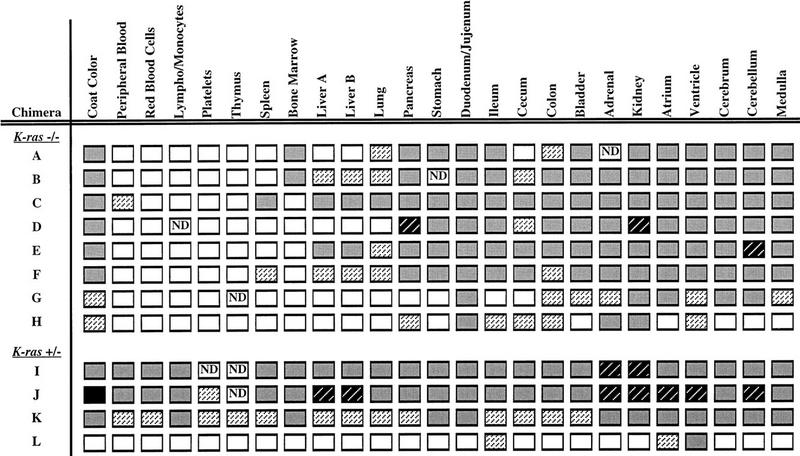
 ; 11%–25%
  ; 26%–50% ; 51%–75%
  ; or 76%–100%
  . (ND) Not determined. K-ras−/− ES cells had significantly reduced contribution to multiple hematopoietic lineages and the tissues that support their production throughout embryogenesis and adulthood.
References
-
- Barbacid M. ras genes. Annu Rev Biochem. 1987;56:779–827. - PubMed
-
- Bos JL. The ras gene family and human carcinogenesis. Mutat Res. 1988;195:255–271. - PubMed
-
- ————— ras oncogenes in human cancer: A review [published erratum appears in Cancer Res 1990 Feb 15; 50 (4): 1352] Cancer Res. 1989;49:4682–4689. - PubMed
-
- Bourne HR, Sanders DA, McCormick F. The GTPase superfamily: A conserved switch for diverse cell functions. Nature. 1990;348:125–132. - PubMed
-
- Bradley A. Production and analysis of Chimeric mice. In: Robertson EJ, editor. Teratocarcinomas and embryonic stem cells: A practical approach. Oxford, UK: IRL Press; 1987. pp. 113–152.
Publication types
MeSH terms
LinkOut - more resources
Full Text Sources
Other Literature Sources
Molecular Biology Databases
Research Materials
Miscellaneous