Comparative Study
. 1997 Nov 1;17(21):8596-612.
doi: 10.1523/JNEUROSCI.17-21-08596.1997.

Systemic morphine-induced Fos protein in the rat striatum and nucleus accumbens is regulated by mu opioid receptors in the substantia nigra and ventral tegmental area

Affiliations
Comparative Study

Systemic morphine-induced Fos protein in the rat striatum and nucleus accumbens is regulated by mu opioid receptors in the substantia nigra and ventral tegmental area

B Bontempi et al. J Neurosci. .

Abstract

To characterize how systemic morphine induces Fos protein in dorsomedial striatum and nucleus accumbens (NAc), we examined the role of receptors in striatum, substantia nigra (SN), and ventral tegmental area (VTA). Morphine injected into medial SN or into VTA of awake rats induced Fos in neurons in ipsilateral dorsomedial striatum and NAc. Morphine injected into lateral SN induced Fos in dorsolateral striatum and globus pallidus. The morphine infusions produced contralateral turning that was most prominent after lateral SN injections. Intranigral injections of [D-Ala2, N-Me-Phe4, Gly-ol5]-enkephalin (DAMGO), a mu opioid receptor agonist, and of bicuculline, a GABAA receptor antagonist, induced Fos in ipsilateral striatum. Fos induction in dorsomedial striatum produced by systemic administration of morphine was blocked by (1) SN and VTA injections of the mu1 opioid antagonist naloxonazine and (2) striatal injections of either MK 801, an NMDA glutamate receptor antagonist, or SCH 23390, a D1 dopamine receptor antagonist. Fos induction in dorsomedial striatum and NAc after systemic administration of morphine seems to be mediated by dopamine neurons in medial SN and VTA that project to medial striatum and NAc, respectively. Systemic morphine is proposed to act on mu opioid receptors located on GABAergic interneurons in medial SN and VTA. Inhibition of these GABA interneurons disinhibits medial SN and VTA dopamine neurons, producing dopamine release in medial striatum and NAc. This activates D1 dopamine receptors and coupled with the coactivation of NMDA receptors possibly from cortical glutamate input induces Fos in striatal and NAc neurons. The modulation of target gene expression by Fos could influence addictive behavioral responses to opiates.


Figures
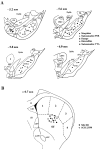
Fig. 1.
Fig. 1.
A, Injection sites are plotted on coronal brain sections for the rats that received 0.5 μl injections into the substantia nigra pars reticulata (SNR) of morphine (1, 5, 7.5, and 10 μg; n = 37;filled circles), DAMGO (1 μg; n = 6; filled squares), naloxonazine (0.5 μg;n = 7; open circles), or bicuculline (0.5 μg; n = 6; open squares). Each symbol corresponds to the deepest penetration of the cannula track. The distance from bregma for each section is given in millimeters. The placements of the injection sites in the ventral tegmental area (VTA) for the animals that received 0.3 μl injections of naloxonazine (0.5 μg; n = 6;filled diamonds) are plotted on a single plane (−5.2 mm) (adapted from Paxinos and Watson, 1986). B, Injection sites are plotted on coronal brain sections for the animals that received 2 μl injections into the striatum of either the D1 dopamine receptor antagonist SCH 23390 (0.1 μg;n = 7; open circles) or the NMDA glutamate receptor antagonist MK 801 (0.1 μg; n = 7; filled circles). Although injection sites were made between 0.2 and 0.8 mm anterior to bregma, they are represented on a single plane (+0.7 mm) (redrawn from Paxinos and Watson, 1986). Thedotted lines indicate how the striatum was arbitrarily divided into four areas within which quantitative analyses of Fos-positive neurons were performed. ST, Striatum;AcbSh, nucleus accumbens shell; AcbC, nucleus accumbens core (for complete listing of all abbreviations, seePaxinos and Watson, 1986).
Fig. 2.
Fig. 2.
A, Photomicrograph of a cresyl violet-stained section showing the locations of the guide cannula track (arrow) and the tip of the internal cannula (arrowhead) after injection of morphine into medial substantia nigra pars reticulata (SNr).B, Higher power view of A showing the injection site. Scale bar (shown in B):A, 100 μm; B, 50 μm.
Fig. 7.
Fig. 7.
Locations of injection cannula tips for animals that received morphine either (A) into the substantia nigra pars reticulata (SNR) (10 μg in 0.5 μl) or (B) into the ventral tegmental area (VTA) (10 μg in 0.3 μl). All injection sites, which were between 5.2 and 6.0 mm posterior to bregma for SNr and between 4.8 and 5.6 mm posterior to bregma for VTA, are represented on two single planes (−5.6 and −5.2 mm for SNr and VTA, respectively) (redrawn from Paxinos and Watson, 1986). The SNr was arbitrarily divided into three regions shown with the dotted linesand labeled MEDIAL, MIDDLE, and LATERAL. The symbols denote injection sites within SNr, and the type of symbol denotes whether the injection induced Fos in medial striatum/NAc (filled triangles), in medial and lateral striatum (open circles), or mainly in lateral striatum (filled circles) (see Fig. 5). Thesymbols above the SNr (filled squares) represent a “negative control site” made to test the site specificity. These morphine injections did not induce Fos in striatum nor did they produce rotational behavior. Morphine injections into the VTA (B) were found to induce Fos protein mostly in NAc and medial striatum (see Fig. 13) (for complete listing of all abbreviations, see Paxinos and Watson, 1986).
Fig. 3.
Fig. 3.
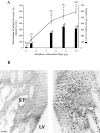
A, Number of Fos-immunoreactive nuclei (open squares) induced in the rat striatum 2 hr after saline (0) and morphine injections (1, 5, 7.5, and 10 μg in 0.5 μl) into ipsilateral substantia nigra pars reticulata (SNr) and the effects of each dose of morphine on rotational behavior (filled bars). Note that increasing morphine doses increased the number of Fos-stained neurons in striatum, the maximal response being obtained with 10 μg of morphine. Morphine injections were accompanied by a dose-dependent increase in locomotor activity as revealed by the number of rotations recorded during the first 30 min after morphine injections. Animals rotated away from the injection side (contralateral turning). The number of rats in each group is given in parentheses. Fos induction: *p < 0.05; ***p < 0.001 as compared with saline (0 dose). Rotation:p < 0.05;••p < 0.01;•••p < 0.001 as compared with saline. B, Photomicrographs of a rat striatum (dorsomedial part) showing Fos protein induction 2 hr after saline injection into one medial SNr (left) and morphine injection (10 μg) into the opposite medial SNr (right) of the same animal. Note that the intranigral injection of morphine markedly increased Fos protein in dorsomedial striatum (right) as compared with the side injected with saline (left). ST, Striatum; LV, lateral ventricle. Scale bar, 100 μm.
Fig. 4.
Fig. 4.
Plot of the rotation rate recorded during the first 30 min after intranigral injections of morphine (1, 5, 7.5, and 10 μg; n = 37) versus the total number of Fos-positive nuclei counted in the striatum. The rotational behavior was positively correlated with the number of striatal Fos neurons (r = +0.73; p < 0.001; df = 36). The line represents linear regression derived by the method of least squares.
Fig. 5.
Fig. 5.
Photomicrographs illustrating the distribution of Fos-positive nuclei in the striatum 2 hr after ipsilateral injections of morphine (10 μg) into the medial part (A), the middle part (B), or the lateral part (C) of the SNr (for injection site placements, see Fig. 7A). Fields indicated bybrackets are shown at higher magnification inpanels 1–6. An intense induction of Fos was observed in the dorsomedial striatum (A2) after morphine injection into medial SNr, whereas very few Fos-positive neurons were found in the dorsolateral striatum (A1). After morphine injections into the middle SNr, Fos was expressed in both dorsomedial (B4) and dorsolateral striatum (B3). After morphine injections into lateral SNr, Fos-stained neurons were mainly limited to the dorsolateral striatum (C5), with little Fos in the dorsomedial striatum (C6). ST, Striatum. Scale bars:A–C, 1 mm; panels 1–6, 150 μm.
Fig. 6.
Fig. 6.
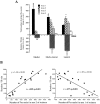
Effects of intranigral morphine injections on the distribution of Fos immunostaining within the striatum and on the rotational behavior. A, Animals injected with 10 μg of morphine were divided into three groups (Medial pattern group, n = 6; Medio-lateral pattern group, n = 6; and Lateral pattern group, n = 6) according to the patterns of Fos expression in the four different areas of the striatum (areas 1, 2, 3, and 4; see Fig. 1B). The number of Fos-positive neurons in the different areas of the striatum for these three groups is presented with the corresponding rotational behavior. Rotation rate was greater in the lateral and mediolateral groups compared with the medial and saline (dotted line) groups (p < 0.05 as compared with saline group; ***p < 0.001 as compared with medial and saline groups). Fos induction was the greatest in area 1 in the medial group and declined in the other groups, whereas the numbers of Fos-stained cells increased in areas 2, 3, and 4 in the lateral group compared with the medial group. (Medial group, °°°p < 0.001 for area 1 as compared with areas 2, 3, and 4. Medio-lateral group,Δp < 0.05 for areas 1 and 2 as compared with areas 3 and 4. Lateral group,+p < 0.05 for area 2 as compared with areas 1, 3, and 4). B, The magnitude of the morphine-induced rotational behavior correlated with the pattern of Fos expression within the striatum. The number of rotations was positively correlated (left panel) with the number of Fos-positive nuclei in area 2 of striatum (r = +0.89; p < 0.001; df = 17) but was negatively correlated (right panel) with the number of Fos-stained neurons in area 1 of striatum (r = −0.77; p < 0.001; df = 17).
Fig. 8.
Fig. 8.
Photomicrographs of Fos immunoreactivity in coronal sections through the parietal (A) and anterior cingulate (B) cortices showing marked induction of Fos-positive nuclei in a rat injected with 10 μg of morphine into the medial part of the SNr. Note the large number of cells immunoreactive for Fos in parietal cortex, especially in layer VI (arrowhead). Par, Parietal cortex;Cing Ant, anterior cingulate cortex; cc, corpus callosum. Scale bar, 80 μm.
Fig. 9.
Fig. 9.
Photomicrographs of Fos immunoreactivity in coronal sections through the globus pallidus (GP) showing (A) marked induction of Fos-positive nuclei in a rat injected with 10 μg of morphine into the lateral part of the SNr compared with (B) no Fos immunostaining in a rat injected with 10 μg of morphine into the medial part of the SNr. Scale bar, 300 μm.
Fig. 10.
Fig. 10.
A, Effects of injection of the μ1 opioid receptor antagonist naloxonazine (NLXZ) into substantia nigra pars reticulata (SNr) and ventral tegmental area (VTA) or intrastriatal injections of the NMDA glutamate receptor antagonist MK 801 and the D1 dopamine receptor antagonist SCH 23390 on Fos induction in striatum (ST) after systemic administration of morphine (10 mg/kg, i.p., 4 times over 2 hr). The different antagonists were injected 30 min before morphine. The number of Fos-positive nuclei was significantly reduced (**p < 0.01; ***p < 0.001) in the striatum ipsilateral to the antagonist injections (cross-hatched bars) compared with vehicle injections (open bars). B, The μ opioid receptor agonist DAMGO and the GABAA receptor antagonist bicuculline injected into SNr significantly increased (***p < 0.001) the number of Fos-positive nuclei in the striatum ipsilateral to the injected side (cross-hatched bars) compared with the vehicle-injected side (open bars).
Fig. 11.
Fig. 11.
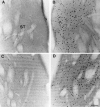
A, B, Photomicrographs of a rat dorsomedial striatum showing (A) marked Fos protein induction 2 hr after injection of the μ opioid receptor agonist DAMGO (1 μg) into one medial SNr as compared with (B) the very low level of Fos induction after saline injection into the opposite medial SNr. C, D, Fos protein induction in dorsomedial striatum after systemic administration of morphine (10 mg/kg, i.p., 4 times over 2 hr) in a rat that had vehicle injected into one SNr (D) and the μ1 opioid receptor antagonist naloxonazine (0.5 μg) injected into the opposite SNr (C) 30 min previously. Note that Fos induction was reduced in the striatum ipsilateral to the naloxonazine injection. E, F, Fos protein induction in the dorsolateral striatum of an animal injected with the GABAA receptor antagonist bicuculline (0.5 μg) into one lateral SNr (E) and saline injected into the opposite lateral SNr (F). ST, Dorsomedial striatum; ST lat, dorsolateral striatum; LV, lateral ventricle. Scale bar, 250 μm.
Fig. 12.
Fig. 12.
Fos protein induction in dorsomedial striatum after systemic administration of morphine (10 mg/kg, i.p., 4 times over 2 hr) in rats that had saline injected into one striatum (B, D) and the NMDA glutamate receptor antagonist MK 801 (0.1 μg) (A) or the D1 dopamine receptor antagonist SCH 23390 (0.1 μg) (C) injected into the opposite striatum 30 min previously. Note that MK 801 and SCH 23390 markedly decreased Fos protein induction compared with the side injected with saline. ST, Striatum. Scale bar, 85 μm.
Fig. 13.
Fig. 13.
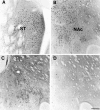
Photomicrographs of a rat dorsomedial striatum (A) and nucleus accumbens (NAc) (B) showing marked Fos protein induction 2 hr after morphine (10 μg) injection into the ipsilateral VTA. Morphine injected into medial SNr also induced Fos protein in the NAc (C) compared with little Fos induction after morphine injection into lateral SNr (D).ST, Striatum. Scale bar, 200 μm.

References

    1. Akil H, Watson SJ, Young E, Lewis ME, Khachaturian H, Walker JM. Endogenous opioids: biology and function. Annu Rev Neurosci. 1984;7:223–255. - PubMed
    1. Albin RL, Young AB, Penney JB. The functional anatomy of disorders of the basal ganglia. Trends Neurosci. 1995;18:63–64. - PubMed
    1. Alexander GE, Crutcher MD. Functional architecture of basal ganglia circuits: neural substrates of parallel processing. Trends Neurosci. 1990;13:266–271. - PubMed
    1. Aronin N, Chase K, Sagar SM, Sharp FR, DiFiglia M. N-methyl-d-aspartate receptor activation in the neostriatum increases c-fos and fos-related antigens selectively in medium-sized neurons. Neuroscience. 1991;44:409–420. - PubMed
    1. Bading H, Ginty DD, Greenberg ME. Regulation of gene expression in hippocampal neurons by distinct calcium signalling pathways. Science. 1993;260:181–186. - PubMed

Publication types

MeSH terms