

doi: 10.1073/pnas.94.22.11935.
Mechanical separation of the complementary strands of DNA
Affiliations
- PMID: 9342340
- PMCID: PMC23661
- DOI: 10.1073/pnas.94.22.11935
Item in Clipboard
Mechanical separation of the complementary strands of DNA
Proc Natl Acad Sci U S A.
.
Abstract
We describe the mechanical separation of the two complementary strands of a single molecule of bacteriophage lambda DNA. The 3' and 5' extremities on one end of the molecule are pulled progressively apart, and this leads to the opening of the double helix. The typical forces along the opening are in the range of 10-15 pN. The separation force signal is shown to be related to the local GC vs. AT content along the molecule. Variations of this content on a typical scale of 100-500 bases are presently detected.
Figures
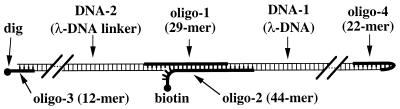
The molecular construction. The DNA to be opened
(DNA-1) and the linker arm (DNA-2) are comprised of double-stranded
λ-phage DNA (or occasionally of multimers of double-stranded
λ-phage DNA). Oligonucleotides (thick lines) are used to introduce
the biotine and dig attachments and to connect covalently DNA-1 and
DNA-2.
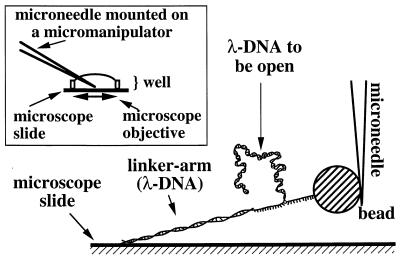
Principle of the force measurement in which a
double-stranded λ-DNA is forced open as the surface is displaced to
the left. (Inset) A plastic ring is glued to the
microscope slide that is coated with antidig. This well was placed on
an inverted microscope. The microneedle was introduced through the free
meniscus.
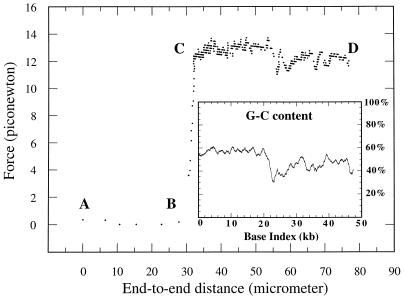
Force (deflection of the calibrated microneedle)
as a function of the end-to-end distance while displacing the well at
an average velocity of 40 nm/s. The end-to-end distance is defined as
the displacement of the well minus the deflection of the microneedle.
The linker arm is a dimer in this particular measurement, and the rise
of force thus occurs ≈32 μm, i.e., twice the crystallographic
length of λ-DNA. The quasi-plateau C to D corresponds to the opening
of the double helix. Going back from D to A (not shown), the two single
strands reannealed, and a new measurement cycle could be engaged.
(Inset) GC content (GC%) averaged over 1000 bp along
the sequence of λ phage DNA from 1 to 48,502 bp.
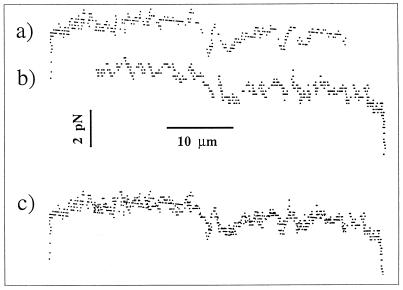
Force vs. end-to-end distance obtained for λ
DNA. Only the part corresponding to the opening has been plotted
(a) and measured with the construction Λ (same as Fig.
3). (b) Signal obtained with the construction
Λ−1, in which the opening starts at index 48,502 rather
than 1; the plot has been reversed (opening occurs from the right to
the left on the figure) so that the signals obtained at a given
location of the sequence are superimposable. In c, the
direct superimposition of a and b is
presented.
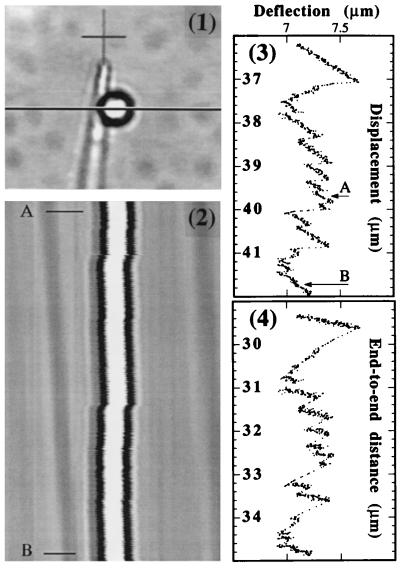
(1) Typical video image of the
bead and the microneedle under the microscope during the DNA opening.
The bead diameter is 2.9 μm. Some surface defects of the glass-slide
appear as scattered gray spots in the background. The well is being
displaced to the right, and the microneedle is bent to the right by the
molecule being opened. A single video line per frame, shown as dark
horizontal line, is sampled at a constant rate of 5 times per second.
From this, a spatio temporal image (2) is constructed.
The total time interval represented in 2 is 96 s
and corresponds to a displacement of the well of 1.9 μm (time
increasing linearly from top to bottom). The two parallel black stripes
rising from the bead image contain the information on the
time-dependent deflection. The displacement of the well appears in the
inclined faint gray stripes arising from the surface defects. The faint
lines that are vertical corresponds to fixed spots (dust/defects in
the optics and camera). In 3, we present the extracted force signal
corresponding to 2. In 4, the deflection vs. end-to-end
distance is plotted for the same region as in 3.
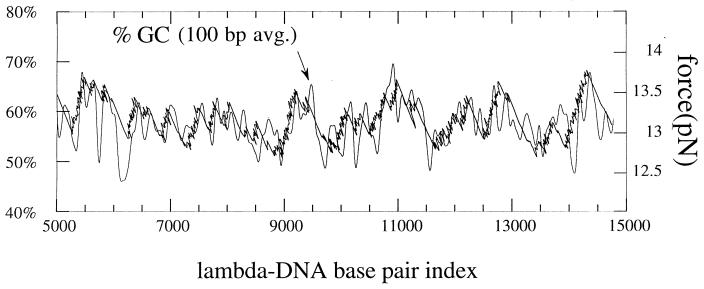
Comparison between the force signal and the
average GC content along a segment from 5000–15,000 bp of the sequence
of λ DNA. Two curves are superimposed: (i) The smooth
curve is the GC% averaged over 100 bases (Gaussian weight with a total
width of 100 bases at 1/e of the maximum height) for the sequence of
λ-DNA. (ii) The second curve is the force measurement
(force vs. end-to-end distance) obtained by mechanical opening
(experimental points have been connected by lines).
Comment in
-
Twist and shout (and pull): molecular chiropractors undo DNA.Proc Natl Acad Sci U S A. 1997 Oct 28;94(22):11770-2. doi: 10.1073/pnas.94.22.11770. Proc Natl Acad Sci U S A. 1997. PMID: 9342311 Free PMC article. No abstract available.
References
Publication types
MeSH terms
Substances
LinkOut - more resources
Full Text Sources
Other Literature Sources
Miscellaneous
