

Origin and evolution of the slime molds (Mycetozoa)
- PMID: 9342353
- PMCID: PMC23686
- DOI: 10.1073/pnas.94.22.12007
Origin and evolution of the slime molds (Mycetozoa)
Abstract
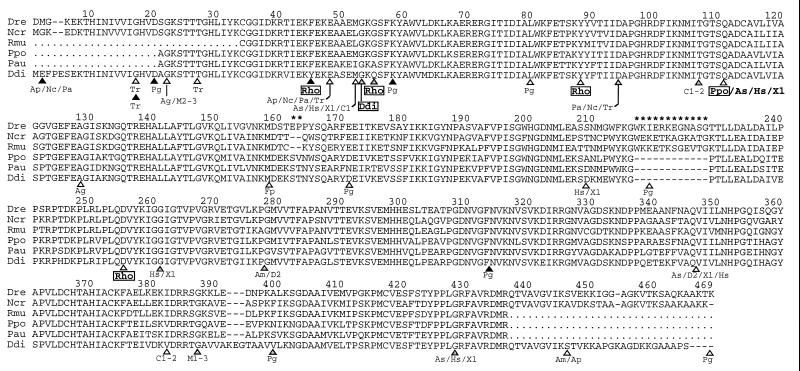
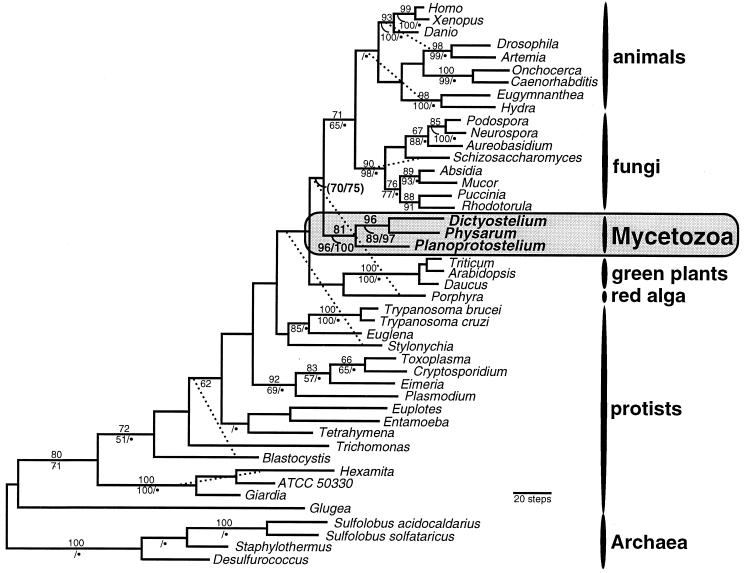
The Mycetozoa include the cellular (dictyostelid), acellular (myxogastrid), and protostelid slime molds. However, available molecular data are in disagreement on both the monophyly and phylogenetic position of the group. Ribosomal RNA trees show the myxogastrid and dictyostelid slime molds as unrelated early branching lineages, but actin and beta-tubulin trees place them together as a single coherent (monophyletic) group, closely related to the animal-fungal clade. We have sequenced the elongation factor-1alpha genes from one member of each division of the Mycetozoa, including Dictyostelium discoideum, for which cDNA sequences were previously available. Phylogenetic analyses of these sequences strongly support a monophyletic Mycetozoa, with the myxogastrid and dictyostelid slime molds most closely related to each other. All phylogenetic methods used also place this coherent Mycetozoan assemblage as emerging among the multicellular eukaryotes, tentatively supported as more closely related to animals + fungi than are green plants. With our data there are now three proteins that consistently support a monophyletic Mycetozoa and at least four that place these taxa within the "crown" of the eukaryote tree. We suggest that ribosomal RNA data should be more closely examined with regard to these questions, and we emphasize the importance of developing multiple sequence data sets.
Figures
Comment in
-
Phosphotyrosine signaling and the single cell:metazoan boundary.Proc Natl Acad Sci U S A. 1997 Oct 28;94(22):11767-9. doi: 10.1073/pnas.94.22.11767. Proc Natl Acad Sci U S A. 1997. PMID: 9342310 Free PMC article. No abstract available.
References
-
- Olive L S, Stoianovitch C. The Mycetozoans. New York: Academic; 1975.
-
- Olive L, Stoianovitch C. Bull Torrey Bot Club. 1960;87:1–20.
-
- Roger A J, Smith M W, Doolittle R F, Doolittle W F. J Eukaryotic Microbiol. 1996;43:475–485. - PubMed
-
- Whittaker R H. Science. 1969;163:150–160. - PubMed
-
- Whittaker R H. Science. 1969;164:857.
Publication types
MeSH terms
Substances
Associated data
- Actions
- Actions
- Actions
- Actions
- Actions
LinkOut - more resources
Full Text Sources
