. 1997 Oct 28;94(22):12106-11.
doi: 10.1073/pnas.94.22.12106.

Evaluating treatment protocols to prevent antibiotic resistance

Affiliations

Evaluating treatment protocols to prevent antibiotic resistance

S Bonhoeffer et al. Proc Natl Acad Sci U S A. .

Abstract

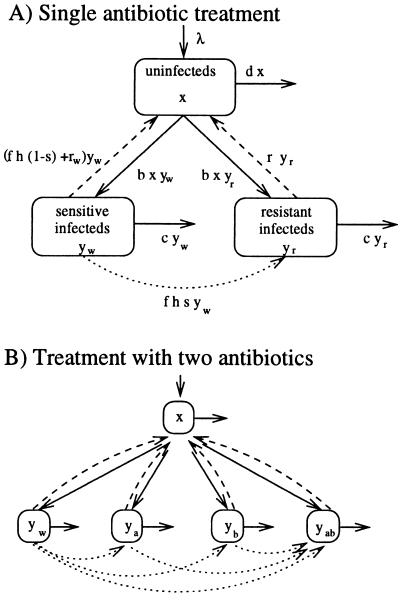
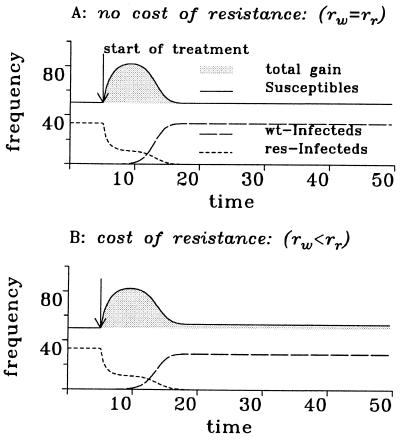
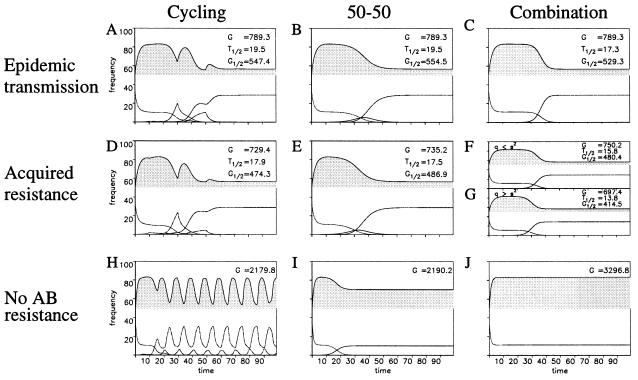
The spread of bacteria resistant to antimicrobial agents calls for population-wide treatment strategies to delay or reverse the trend toward antibiotic resistance. Here we propose new criteria for the evaluation of the population-wide effects of treatment protocols for directly transmitted bacterial infections and discuss different usage patterns for single and multiple antibiotic therapy. A mathematical model suggests that the long-term benefit of single drug treatment from introduction of the antibiotic until a high frequency of resistance precludes its use is almost independent of the pattern of antibiotic use. When more than one antibiotic is employed, sequential use of different antibiotics in the population ("cycling") is always inferior to treatment strategies where, at any given time, equal fractions of the population receive different antibiotics. However, treatment of all patients with a combination of antibiotics is in most cases the optimal treatment strategy.


Figures

Figure 1
Figure 1
(A) Graphical illustration of the single antibiotic treatment model. The variables and parameters are explained in the main text. (B) Multiple antibiotic treatment model: The variables are x for the susceptibles, and yw, ya, ya, and yab for patients infected with wild-type (wt), A-res, B-res, and AB-res bacteria. The model is dx/dt = λ − dxb(yw + ya + yb + yab)x + rwyw + raya + rbyb + rabyab + h(1 − q)fabyw + h(1 − s)((fa + fb)yw + fayb + fbya + fab(ya + yb)); dyw/dt = (bxcrwh(fa + fb + fab))yw; dya/dt = (bxcrah(fb + fab))ya + hsfayw; dyb/dt = (bxcrbh(fa + fab))yb + hsfbyw; dyab/dt = (bxcrab)yab + hs(fab(ya + yb) + fayb + fbya) + qhfabyw. The parameters are rw, ra, rb, and rab, for the recovery rates of wt, A-res, B-res and AB-res infecteds, respectively; fa, fb, and fab, for the fraction of patients treated with antibiotic A, B, or AB; and s and q are the fractions of hosts that become resistant when treated with a single drug or both drugs simultaneously. The parameters fa, fb, and fab reflect the fraction of patients treated with antibiotics, A, B, and AB. (Note that the parameters fa, fb, fab, s, q represent fractions and are therefore restricted to be between 0 and 1. The parameters fa, fb, and fab additionally must fulfill fa + fb + fab ≤ 1. If their sum is smaller than 1, than this reflects that some fraction of the patients are not treated at all.) The equilibrium levels of susceptibles and infecteds are derived in Appendix B1.
Figure 2
Figure 2
Emergence of antibiotic resistance in the patient population. The shaded area reflects the total gain of uninfecteds during treatment. If there is no cost of resistance (Δr = rrrw = 0), then the total gain of uninfecteds is independent of the rate fh at which patients are treated and cured. Hence all treatment protocols result in the same total gain of uninfecteds. If there is a cost of resistance (Δr > 0), then the total gain is maximized if a maximal fraction of patients receive therapy. The parameters of the simulation are given in Appendix C.
Figure 3
Figure 3
Multiple antibiotic treatment policies. The solid, dotted, and dashed lines show the densities of uninfecteds, wt-infecteds and AB-res infecteds, respectively. The dot-dashed lines show the densities of single resistants. The shaded area reflects the total gain of uninfecteds, G. G1/2 is the total gain of uninfecteds before 50% of the infecteds are AB-res. T1/2 is the time necessary until 50% of the infecteds are AB-res. Three treatment strategies (cycling where drugs are alternated every 5 time units, 50-50 treatment, and combination treatment) are compared. In AC we assume that the prevalence or resistance has progressed to a point where the contribution of acquired resistance is negligible to primary resistance (infection by a resistant organism). In DG we assume that resistant infections are initially rare, such that the contribution of acquired resistance is initially numerically important by comparison to the epidemic spread of resistance. In HJ we assume that multiple resistance is not initially present and is not generated during treatment. Measured in terms of the total gain of uninfecteds (or total reduction of infecteds) cycling is always worse that 50-50 treatment and combination therapy is superior to cycling and 50-50 treatment except when q > s2. Note, however, that T1/2 is shorter for combination therapy.

References

    1. Doern G V, Brueggemann A, H P, Holley J, Rauch A M. Antimicrob Agents Chemother. 1996;40:1208–1213. - PMC - PubMed
    1. Cohen M L. Trends Microbiol. 1994;2:422–425. - PubMed
    1. Bloom B R, Murray C J L. Science. 1992;257:1055–1064. - PubMed
    1. Swartz M N. Proc Natl Acad Sci (USA) 1994;91:2420–2427. - PMC - PubMed
    1. Arthur M, Courvalin P. Antimicrob Agents Chemother. 1993;37:1563–1571. - PMC - PubMed

Publication types

Substances