. 1997 Nov 3;139(3):589-99.
doi: 10.1083/jcb.139.3.589.

Targeting of NH2-terminal-processed microsomal protein to mitochondria: a novel pathway for the biogenesis of hepatic mitochondrial P450MT2

Affiliations

Targeting of NH2-terminal-processed microsomal protein to mitochondria: a novel pathway for the biogenesis of hepatic mitochondrial P450MT2

S Addya et al. J Cell Biol. .

Abstract

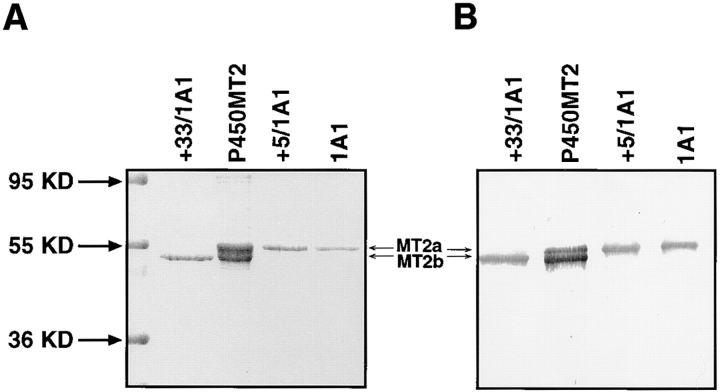
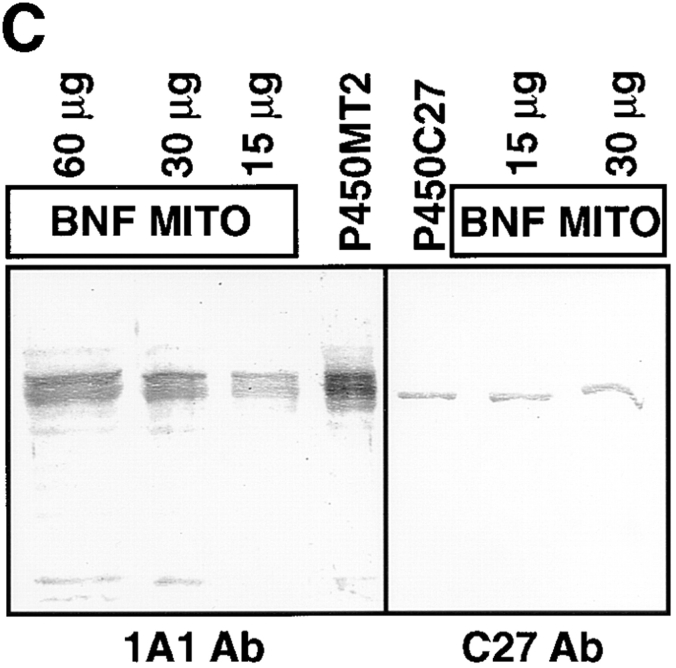
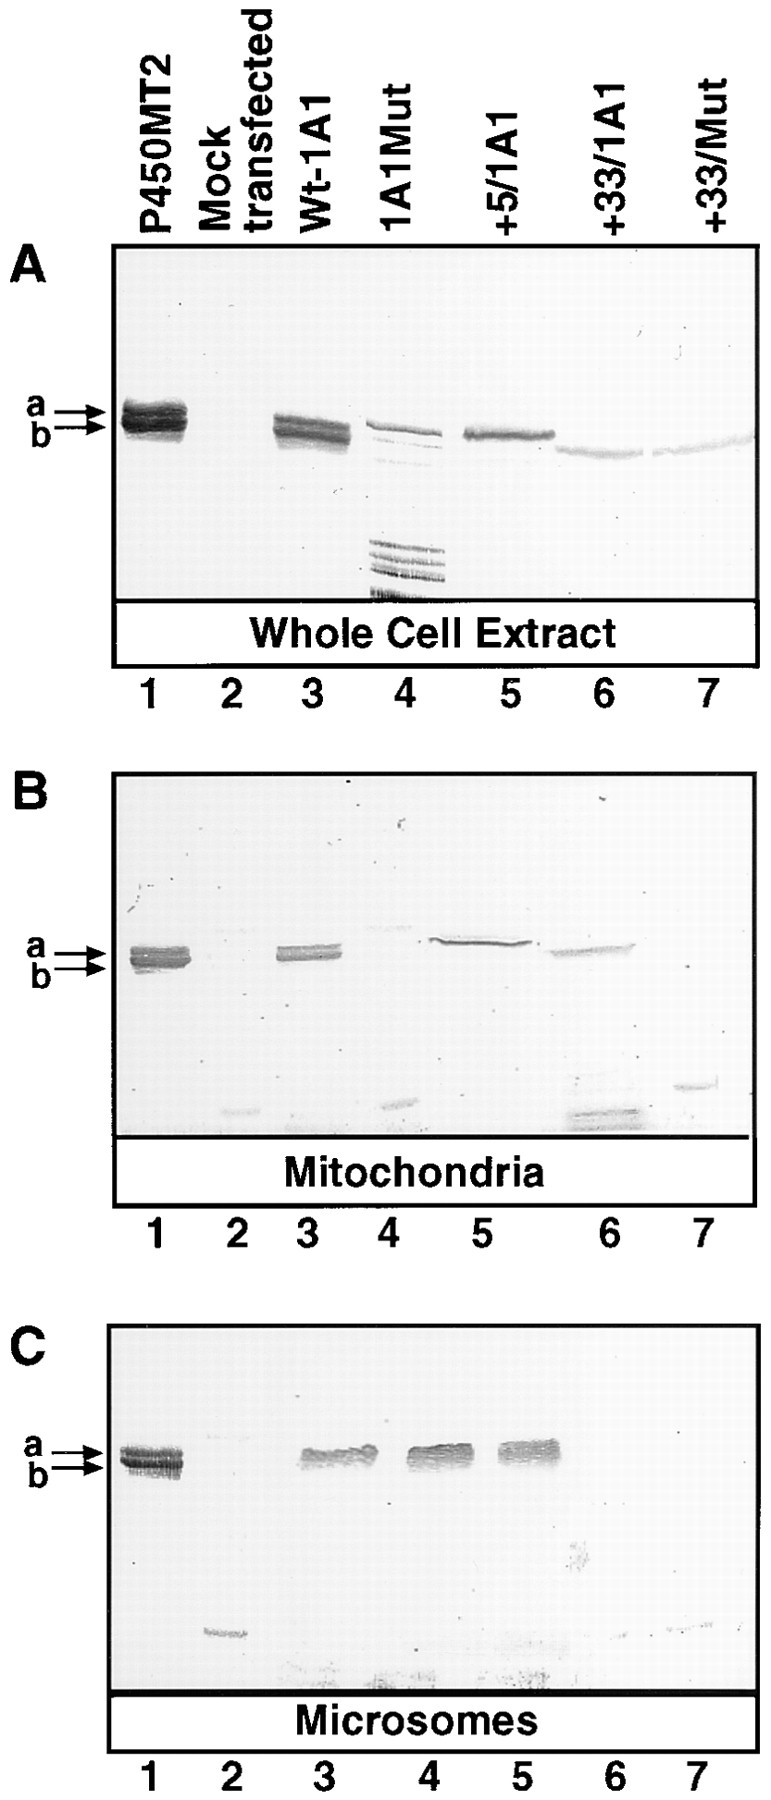
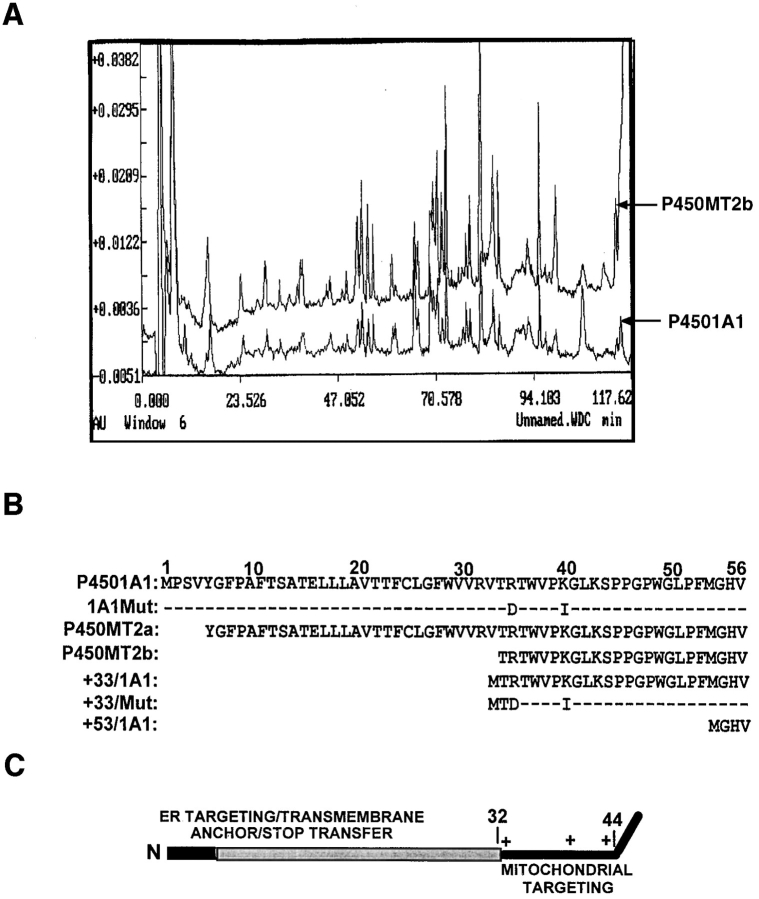
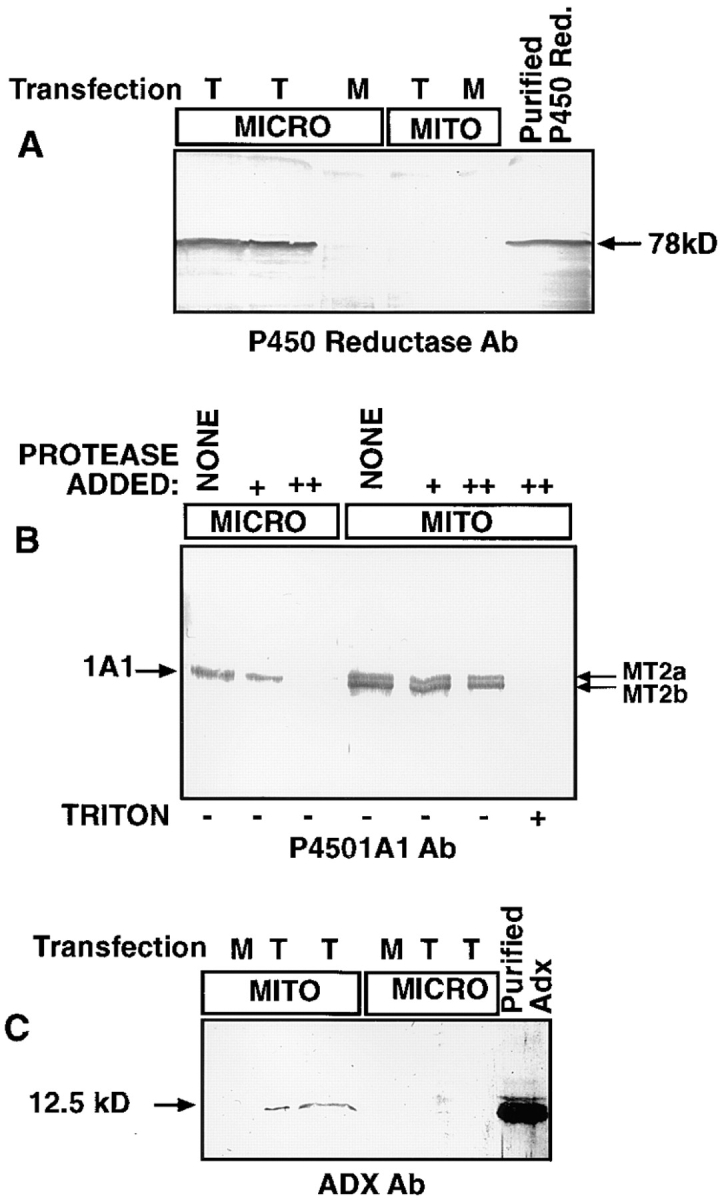
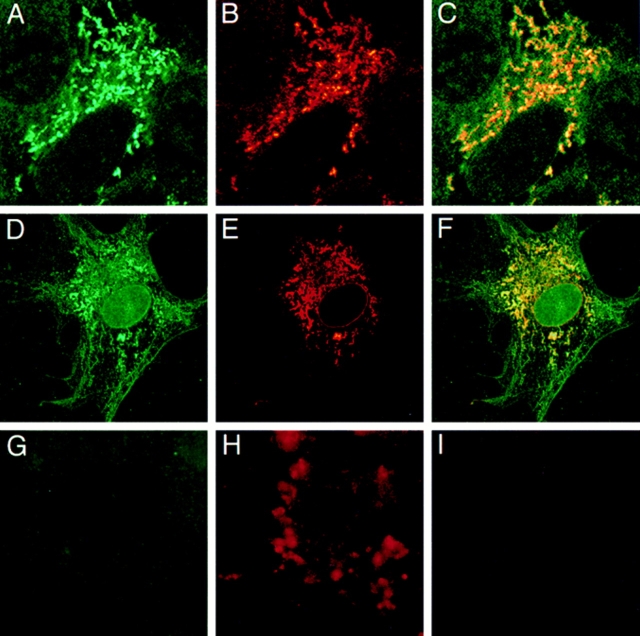
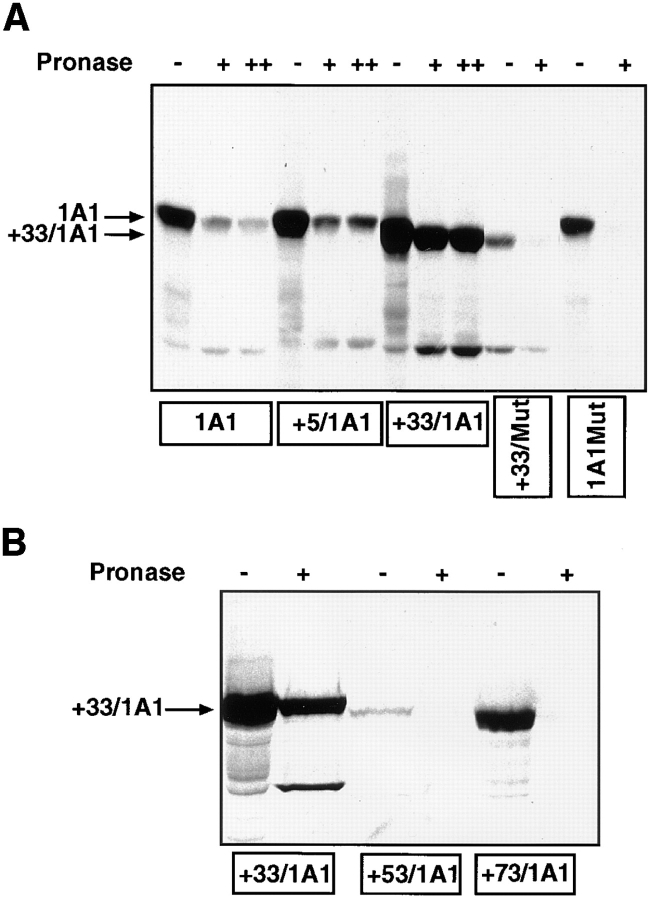
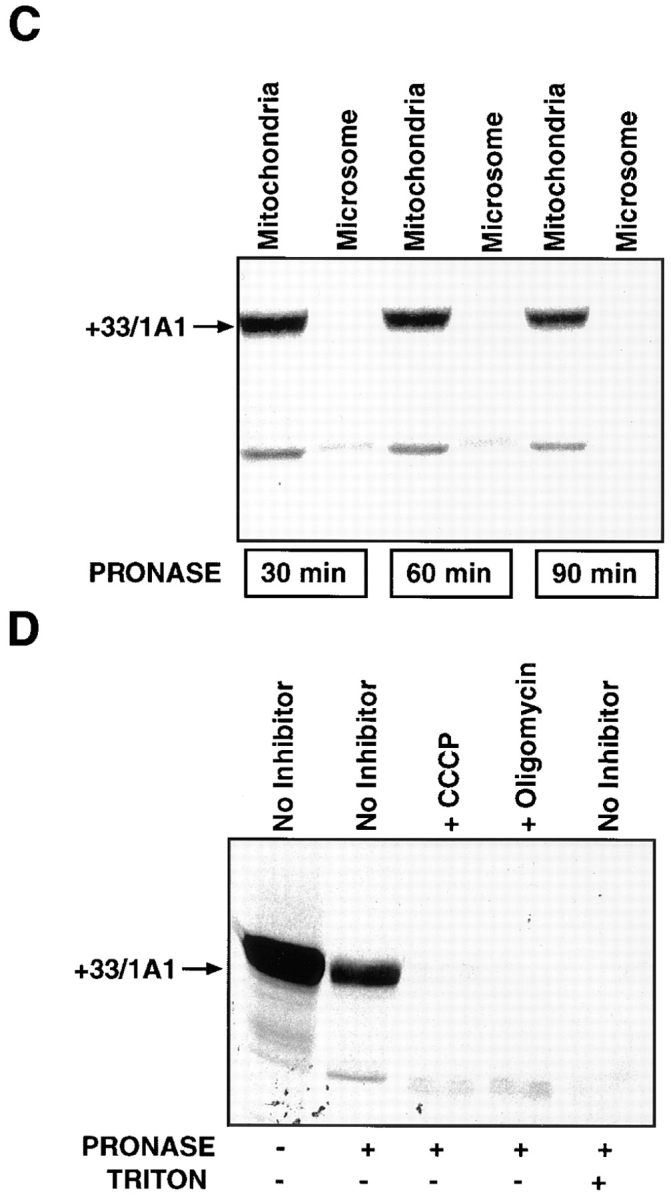
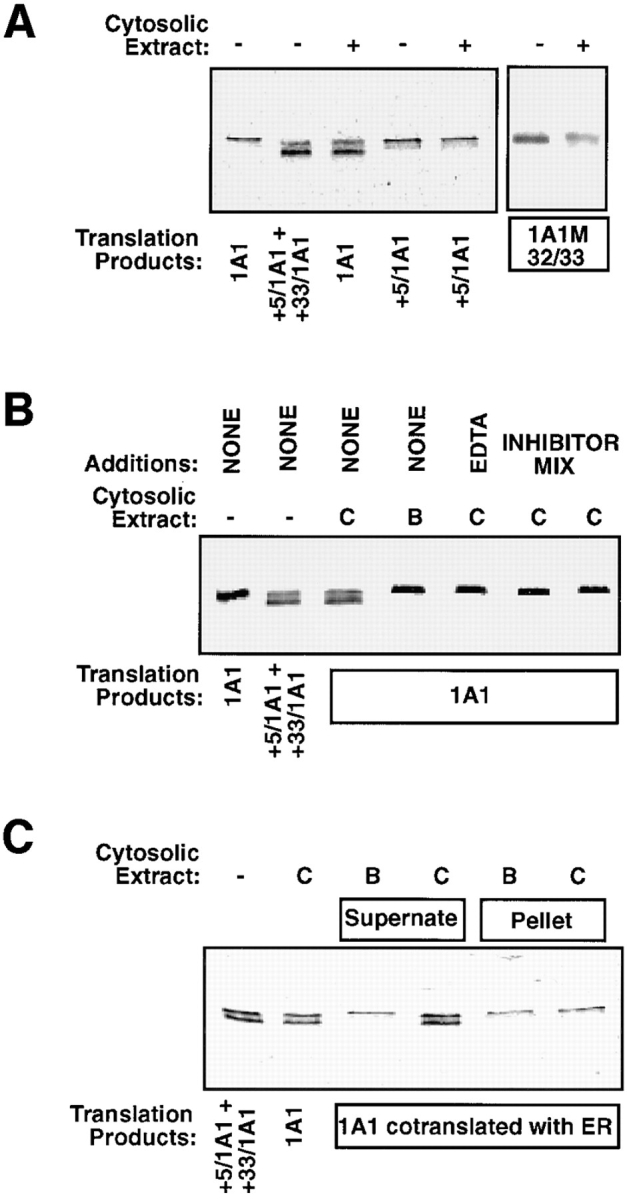
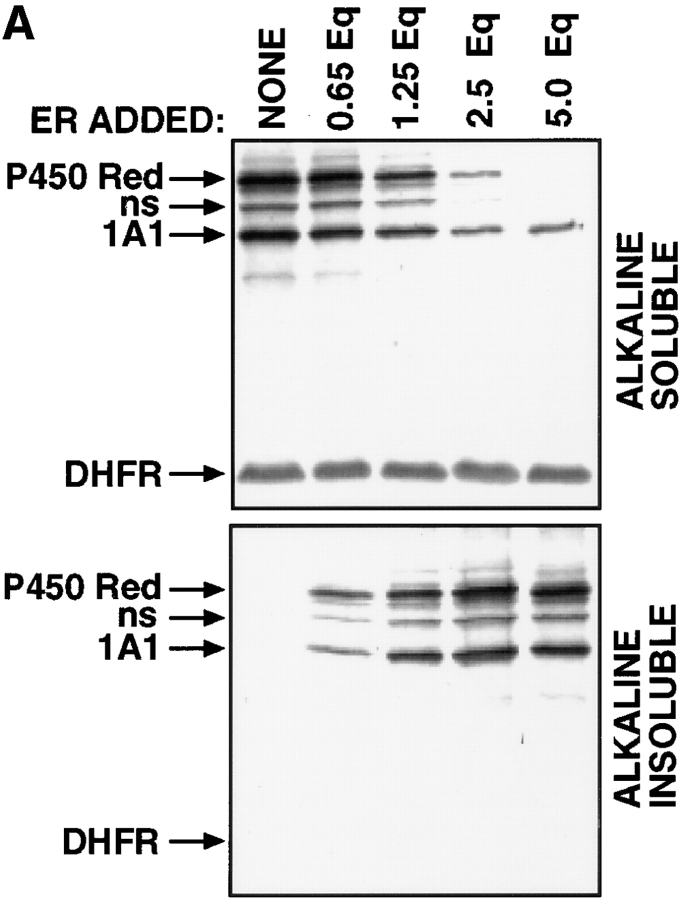
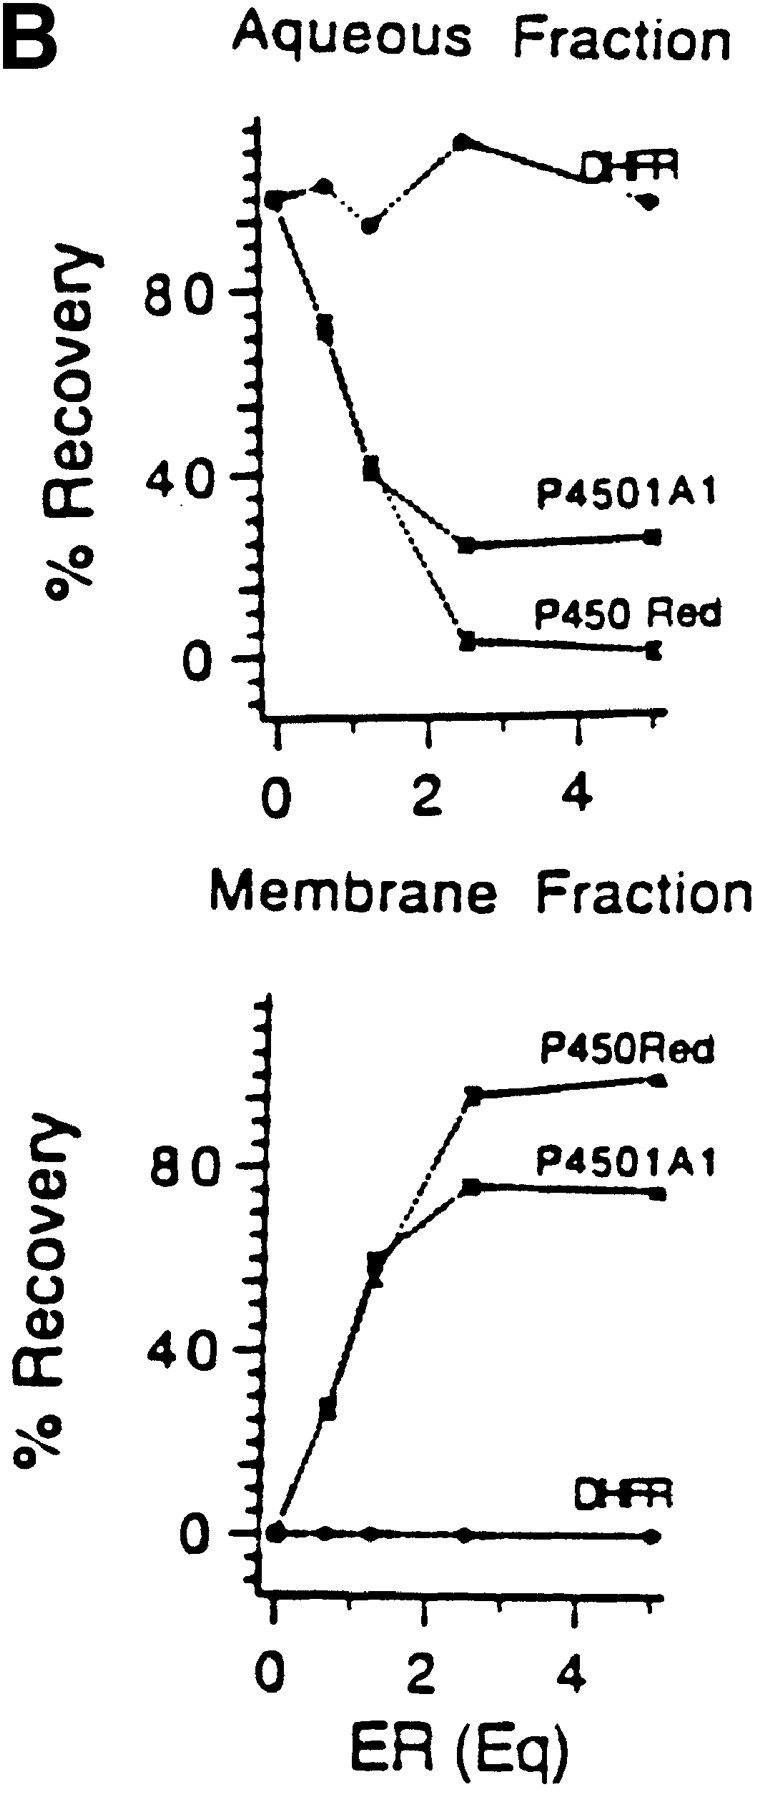
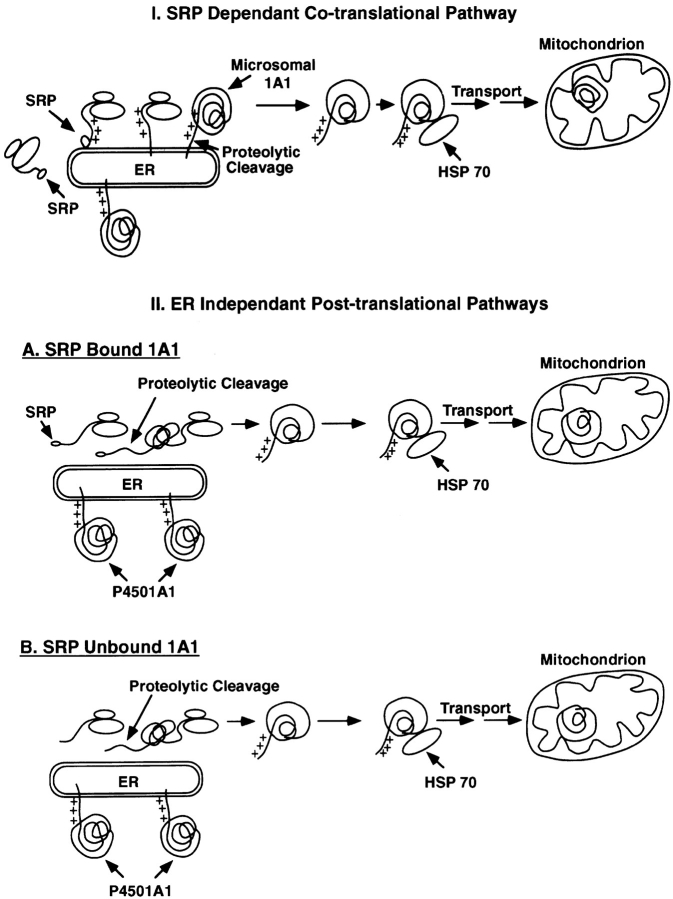
Cytochrome P4501A1 is a hepatic, microsomal membrane-bound enzyme that is highly induced by various xenobiotic agents. Two NH2-terminal truncated forms of this P450, termed P450MT2a and MT2b, are also found localized in mitochondria from beta-naphthoflavone-induced livers. In this paper, we demonstrate that P4501A1 has a chimeric NH2-terminal signal that facilitates the targeting of the protein to both the ER and mitochondria. The NH2-terminal 30-amino acid stretch of P4501A1 is thought to provide signals for ER membrane insertion and also stop transfer. The present study provides evidence that a sequence motif immediately COOH-terminal (residues 33-44) to the transmembrane domain functions as a mitochondrial targeting signal under both in vivo and in vitro conditions, and that the positively charged residues at positions 34 and 39 are critical for mitochondrial targeting. Results suggest that 25% of P4501A1 nascent chains, which escape ER membrane insertion, are processed by a liver cytosolic endoprotease. We postulate that the NH2-terminal proteolytic cleavage activates a cryptic mitochondrial targeting signal. Immunofluorescence microscopy showed that a portion of transiently expressed P4501A1 is colocalized with the mitochondrial-specific marker protein cytochrome oxidase subunit I. The mitochondrial-associated MT2a and MT2b are localized within the inner membrane compartment, as tested by resistance to limited proteolysis in both intact mitochondria and mitoplasts. Our results therefore describe a novel mechanism whereby proteins with chimeric signal sequence are targeted to the ER as well as to the mitochondria.


Figures

Figure 1
Figure 1
Electrophoretic resolution of the two forms of mitochondrial P450MT2. P450s from BNF-induced rat liver mitochondria and microsomes and bacterially expressed +5/ 1A1 and +33/1A1 were purified, and ∼1–2 μg of protein sample in each case was resolved by electrophoresis on a 14–16% gradient SDS-polyacrylamide gel. (A) Coomassie Blue stained pattern. (B) A companion gel was subjected to Western blot analysis using 20 μg/ml of affinity-purified P4501A1 antibody. (C) The purified P450MT2 was compared with antibody-reactive proteins from BNF-induced liver mitochondria. Indicated amounts of mitochondria from BNF-induced liver and 2 μg of P450MT2 were subjected to electrophoretic resolution and Western blot analysis using either affinity-purified P4501A1 antibody or mAb against P450c27 (Addya et al., 1991), as indicated.
Figure 1
Figure 1
Electrophoretic resolution of the two forms of mitochondrial P450MT2. P450s from BNF-induced rat liver mitochondria and microsomes and bacterially expressed +5/ 1A1 and +33/1A1 were purified, and ∼1–2 μg of protein sample in each case was resolved by electrophoresis on a 14–16% gradient SDS-polyacrylamide gel. (A) Coomassie Blue stained pattern. (B) A companion gel was subjected to Western blot analysis using 20 μg/ml of affinity-purified P4501A1 antibody. (C) The purified P450MT2 was compared with antibody-reactive proteins from BNF-induced liver mitochondria. Indicated amounts of mitochondria from BNF-induced liver and 2 μg of P450MT2 were subjected to electrophoretic resolution and Western blot analysis using either affinity-purified P4501A1 antibody or mAb against P450c27 (Addya et al., 1991), as indicated.
Figure 3
Figure 3
Targeting of P4501A1 to the microsomal and mitochondrial compartments in vivo in COS cells. COS cells were transfected with 10 μg/plate of the various wild type, mutant cDNA constructs, or pCMV4 vector without any insert (Mock transfected), together with 2 μg/plate of CMV β-galactosidase plasmid. Cells from 8–10 companion plates were used to isolate the mitochondrial and microsomal membrane fractions or whole-cell extracts as described in Materials and Methods. 2 μg of purified P450MT2 and 25 μg protein from each of the cell fractions were resolved by electrophoresis on 14–16% gradient polyacrylamide gels and were subjected to Western blot analysis using the affinity- purified P4501A1 antibody.
Figure 2
Figure 2
The sequence properties of P450MT2. (A) 3–6 μg of P450MT2 and 1A1 proteins were resolved as described in Fig. 1 and transferred to PVDF membranes. Bands corresponding to P450MT2b and 1A1 were excised and subjected to proteolytic digestion and HPLC analysis. The absorbency profiles at 260 nm are presented. (B) The microsomal P4501A1 and mitochondrial P450MT2a and MT2b protein bands were transblotted to PVDF membrane and sequenced by Edman degradation as described in Materials and Methods. The nature of 1A1Mut and +33/Mut cDNA constructs carrying R34D and K39I substitutions, as well as NH2-terminal deletion clones are indicated. (C) The chimeric signal properties of P4501A1 are indicated. The NH2-terminal-most luminal region is indicated in dark, and the transmembrane region is indicated in gray. The sequence 33–44 of the protein containing three basic amino acid residues at positions 34, 39, and 42 is predicted to function as a putative mitochondrial-targeting sequence.
Figure 4
Figure 4
Specificity of the mitochondrial targeting of P4501A1 under in vivo conditions. In lanes marked T, COS cells were transfected with full-length 1A1 construct (10 μg/plate) and cotransfected with 10 μg/ plate of the human P450 reductase cDNA and 5 μg/ plate of bovine Adx cDNA constructs. In lanes marked M, cells were mock transfected with equivalent amount of pCMV-4 plasmid DNA. Mitochondrial and microsomal fractions were isolated as described in Materials and Methods, and 20 μg of microsomal and 30 μg of mitochondrial proteins were resolved on a 14–16% gradient polyacrylamide gel and were subjected to Western blot analysis using the indicated antibodies. (A and C) Mitochondrial and microsomal fractions in duplicate lanes were derived from two separate transfections. (B) Microsomal and mitochondrial proteins were digested with 100 μg/ml (+) or 200 μg/ml of reaction (++) with pronase for 30 min on ice before electrophoresis.
Figure 5
Figure 5
Subcellular localization of P4501A1 and +33/1A1 by immuno-fluorescence microscopy. COS cells were grown on coverslips and transfected with +33/1A1 cDNA (top), intact 1A1cDNA (middle), or mock transfected with pCMV-4 vector without insert (bottom). Cells in A–H were double immunostained with rabbit polyclonal antibody to P4501A1 and mouse mAb to COX subunit I protein, and were developed with FITC-conjugated anti–rabbit IgG and Texas red–conjugated anti– mouse IgG, respectively. Cells in I represent control without added primary antibody, developed with Texas red–conjugated IgG as in H. A, D, and G represent FITC staining, showing patterns of 1A1 protein distribution. B, E, and H represent Texas red staining showing COX subunit I patterns. C and F represent superimposed patterns of A and B and D and E, respectively. The micrograph in H was scanned at a threefold higher magnification compared to those in the other panels.
Figure 6
Figure 6
In vitro transport of P4501A1 into mitochondria. 35S-labeled in vitro translation products were programmed with the various cDNA constructs in a transcription-linked reticulocyte lysate system, and were used for in vitro transport in isolated rat liver mitochondria, as described in Materials and Methods. In each case, 200 μg of mitochondrial protein was used for electrophoresis, and the gels were subjected to fluorography. (A) 35S-labeled, full-length 1A1, +5/1A1, +33/1A1, +33/Mut, and 1A1Mut proteins were used for the in vitro transport. Faster migrating bands in some of the lanes probably represent proteolytic fragments generated as a result of endogenous mitochondrial or externally added protease action. A single + at the top of lanes represents treatment with 125 μg pronase, and ++ represents treatment with 250 μg pronase/ml of reaction. (B) In vitro transport of +33/1A1, +53/1A1, and +73/ 1A1 proteins into isolated rat liver mitochondria. Protease treatment was carried out using 125 μg of pronase/ml of reaction. (C) The specificity of the in vitro transport system was tested using 35S labeled +33/1A1 protein, as well as mitochondrial and microsomal fractions isolated from rat liver. Incubations with mitochondrial or microsomal membranes were carried out as described in A. Protease digestion was carried out for various time periods as indicated, using 125 μg pronase/ml of reaction. (D) Effects of mitochondrial inhibitors on the in vitro protein transport were tested using 35S-labeled +33/1A1 protein. The reaction mixtures were preincubated with or without added inhibitors (50 μM CCCP or 50 μM oligomycin) at 25°C for 10 min before initiating the in vitro transport by adding the 35S-labeled +33/1A1 translation product. Triton X-100 was added to the sample marked +Triton at a final concentration of 0.3% at the start of protease digestion. Protease digestion was carried out for 60 min with 125 μg pronase/ml of reaction. Radioactivity in −Pronase samples in the case of 1A1, +5/1A1, and +33/1A1 proteins represent ∼50–60% of the input counts, indicating efficient binding to mitochondria. The mutant proteins showed varied levels of binding as follows: +33/Mut = 10%, 1A1Mut and +73/1A1 = 30%, and +53/1A1 = 4% of input.
Figure 6
Figure 6
In vitro transport of P4501A1 into mitochondria. 35S-labeled in vitro translation products were programmed with the various cDNA constructs in a transcription-linked reticulocyte lysate system, and were used for in vitro transport in isolated rat liver mitochondria, as described in Materials and Methods. In each case, 200 μg of mitochondrial protein was used for electrophoresis, and the gels were subjected to fluorography. (A) 35S-labeled, full-length 1A1, +5/1A1, +33/1A1, +33/Mut, and 1A1Mut proteins were used for the in vitro transport. Faster migrating bands in some of the lanes probably represent proteolytic fragments generated as a result of endogenous mitochondrial or externally added protease action. A single + at the top of lanes represents treatment with 125 μg pronase, and ++ represents treatment with 250 μg pronase/ml of reaction. (B) In vitro transport of +33/1A1, +53/1A1, and +73/ 1A1 proteins into isolated rat liver mitochondria. Protease treatment was carried out using 125 μg of pronase/ml of reaction. (C) The specificity of the in vitro transport system was tested using 35S labeled +33/1A1 protein, as well as mitochondrial and microsomal fractions isolated from rat liver. Incubations with mitochondrial or microsomal membranes were carried out as described in A. Protease digestion was carried out for various time periods as indicated, using 125 μg pronase/ml of reaction. (D) Effects of mitochondrial inhibitors on the in vitro protein transport were tested using 35S-labeled +33/1A1 protein. The reaction mixtures were preincubated with or without added inhibitors (50 μM CCCP or 50 μM oligomycin) at 25°C for 10 min before initiating the in vitro transport by adding the 35S-labeled +33/1A1 translation product. Triton X-100 was added to the sample marked +Triton at a final concentration of 0.3% at the start of protease digestion. Protease digestion was carried out for 60 min with 125 μg pronase/ml of reaction. Radioactivity in −Pronase samples in the case of 1A1, +5/1A1, and +33/1A1 proteins represent ∼50–60% of the input counts, indicating efficient binding to mitochondria. The mutant proteins showed varied levels of binding as follows: +33/Mut = 10%, 1A1Mut and +73/1A1 = 30%, and +53/1A1 = 4% of input.
Figure 7
Figure 7
Processing of P4501A1 by a cytosolic endoprotease. (A) P4501A1, +33/1A1, and 1A1M32/33 (V32A and T33I) translation products in reticulocyte lysate (25 μl) were incubated with 15 μg of (NH4)2SO4-fractionated rat liver cytosolic protein. Incubation was carried out for 30 min at 30°C, and 3-μl aliquots each were electrophoresed on a 14–16% gradient SDS– polyacrylamide gel. A mixture of 35S-labeled +5/1A1 and +33/1A1 were run as markers. (B) P4501A1 translation product was incubated with control cytosolic extract (C) or extract incubated at 95°C for 5 min (B) in the presence or absence of added EDTA (5 mM) or protein inhibitor mix (to a final concentration of 1 mM PMSF and 20 μg/ml each of leupeptin, pepstatin, and chymostatin), as described in Materials and Methods. The incubation and electrophoresis conditions were as described in A. (C) The effects of membrane association of P4501A1 on the processing activity of the cytosolic protein extract was tested. 1A1 protein was translated in the presence of added canine pancreatic ER (2.5 Eq/50 μl reaction), and the membrane-bound fraction (pellet) was isolated by centrifugation over a layer of 0.5 M sucrose containing 100 mM KCl, 50 mM Hepes, pH 7.4, and 5 mM MgOAc2 at 100,000 g for 30 min. The soluble fraction remaining over the sucrose cushion was aspirated and used as the supernate fraction. Details of incubation with the control and heated cytosolic protein fractions were as described in A.
Figure 8
Figure 8
Extent of ER membrane targeting of P4501A1 under in vitro conditions. (A) P4501A1, P450 reductase, and DHFR were cotranslated in rabbit reticulocyte lysate in the presence or absence of unwashed canine pancreatic ER. The reaction mixtures were extracted with 0.1 M Na2CO3, pH 11.5, and the alkaline-soluble and -insoluble fractions were recovered and concentrated as described recently (Anandatheerthavarada et al., 1997). Protein fractions equivalent of 5 μl of initial reaction mixture in each case were subjected to electrophoresis and autoradiography. (B) The gel patterns for the alkaline-soluble and -insoluble fractions in A were quantitated in a PhosphorImager to determine the percentage of recovery in the membrane integral (Membrane Fraction) and extrinsic (Aqueous Fraction) fractions, respectively. Values represent the average of two experiments.
Figure 8
Figure 8
Extent of ER membrane targeting of P4501A1 under in vitro conditions. (A) P4501A1, P450 reductase, and DHFR were cotranslated in rabbit reticulocyte lysate in the presence or absence of unwashed canine pancreatic ER. The reaction mixtures were extracted with 0.1 M Na2CO3, pH 11.5, and the alkaline-soluble and -insoluble fractions were recovered and concentrated as described recently (Anandatheerthavarada et al., 1997). Protein fractions equivalent of 5 μl of initial reaction mixture in each case were subjected to electrophoresis and autoradiography. (B) The gel patterns for the alkaline-soluble and -insoluble fractions in A were quantitated in a PhosphorImager to determine the percentage of recovery in the membrane integral (Membrane Fraction) and extrinsic (Aqueous Fraction) fractions, respectively. Values represent the average of two experiments.
Figure 9
Figure 9
Models for the biogenesis of P450MT2.

References

    1. Addya S, Zheng YM, Shayiq RM, Fan J, Avadhani NG. Characterization of a female-specific hepatic mitochondrial cytochrome P-450 whose steady-state level is modulated by testosterone. Biochemistry. 1991;30:8323–8330. - PubMed
    1. Anandatheerthavarada HK, Addya S, Dwivedi RS, Biswas G, Mullick J, Avadhani NG. Localization of multiple forms of inducible cytochromes P450 in rat liver mitochondria: immunological characteristics and patterns of xenobiotic substrate metabolism. Arch Biochem Biophys. 1997;339:136–150. - PubMed
    1. Andersson DJ, Mostov KE, Blobel G. Mechanisms of integration of de novo-synthesized polypeptides into membranes: signal recognition particle is required for integration into microsomal membranes of calcium ATPase of lens MP26 but not of cytochrome b5 . Proc Natl Acad Sci USA. 1983;80:7249–7253. - PMC - PubMed
    1. Andersson S, Davis DL, Dahlback H, Jomvall H, Russell DW. Cloning, structure, and expression of the mitochondrial cytochrome P-450 sterol 26-hydroxylase, a bile acid biosynthetic enzyme. J Biol Chem. 1989;264:8222–8229. - PubMed
    1. Bar-Nun S, Kreibich G, Adesnik M, Alterman L, Negishi M, Sabatini DD. Synthesis and insertion of cytochrome P-450 into endoplasmic reticulum membranes. Proc Natl Acad Sci USA. 1980;77:965–969. - PMC - PubMed

Publication types

MeSH terms

Substances