. 1997 Nov;110(5):579-89.
doi: 10.1085/jgp.110.5.579.

Correlation between charge movement and ionic current during slow inactivation in Shaker K+ channels

Affiliations

Correlation between charge movement and ionic current during slow inactivation in Shaker K+ channels

R Olcese et al. J Gen Physiol. 1997 Nov.

Abstract

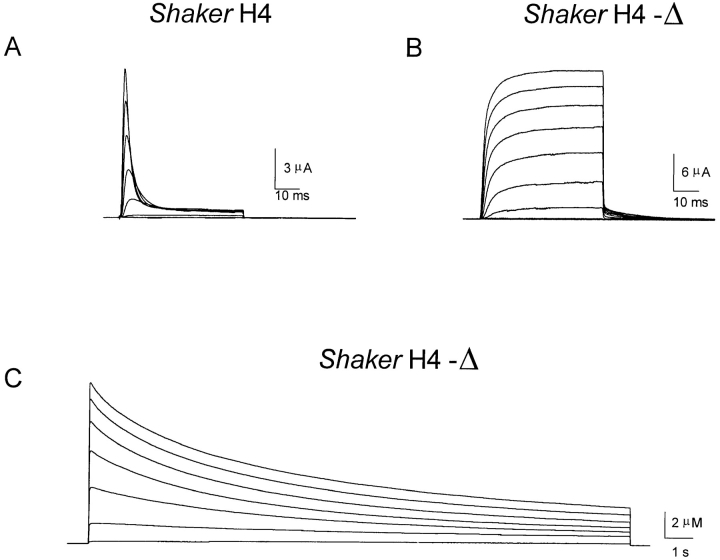
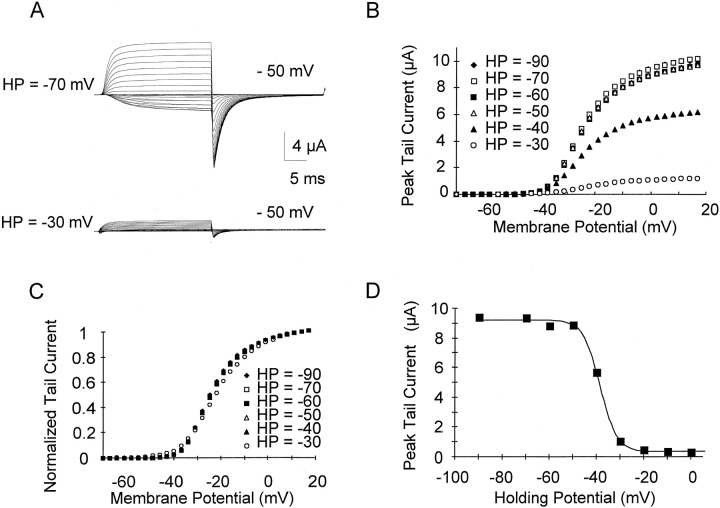
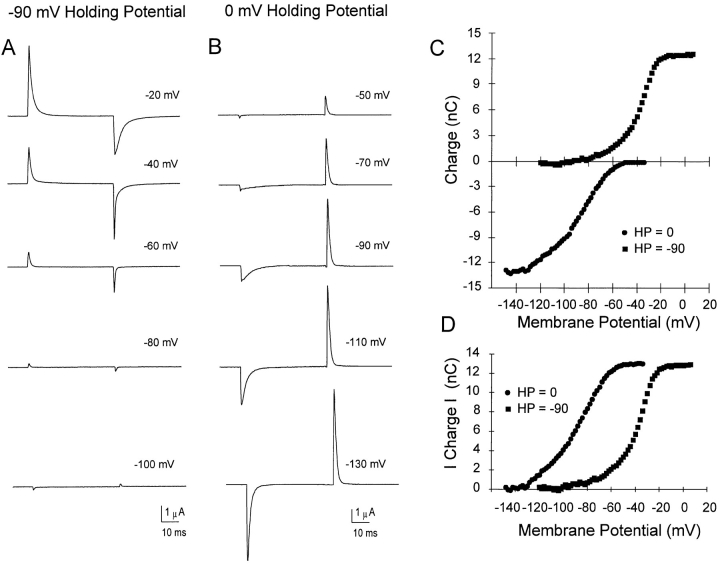
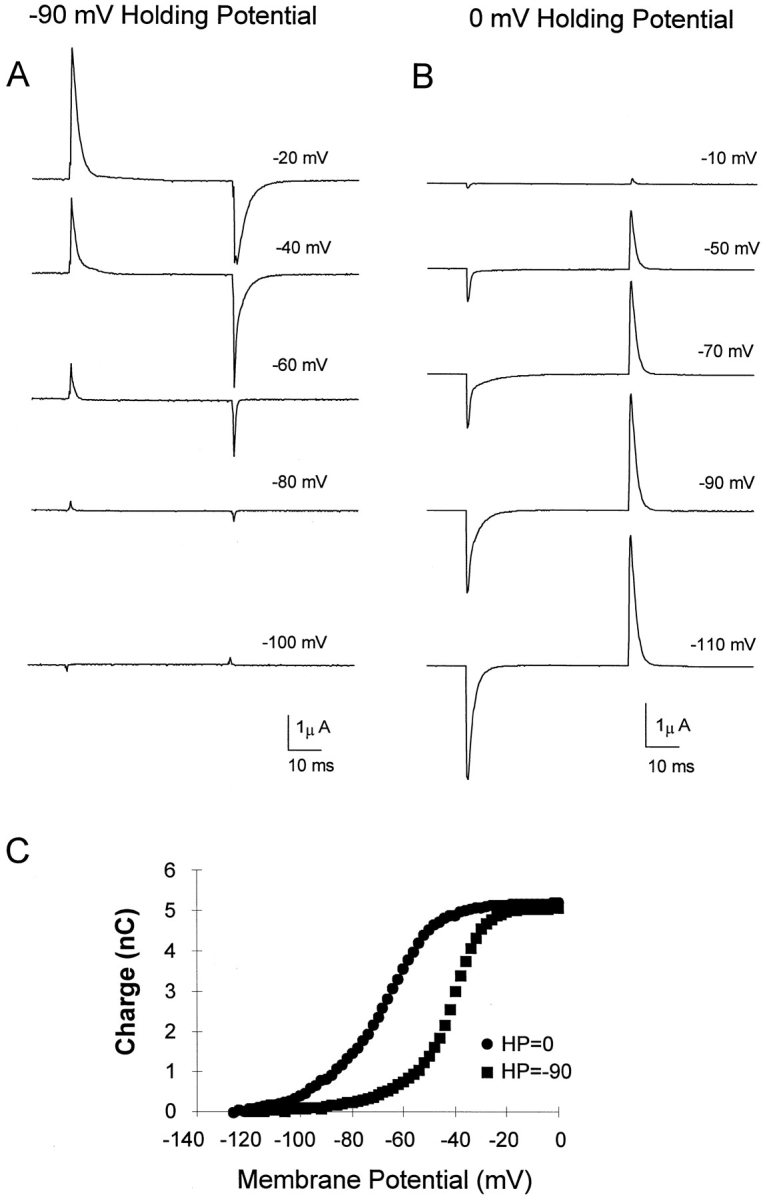
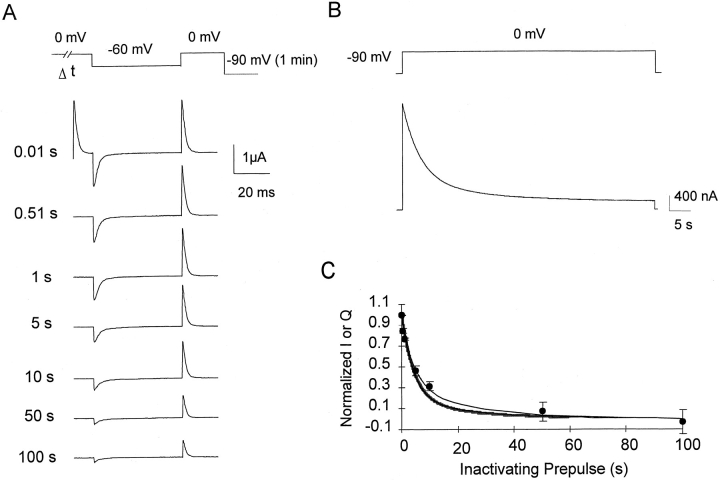
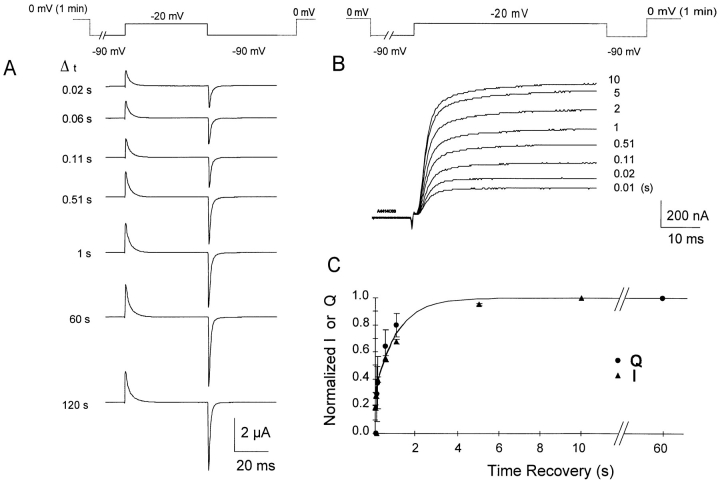
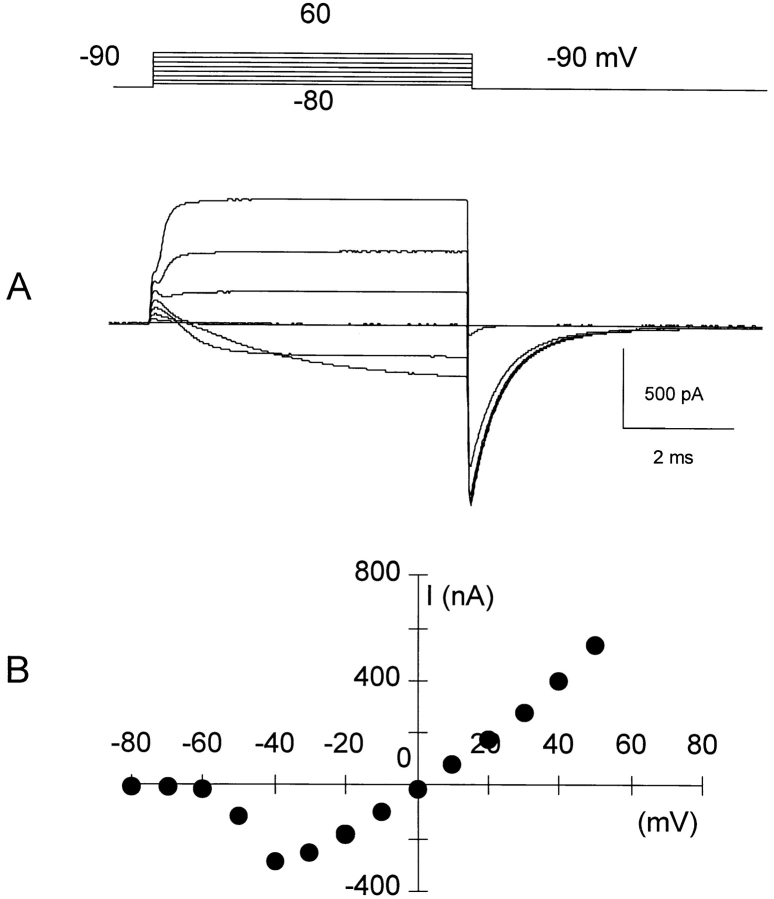
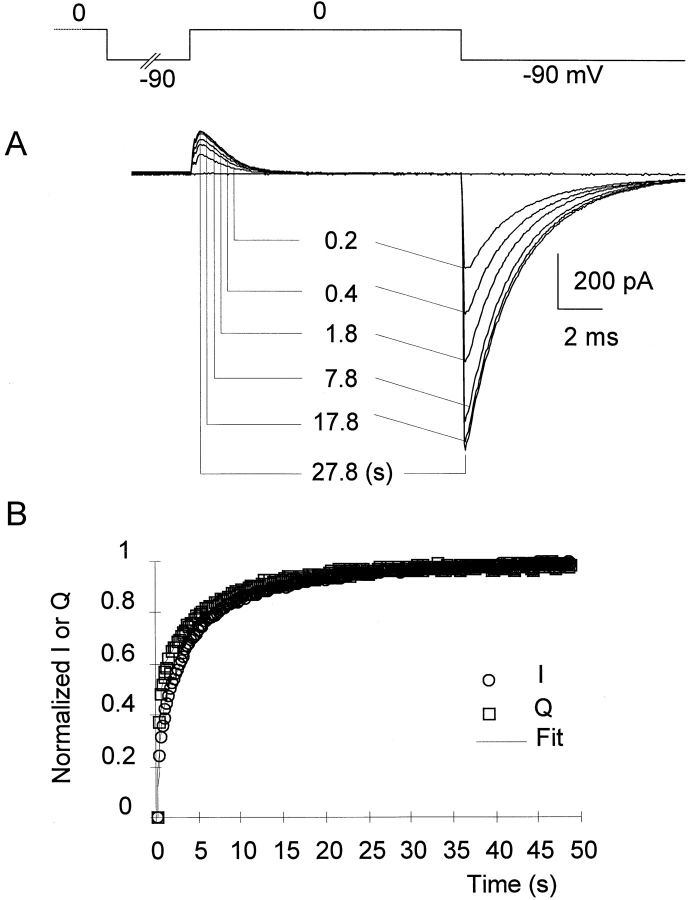
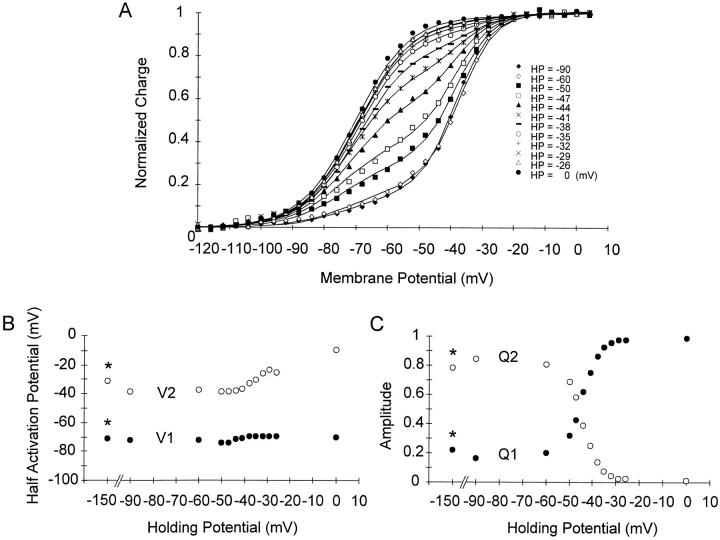
Prolonged depolarization induces a slow inactivation process in some K+ channels. We have studied ionic and gating currents during long depolarizations in the mutant Shaker H4-Delta(6-46) K+ channel and in the nonconducting mutant (Shaker H4-Delta(6-46)-W434F). These channels lack the amino terminus that confers the fast (N-type) inactivation (Hoshi, T., W.N. Zagotta, and R.W. Aldrich. 1991. Neuron. 7:547-556). Channels were expressed in oocytes and currents were measured with the cut-open-oocyte and patch-clamp techniques. In both clones, the curves describing the voltage dependence of the charge movement were shifted toward more negative potentials when the holding potential was maintained at depolarized potentials. The evidences that this new voltage dependence of the charge movement in the depolarized condition is associated with the process of slow inactivation are the following: (a) the installation of both the slow inactivation of the ionic current and the inactivation of the charge in response to a sustained 1-min depolarization to 0 mV followed the same time course; and (b) the recovery from inactivation of both ionic and gating currents (induced by repolarizations to -90 mV after a 1-min inactivating pulse at 0 mV) also followed a similar time course. Although prolonged depolarizations induce inactivation of the majority of the channels, a small fraction remains non-slow inactivated. The voltage dependence of this fraction of channels remained unaltered, suggesting that their activation pathway was unmodified by prolonged depolarization. The data could be fitted to a sequential model for Shaker K+ channels (Bezanilla, F., E. Perozo, and E. Stefani. 1994. Biophys. J. 66:1011-1021), with the addition of a series of parallel nonconducting (inactivated) states that become populated during prolonged depolarization. The data suggest that prolonged depolarization modifies the conformation of the voltage sensor and that this change can be associated with the process of slow inactivation.


Figures

Figure 10
Figure 10
Minimum model fitting the main properties of Shaker H4-Δ K + channel. (A) Modified sequential model (Bezanilla et al., 1994) with an additional eight inactivated (I) states. Steady state and kinetic properties were fitted simultaneously to this model. (B) The result from the fitting is given for the G -V curves obtained from −90 and 0 mV HP and (C) for the charge movement measured from holding potentials −90, −41, and 0 mV. The fit (thin line) for the time course of the inactivation of the ionic current at 0 mV is shown in D. The value of the parameters used were: equilibrium constants: K 0 = 0.00093, K1 = 0.03559, K2 = 0.03649, K3 = 0.1912; valences (e0): z0 = 2.55, z1 = 2.01, z2 = 2.87, z3 = 1.27; inactivation rates (s−1): γ = 0.00026, δ = 4.22 × 10⁻⁶; interaction energy (kT units): W = 2.427.
Figure 1
Figure 1
N- and C-type inactivation in Shaker channels. (A) Shaker H4: pulses from −60 to 10 mV in 10-mV steps. Note the fast decay of the K+ current due to the N-type inactivation. (B) Shaker H4-Δ: pulses from −80 to 30 mV in 10-mV steps. The deletion of the amino acids 6–46 (Shaker H4-Δ) completely removes the fast inactivating properties of the channel. (C) Shaker H4-Δ: long pulses (18 s) from −40 to 20 mV in 10-mV steps. Long depolarizing pulses make evident the presence of a slow inactivation process. COVG technique, external isotonic Na-MES.
Figure 2
Figure 2
Steady state inactivation properties of Shaker H4-Δ. (A) Effect of the HP (−70 and −30 mV) on K+ currents recorded with the COVG technique in isotonic K-MES. Pulses between −70 and 17 mV in 3-mV steps from the tested HP were applied. Tail currents were measured at the end of these pulses at a repolarization potential to −50 mV. The oocyte was maintained at each holding potential for 1 min before running the stimulating protocol with low frequency stimulating pulses to prevent their effect on the inactivation (e.g., a pulse every 1 s at −70 mV and every 5 s at 0 mV HPs). Linear components were subtracted after the stimulating run with P/1 from a subtracting holding potential 70 mV more negative than the tested HP and were between −140 and −53 mV with 3-mV increments. (B) G-V curves with the protocol shown in A from the same oocyte at different HPs: ♦, −90; □, −70; ▪, −60; ▵, −50; ▴, −40; ○, −30 mV. (C) Normalized G-V curves. (D) Steady state inactivation curve obtained from tail current amplitude at −50 mV after a depolarizing pulse to −1 mV. Experimental points were fitted to G m = G min + G max/{1 + exp[−z(V 1/2 V m)F/RT]}. The fitted values were: G max = 0.17 mS, G min = 0.007 mS, V 1/2 = −38.5 mV and z = 7.2.
Figure 3
Figure 3
Gating currents from −90 and 0 mV HPs in the conducting Shaker Δ. The oocyte interior was perfused with isotonic NMG-MES up to the complete elimination of K+ currents. The external solution was isotonic NMG-MES Ca-(MES)2. Unsubtracted gating currents; linear components were analogically compensated with the amplifier transient cancellation at 20 mV HP. (A and B) Current traces from −90 and 0 mV HP, respectively. The cell was maintained at 0 mV HP for 1 min; pulse stimulation was every 1 s at 0 mV and every 0.5 s at −90 mV HP. (C) Q-V curves obtained by integrating the ON gating currents to different test potentials from −90 (▪) and 0 (•) mV HP. (D) Q-V curves from C replotted defining Q = 0 at the extreme negative potential for both HPs. The total charge moved is the same at both HPs, but holding the membrane potential at 0 mV induces an ∼50-mV shift to more negative potentials of the Q-V curve.
Figure 4
Figure 4
Gating currents from −90 and 0 mV HP in the nonconducting mutant Shaker Δ-W434F. Same protocol and ionic conditions as in Fig. 3, A and B. Unsubtracted gating currents from −90 and 0 mV HP, respectively. (C) Q-V curve with the absolute charge values. The total charge moved is the same at both HPs. Holding the membrane potential at 0 mV induces an ∼25-mV shift to the more negative potential of the Q-V curve.
Figure 5
Figure 5
Correlation between the time course of installation of C-type inactivation and time course of changes in charge movement. (A) Shaker H4-Δ-W434F upper trace is the pulse protocol, remaining traces are unsubtracted gating currents. Linear components were analogically compensated with the amplifier transient cancellation at 20 mV HP. Numbers preceding the traces are the duration of the conditioning pulse to 0 mV. The −90 mV HP was held for 1 min between each stimulating pulse to fully recover from the inactivation. Note that increasing the duration of the conditioning pulse to 0 mV induces a reduction in the charge movement measured for a pulse from 0 to −60 mV. (B) Shaker H4-Δ. Time course of the ionic current during 1-min depolarizing pulse to 0 mV. (C, symbols) Normalized charge movement (from 0 to −60 mV, from records of the type shown in A as a function of the inactivating prepulse. (wide trace) Time course of ionic current during a pulse to 0 mV (as shown in B). Data are normalized to their minima and maxima and fitted to the sum of two exponential functions (narrow trace) constraining the two time constants to be the same for ionic and gating current data: τfast = 4.1 s, τslow = 24 s. The ratios between the fast and slow components for charge movement and ionic current were 2.15 and 3.7, respectively. COVG technique in external isotonic Na-MES. Error bars are SEM (n = 6).
Figure 6
Figure 6
Correlation between the time course of recovery of slow inactivation and of changes in charge movement. (A) Shaker H4-Δ-W434F. Upper trace is the pulse protocol, remaining traces are unsubtracted gating currents. Linear components were analogically compensated with the amplifier transient cancellation at 20 mV HP. Numbers preceding the traces are the duration of the conditioning pulse to −90 mV. The 0 mV HP was held for 1 min between each stimulating pulse to fully slow inactivate the channels. Note that increasing the duration of the conditioning pulse to −90 mV induces an increase of the charge movement measured for a pulse from −90 to −20 mV. (B) Shaker H4-Δ. Similar protocol as in A to investigate the recovery of the ionic current from slow inactivation. Upper trace is the pulse protocol, remaining traces are unsubtracted K+ currents for a test pulse from −90 to −20 mV. The durations of the conditioning pulses to −90 mV are shown next to the traces. (C) Simultaneous fit to normalized charge movement (from −90 to −20 mV as in A) and ionic current during the same voltage step as shown in B. Averaged data (•, charge, n = 3; and ▴, ionic current, n = 3) were fitted to the sum of two exponential functions with the same two time constants but with different amplitudes: τfast = 0.01 s, τslow = 1.1 s. The ratios between the fast and slow components for charge movement and ionic current were 0.46 and 0.43, respectively. Data points are normalized to their minima and maxima. COVG technique in external isotonic Na-MES.
Figure 7
Figure 7
Cs+ currents in Shaker H4-Δ. (A) Membrane currents in cell-attached mode from an oocyte in which the internal medium was equilibrated with isotonic Cs-MES. The pipette was filled with isotonic 2 mM Cs-MES CaCl2, −90 mV HP. Pulse protocol (top): pulses were from −80 to 60 mV in 20-mV increments. Linear components were subtracted with P/−4 protocol from −90 mV subtracting HP. (B) I-V relationship from the experiment in A. The reversal potential for Cs+ is 0 mV.
Figure 8
Figure 8
Ionic and gating current of Shaker H4-Δ recover from slow inactivation with the same course. Same conditions as in Fig. 7. (A) Current traces in isotonic Cs-MES obtained pulsing to the reversal potential for Cs+ (0 mV). The channels were inactivated at 0 mV for 1 min and recovered with different pulse duration to −90 mV. Note that increasing the duration of the conditioning pulse to −90 mV produces an increase of the charge movement measured for a pulse from −90 to 0 mV, and a parallel increase in the tail current at the repolarizing potential (−90 mV). (B) Time course of the recovery of ionic current and gating charge. Simultaneous fit to normalized charge movement (from −90 to 0 mV as in A) and peak tail current during the repolarization to −90 mV. Data (ionic current • and charge ▴, normalized to their minima and maxima) were fitted to the sum of two exponential functions (continuous line) with the same time constants and different amplitudes: τfast = 0.28 s, τslow = 6.47 s. The ratios between the fast and slow components for charge movement and ionic current were 2.33 and 1.35, respectively.
Figure 9
Figure 9
Effect of intermediate holding potentials on the charge movement. COVG technique in isotonic Na-MES. (A) Normalized Q(V) curves from the same oocyte obtained from HPs ranging from −90 to 0 mV as indicated. Continuous lines are the fits to a sum of two Boltzmann distributions in the form of: Q on/Qmax = Q1/Q max/{1 + exp[z 1(V 1half Vm)F/RT]} + Q2/Q max/{1 + exp[z 2(V 2half Vm)F/RT]} where Qmax is the maximum charge movement, Q1 and Q2 are the amplitudes of the charge components, z 1 and z2 are the effective valences and V 1half and V 2half, the respective half activation potentials; F, R, and T are the usual thermodynamic constants. The fitting was performed to obtain the same effective valences (z 1 and z2) for all the Q-V curves and different amplitude and half activation potentials. The effective valences (z) were 2.9 for the first, more negative component, and 4.4 for the second component of the Q-Vs. The half activation potentials (V 1half and V 2half) and the amplitudes Q1 and Q2 for all the Q-V curves are plotted as a function of the holding potential in B and C, respectively. *Data points are from a different oocyte.

References

    1. Armstrong CM, Bezanilla F. Inactivation of the sodium channel. II. Gating current experiments. J Gen Physiol. 1977;70:567–590. - PMC - PubMed
    1. Bezanilla F, Taylor RE, Fernandez JM. Distribution and kinetics of membrane dielectric polarization. I. Long-term inactivation of gating currents. J Gen Physiol. 1982;29:21–40. - PMC - PubMed
    1. Bezanilla F, Perozo E, Papazian DM, Stefani E. Molecular bases of gating charge immobilization in Shakerpotassium channel. Science (Wash DC) 1991;254:679–683. - PubMed
    1. Bezanilla F, Perozo E, Stefani E. The gating of Shaker K+channels. II. The components of gating currents and a model of channel activation. Biophys J. 1994;66:1011–1021. - PMC - PubMed
    1. Choi KL, Aldrich RW, Yellen G. Tetraethylammonium blockage distinguishes two inactivation mechanisms in voltage-activated K+channels. Proc Natl Acad Sci USA. 1991;88:5092–5095. - PMC - PubMed

Publication types

LinkOut - more resources