Comparative Study
. 1997 Oct;8(10):1911-31.
doi: 10.1091/mbc.8.10.1911.

Characterization of the Golgi complex cleared of proteins in transit and examination of calcium uptake activities

Affiliations
Free PMC article
Comparative Study

Characterization of the Golgi complex cleared of proteins in transit and examination of calcium uptake activities

R S Taylor et al. Mol Biol Cell. 1997 Oct.
Free PMC article

Abstract

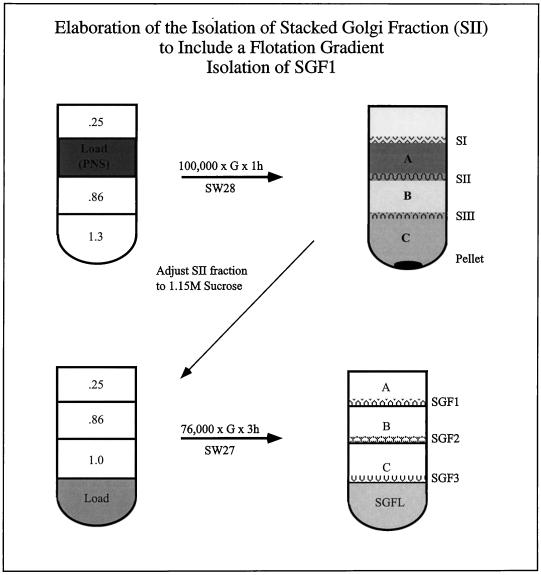
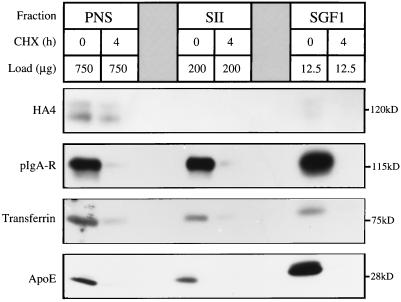
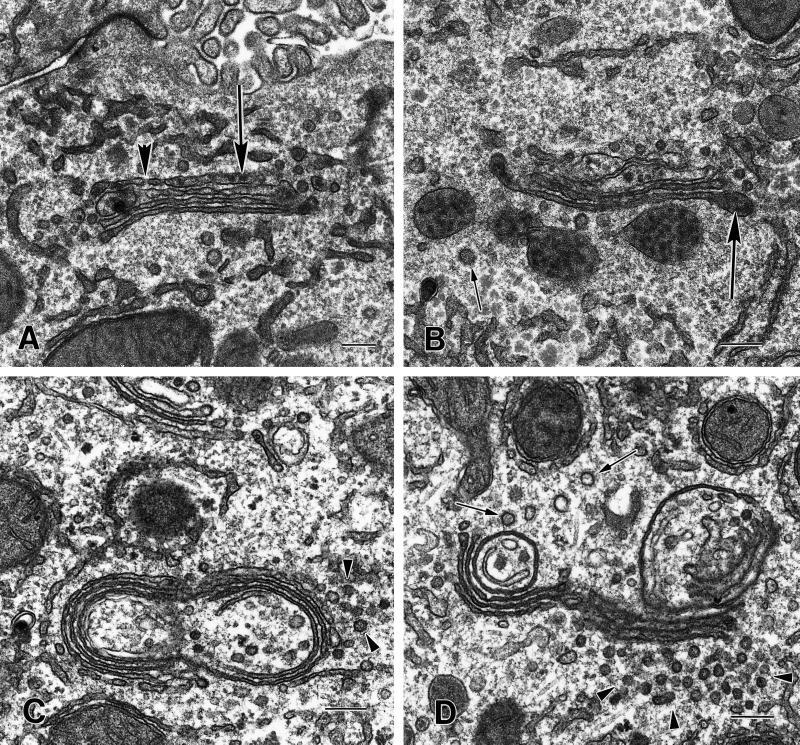
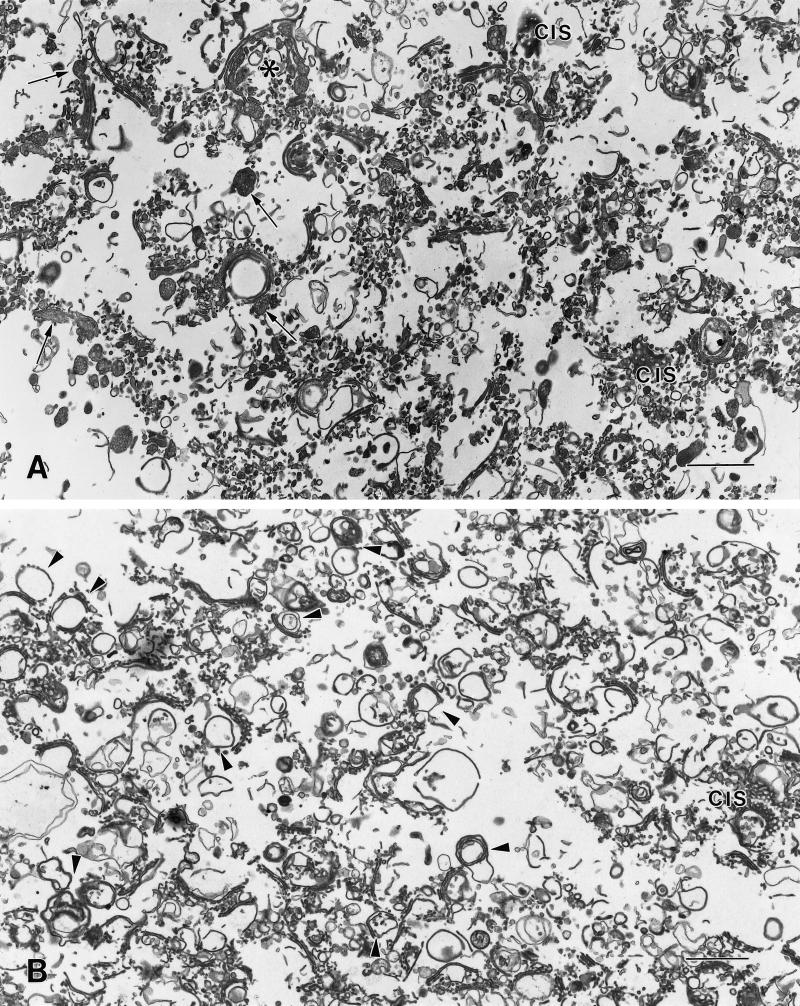
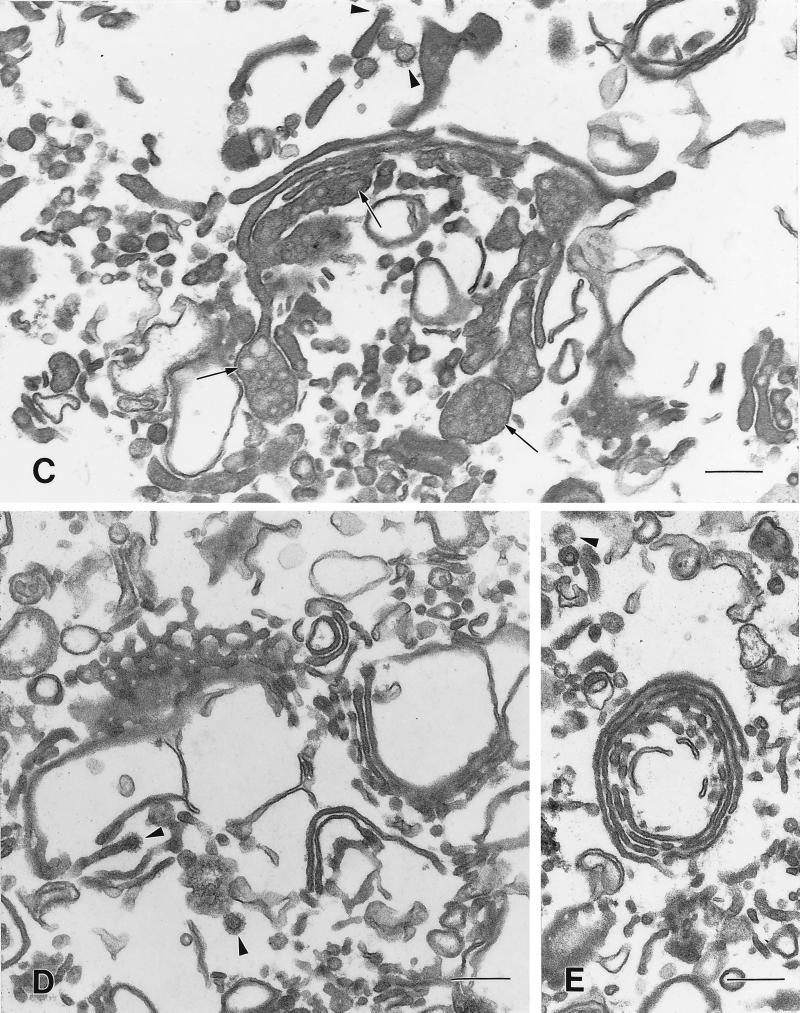
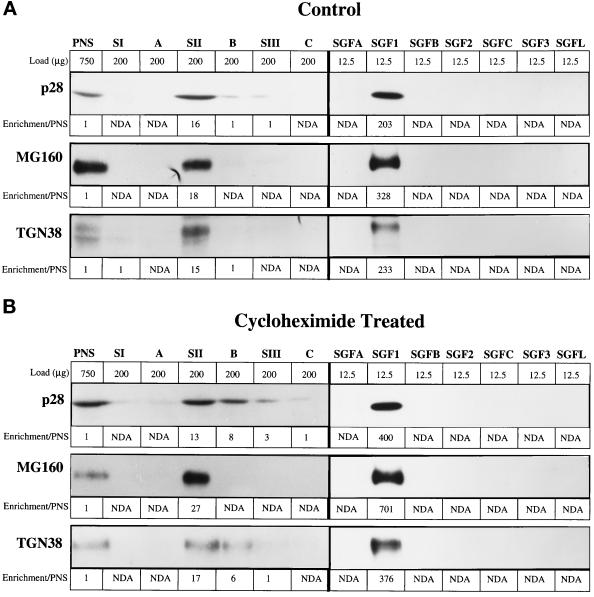
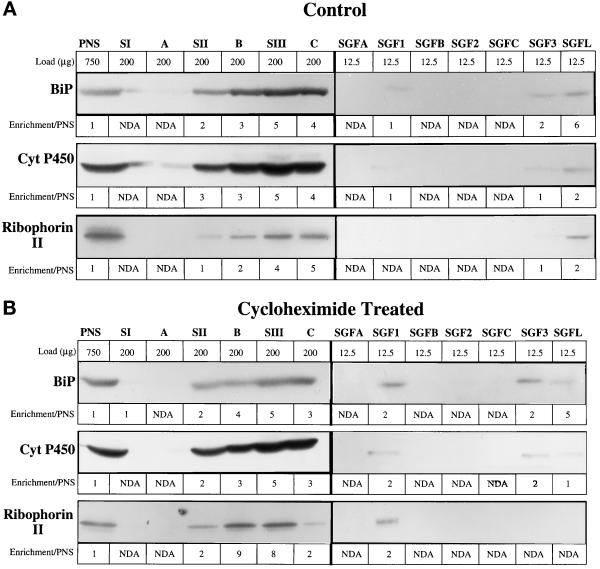
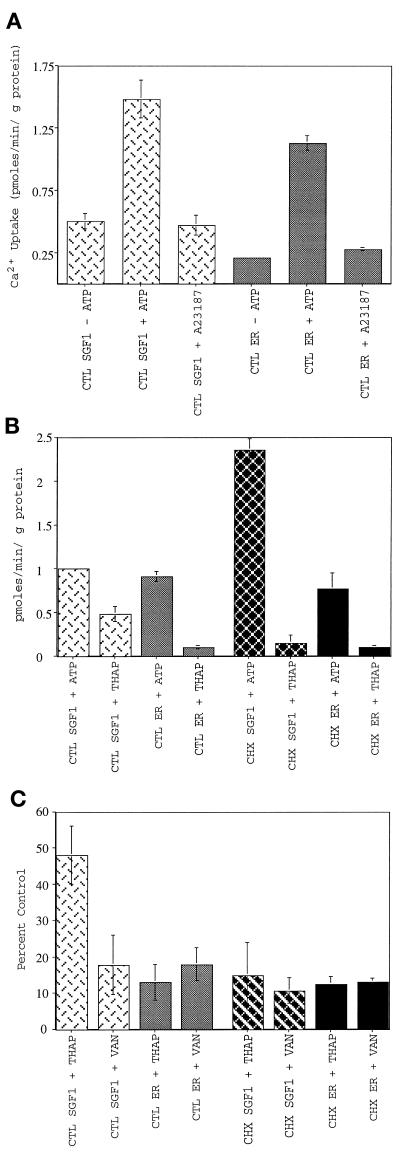
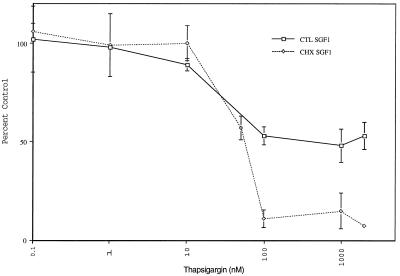
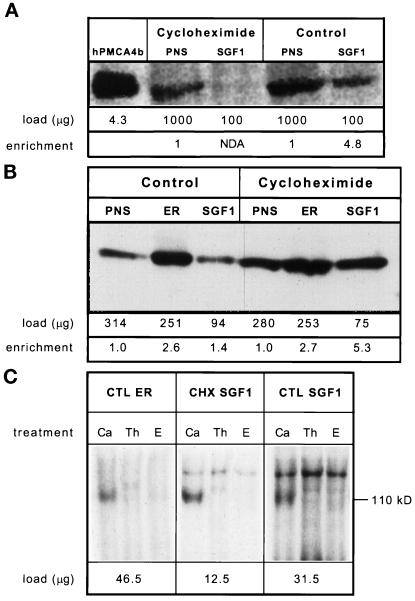
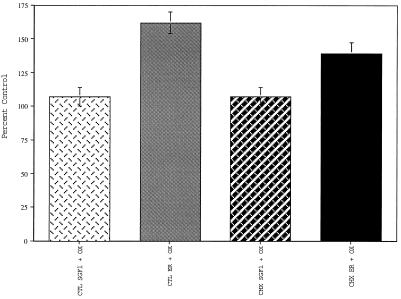
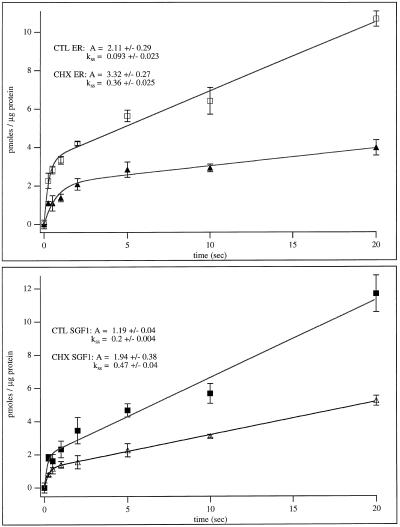
To characterize endogenous molecules and activities of the Golgi complex, proteins in transit were > 99% cleared from rat hepatocytes by using cycloheximide (CHX) treatment. The loss of proteins in transit resulted in condensation of the Golgi cisternae and stacks. Isolation of a stacked Golgi fraction is equally efficient with or without proteins in transit [control (CTL SGF1) and cycloheximide (CHX SGF1)]. Electron microscopy and morphometric analysis showed that > 90% of the elements could be positively identified as Golgi stacks or cisternae. Biochemical analysis showed that the cis-, medial-, trans-, and TGN Golgi markers were enriched over the postnuclear supernatant 200- to 400-fold with and 400- to 700-fold without proteins in transit. To provide information on a mechanism for import of calcium required at the later stages of the secretory pathway, calcium uptake into CTL SGF1 and CHX SGF1 was examined. All calcium uptake into CTL SGF1 was dependent on a thapsigargin-resistant pump not resident to the Golgi complex and a thapsigargin-sensitive pump resident to the Golgi. Experiments using CHX SGF1 showed that the thapsigargin-resistant activity was a plasma membrane calcium ATPase isoform in transit to the plasma membrane and the thapsigargin-sensitive pump was a sarcoplasmic/endoplasmic reticulum calcium ATPase isoform. In vivo both of these calcium ATPases function to maintain millimolar levels of calcium within the Golgi lumen.


Figures

Figure 1
Figure 1
Schematic of preparation of SGF1. The rat liver homogenate was centrifuged (1500 × g for 10 min) to pellet unbroken cells, cell debris, and nuclei. The resulting supernatant (PNS) was loaded in the middle of a step gradient formed in an SW28 tube (upper left) as follows. Two sucrose steps of 0.86 and 1.3 M sucrose were prepared and overlayed with the PNS (∼12 ml) followed by a layer of 0.25 M sucrose. The gradient was centrifuged at 100,000 × g for 1 h. All fractions were collected (upper right), and aliquots were frozen in liquid nitrogen and stored at −70°C. To further enrich the Golgi fraction, the majority of the SII fraction (from the 0.25 M–0.86 M interface) was adjusted to 1.15 M sucrose with 2 M sucrose. The adjusted SII was loaded into the bottom of a second SW28 tube and overlaid with equal volumes of 1.0, 0.86, and 0.25 M sucrose (lower left). The gradient was centrifuged at 76,000 × g for 3 h. All fractions were collected (lower right) and aliquots were frozen in liquid nitrogen and stored at −70°C. The highly enriched stacked Golgi fraction (SGF1) banded at the 0.25–0.86 M interface.
Figure 2
Figure 2
CHX treatment clears proteins in transit from SGF1. The efficiency of CHX treatment in clearing nonresident proteins from the Golgi complex was determined by quantitative immunoblotting of PNS, SII, and SGF1 from CTL and CHX-treated animals. To optimize detection and quantitation, the gel was loaded with 750 μg of PNS, 200 μg of SII, and 12.5 μg of SGF1. The four proteins analyzed were HA4, pIgA-R, transferrin, and ApoE shown from top to bottom. The molecular size of each reporter molecule is noted at the right of each panel.
Figure 3
Figure 3
Morphology of the compact regions of the Golgi ribbon in hepatocytes from CTL and CHX-treated animals. (A and B) The cisternae of the compact region of the Golgi ribbon from CTL animals are relatively straight. The cis cisternae (cis) were identified by their fenestrations (A, large arrowhead). Lipoprotein particles (large arrows) are present in the cisternae, particularly in the distended rims and/or vesicles in the trans region. Clathrin-coated vesicles (small arrow) are present in the trans region (B). (C and D) In the compact region of the Golgi stack the cisternae from CHX-treated animals are more tightly packed together and the width of the cisternal lumen is reduced when compared with CTLs. Lipoprotein particles are absent from the cisternae and vesicles. There are a large number of what appear to be vesicles (arrowheads), 50–70 nm in diameter, associated with the Golgi. Often the Golgi cisternae appear to be circular; this could result from a disruption at the noncompact region of the Golgi ribbon and some cisternae of the compact region folding back on themselves. The circularized Golgi cisternae are surrounded (both inside and out with many vesicles or tubules, some with clathrin-coats (small arrows, D). Bars, 200 nm.
Figure 4
Figure 4
Overview of SGF1s isolated from livers of CTL and CHX-treated animals. Low-magnification overview of CTL (A) and CHX (B) SGF1s. The majority of the components of the fractions are Golgi stacks, single cisternae, and associated vesicles. (A) In CTL SGF1, the cisternae are distended and contain secretory products (arrows). Most of the stacks are in a linear ribbon, although a few stacks appear circular. The asterisk indicates a Golgi region shown at higher magnification in C. (B) In CHX SGF1, the isolated stacks are condensed and do not contain obvious luminal secretory products. Compared with CTL SGF1, a higher proportion of the cisternae appear to be circular (arrowheads), similar to that observed in situ. The anastomosing tubular pattern of cis cisternae (cis) is particularly evident in the CHX SGF1. Higher magnifications of Golgi compact zones in CTL SGF1 (C) and CHX SGF1 (D and E). The stacked regions in the isolated CTL and CHX SGF1 have three or four cisternae. Arrowheads denote clathrin-coated structures. (C) In CTL SGF1, lipoprotein particles (arrows) are evident in the stacked cisternae, the dilated rims of the cisternae, and what appear to be adhering vesicles in the trans region. (D and E) In CHX SGF1, the cisternae of the Golgi stacks are more tightly packed and have reduced luminal widths when compared with the CTL. Lipoprotein particles are absent from the cisternae and vesicles. Circular profiles and cis regions are prominent. Bars: A and B, 1 μm; C–E, 200 nm.
Figure 4
Figure 4
Overview of SGF1s isolated from livers of CTL and CHX-treated animals. Low-magnification overview of CTL (A) and CHX (B) SGF1s. The majority of the components of the fractions are Golgi stacks, single cisternae, and associated vesicles. (A) In CTL SGF1, the cisternae are distended and contain secretory products (arrows). Most of the stacks are in a linear ribbon, although a few stacks appear circular. The asterisk indicates a Golgi region shown at higher magnification in C. (B) In CHX SGF1, the isolated stacks are condensed and do not contain obvious luminal secretory products. Compared with CTL SGF1, a higher proportion of the cisternae appear to be circular (arrowheads), similar to that observed in situ. The anastomosing tubular pattern of cis cisternae (cis) is particularly evident in the CHX SGF1. Higher magnifications of Golgi compact zones in CTL SGF1 (C) and CHX SGF1 (D and E). The stacked regions in the isolated CTL and CHX SGF1 have three or four cisternae. Arrowheads denote clathrin-coated structures. (C) In CTL SGF1, lipoprotein particles (arrows) are evident in the stacked cisternae, the dilated rims of the cisternae, and what appear to be adhering vesicles in the trans region. (D and E) In CHX SGF1, the cisternae of the Golgi stacks are more tightly packed and have reduced luminal widths when compared with the CTL. Lipoprotein particles are absent from the cisternae and vesicles. Circular profiles and cis regions are prominent. Bars: A and B, 1 μm; C–E, 200 nm.
Figure 5
Figure 5
Enrichment of Golgi markers in the stacked Golgi fraction. Golgi markers were analyzed in the fractions of the SGF1 isolation protocol by quantitative immunoblot of fractions from CTL (A) and CHX-treated (B) animals. The fractions are noted at the top and directly below is the load (micrograms of protein) of that fraction. It was necessary to increase the protein load of fraction in which the markers were present in low concentrations to obtain a reliable signal. For each marker, the values for enrichment over PNS are placed below the gel bands: cis-, p28; medial-, MG160; trans- and TGN, TGN38.
Figure 6
Figure 6
Enrichment of ER markers in the stacked Golgi fraction. ER markers were analyzed in the fractions of the SGF1 isolation protocol by quantitative immunoblot of fractions from CTL (A) and CHX-treated (B) animals. The fractions are noted at the top of each panel and directly below is the load (μg of protein) of that fraction. It was necessary to increase the protein load of fractions in which the markers were present in low concentrations to obtain a reliable signal. For the following markers, the values for enrichment over PNS are indicated: BiP, soluble luminal protein; cytochrome P450, a transmembrane protein enriched in SER; Ribophorin II, a membrane protein predominately localized to RER. NDA, no detectable antigen or activity.
Figure 7
Figure 7
Characterization of calcium uptake into SGF1s. SGF1 takes up calcium into a membrane-bound compartment in an ATP-dependent manner and is blocked by known inhibitors of SERCA and all p-type ATPases. CTL SGF1 (light cross-hatched bars), CTL ER (light solid bars), CHX SGF1 (dark cross-hatched bars), and CHX ER (dark solid bars) are indicated. (A) ATP-dependent calcium uptake into CTL SGF1 and CTL ER fraction. Calcium uptake in pmoles per minute per microgram of protein is plotted. Uptake reactions were performed in the presence of 75 nM free calcium by using 25 μg of SGF1 or 100 μg of ER for 10 min at 37°C in the absence of ATP, in the presence of 1 mM ATP, or in the presence of 1 mM ATP and 1 μM A23187. The 10-min time point was within the linear range of calcium uptake (see Figure 11). Note that background (uptake in the absence of ATP) is not subtracted from any of these experiments. (B) Thapsigargin sensitivity of calcium uptake into CTL and CHX SGF1s and CTL and CHX ER fractions. ATP-dependent calcium uptake in pmoles per minute per microgram of protein (after background subtraction from a minus ATP reaction) is plotted for all four fractions. Thapsigargin (2 μM) was added to the reaction mixture containing 1 mM ATP at 4°C for 5 min before initation of the assay by rapid warming to 37°C. (C) Inhibition of calcium uptake by thapsigargin and sodium vanadate. Calcium uptake is expressed as percent of CTL (no inhibitor) for all four fractions. Thapsigargin (2 μM) was added to the reaction mixture at 4°C for 5 min before initation of the assay by rapid warming to 37°C. The fractions were pretreated with 1 mM sodium vanadate for 10 min at room temperature in the absence of ATP before warming to 37°C and addition of ATP. Error bars represent SD, and n = 25 for A, and n = 6 for B and C.
Figure 8
Figure 8
Thapsigargin dose–response curves for CTL SGF1 and CHX SGF1. Calcium uptake is measured in the presence of increasing amounts of thapsigargin (0–2000 nM) for CTL SGF1 (□) and CHX SGF1 (♦). Calcium uptake is expressed as percent of control (no thapsigargin). Error bars represent SD, and n = 6.
Figure 9
Figure 9
Immunoblot and autophosphorylation analysis of CTL and CHX fractions. Samples of each fraction were solubilized in SDS-PAGE sample buffer at room temperature for 1 h before running on a 5–15% polyacrylamide gel and transfer to Immobilon-P. The sample size was optimized for each fraction and the protein loaded per lane is given directly below each lane. Signal was detected with 125I-labeled protein A and quantitated by using a PhosphorImager and reported in PI units. Enrichment was calculated as (sample PI units/μg of protein)/(PNS PI units/μg of protein) and is given at the bottom of the figure. Shown is an autoradiograph of the same immunoblot. (A) PMCA analysis by immunoblotting: lane 1, COS microsomes overexpressing hPMCA4b; lane 2, CHX PNS; lane 3, CHX SGF1; lane 4, CTL PNS; lane 5, CTL SGF1. (B) SERCA analysis: lane 1, CTL PNS; lane 2, CTL ER; lane 3, CTL SGF1; lane 4, CHX PNS; lane 5, CHX ER; lane 6, CHX SGF1. NDA is defined as an enrichment of less than 0.5. (C) Calcium-dependent autophosphorylation of fractions. CTL ER (left), CHX SGF1 (middle), and CTL SGF1 (right) were incubated with [γ-32P]ATP. The sample size was optimized for each fraction and the protein per reaction is given below the autoradiograph. Reactions were carried out in the presence of 100 μM calcium (Ca), 2 μM thapsigargin (Th), or 1 mM EGTA (E) for 15 s on ice and processed as described in MATERIALS AND METHODS. The molecular mass of SERCA (110 kDa) is shown on the right. This was the only band phosphorylated in a calcium-stimulated and an EGTA-inhibited manner.
Figure 10
Figure 10
Effect of oxalate on calcium uptake. Calcium uptake in the presence and absence of oxalate is expressed as percent of CTL (no oxalate) for all four fractions: CTL SGF1 (light cross-hatched bars), CTL ER (light solid bars), CHX SGF1 (dark cross-hatched bars), and CHX ER (dark solid bars). Plus oxalate samples contained 2.5 mM potassium oxalate. Error bars represent SD and n = 3.
Figure 11
Figure 11
Time course of calcium uptake into CTL and CHX SGF1 and ER fractions. (Upper panel) Calcium uptake versus time is plotted for CTL ER (▴) and CHX ER (□). (Lower panel) Calcium uptake (pmoles/μg of protein) versus time (seconds) is plotted for CTL SGF1 (▵) and CHX SGF1 (▪). Curves were fitted and rates were calculated by using Igor software and the formula: f(x) = A × [1 − exp(−kb × t)] + kss × t, where A is the burst amplitude, kb is the burst rate, and kss is the steady-state rate. The burst height (A) and steady-state rate of uptake (kss) for each fraction are given.

Similar articles

Cited by

References

    1. Antebi A, Fink GR. The yeast Ca(2+)-ATPase homologue, PMR1, is required for normal Golgi function and localizes in a novel Golgi-like distribution. Mol Biol Cell. 1992;3:633–654. - PMC - PubMed
    1. Baumrucker CR, Keenan TW. Membranes of mammary gland. X. Adenosine triphosphate dependent calcium accumulation by Golgi apparatus rich fractions from bovine mammary gland. Exp Cell Res. 1975;90:253–260. - PubMed
    1. Beaufay H, Amar-Costesec A, Feytmans E, Thines-Sempoux D, Wibo M, Robbi M, Berthet J. Analytical study of microsomes and isolated subcellular membranes from rat liver. 3. Subfractionation of the microsomal fraction by isopycnic and differential centrifugation in density gradients. J Cell Biol. 1974;61:188–200. - PMC - PubMed
    1. Berger EG, Mandel TH, Schilt U. Immunohistochemical localization of galactosyltransferase in human fibroblasts and HeLa cells. J Histochem Cytochem. 1981;29:364–371. - PubMed
    1. Bergeron JJM. Golgi fractions from livers of control and ethanol-intoxicated rats. Enzymic and morphologic properties following rapid isolation. Biochim Biophys Acta. 1979;555:493–503. - PubMed

Publication types

MeSH terms

LinkOut - more resources