Comparative Study
. 1997 Nov 1;11(21):2910-24.
doi: 10.1101/gad.11.21.2910.

A bacterial group II intron encoding reverse transcriptase, maturase, and DNA endonuclease activities: biochemical demonstration of maturase activity and insertion of new genetic information within the intron

Affiliations
Comparative Study

A bacterial group II intron encoding reverse transcriptase, maturase, and DNA endonuclease activities: biochemical demonstration of maturase activity and insertion of new genetic information within the intron

M Matsuura et al. Genes Dev. .

Abstract

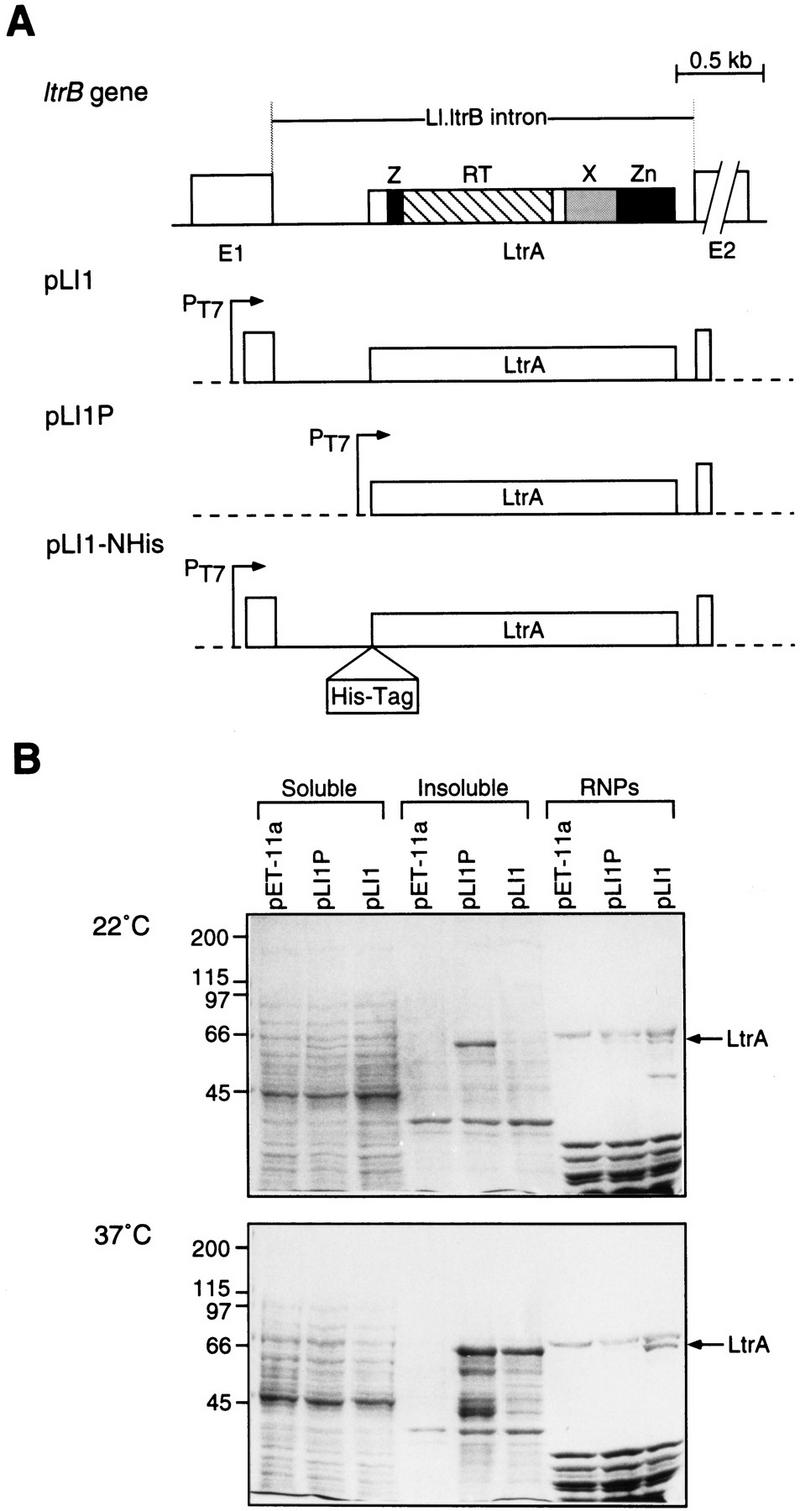
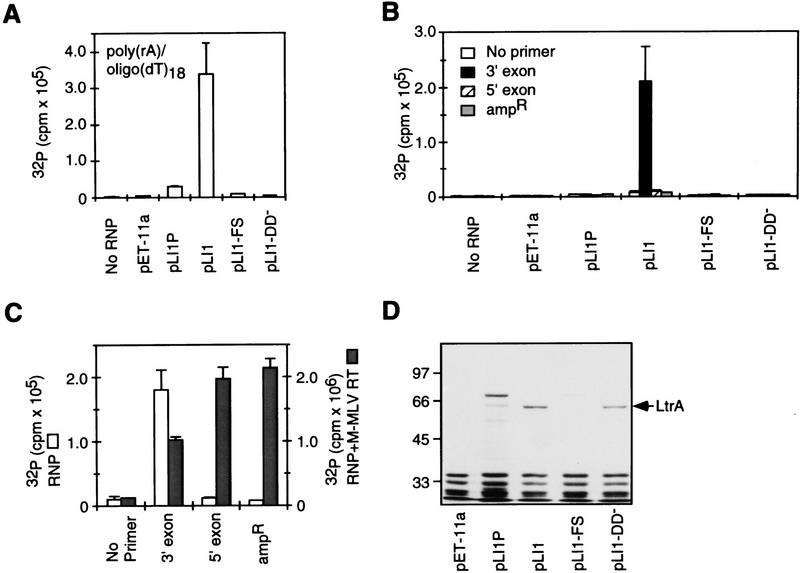
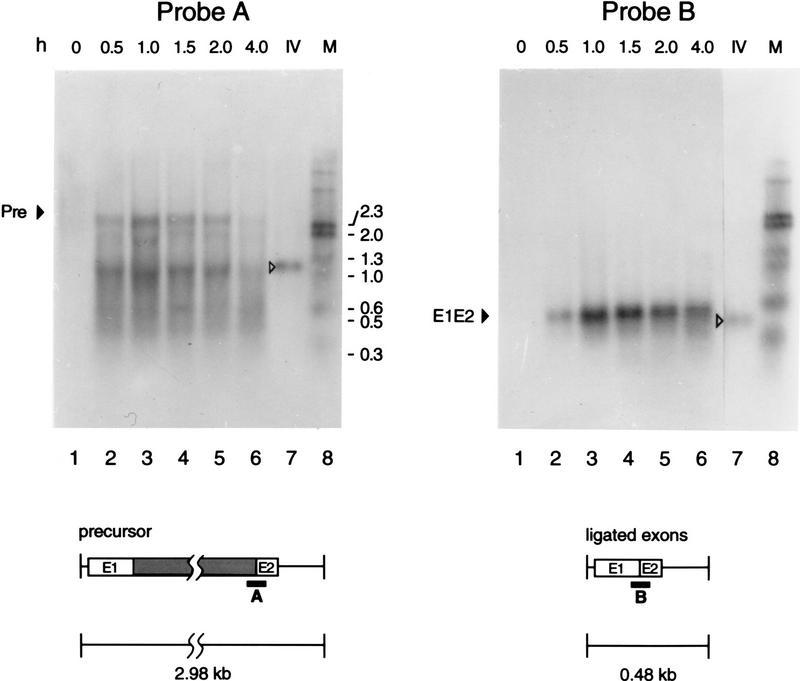
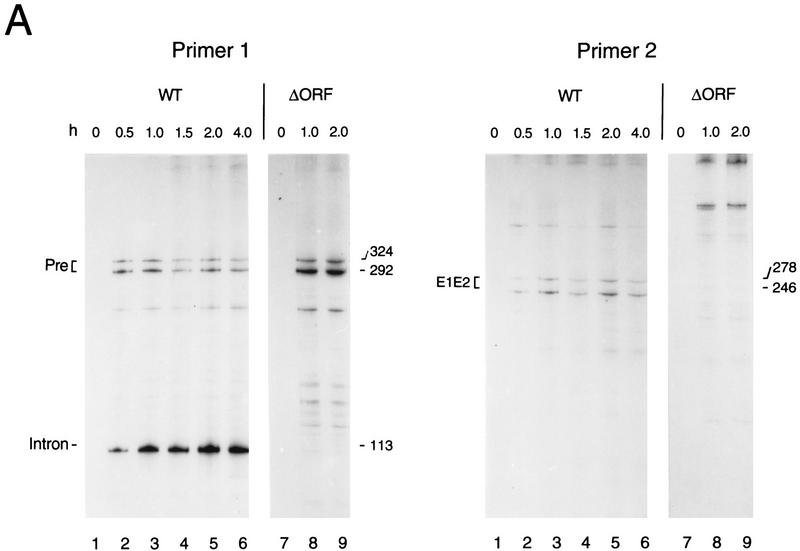
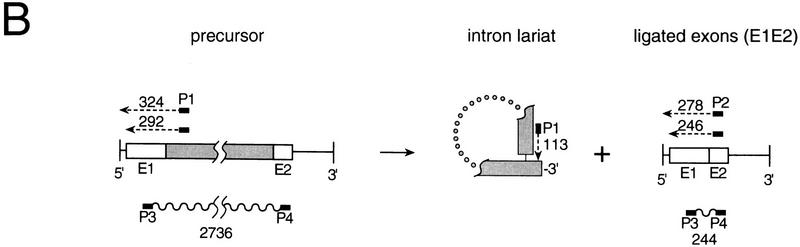
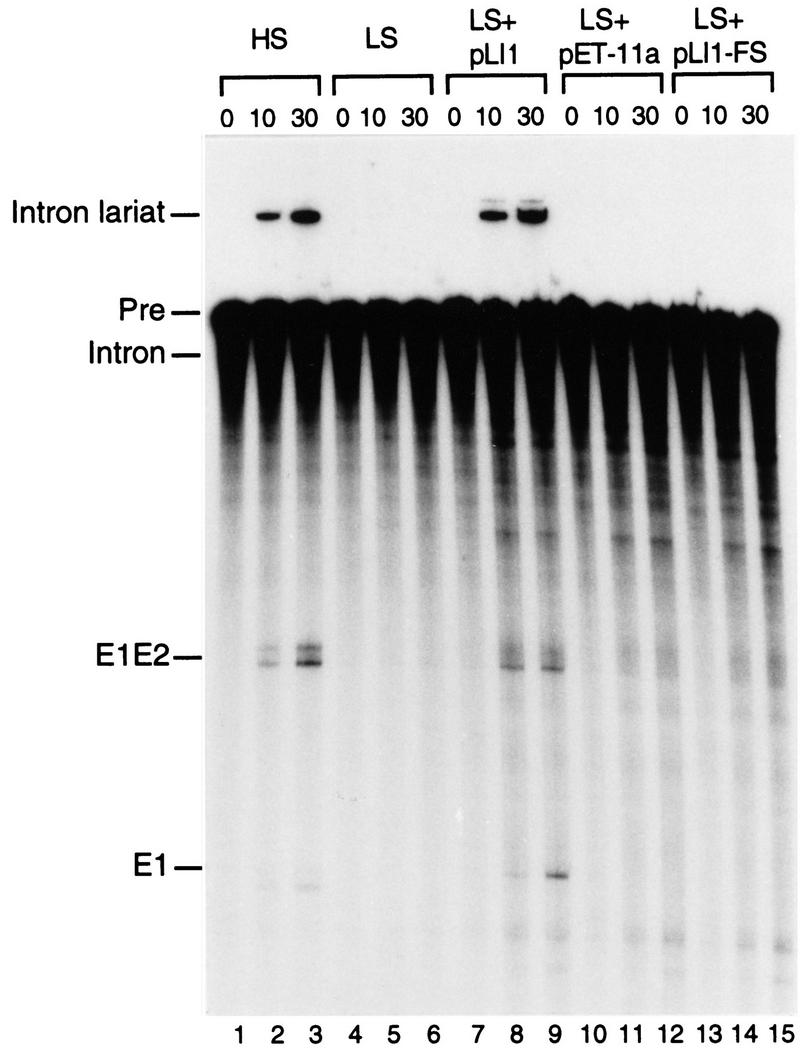
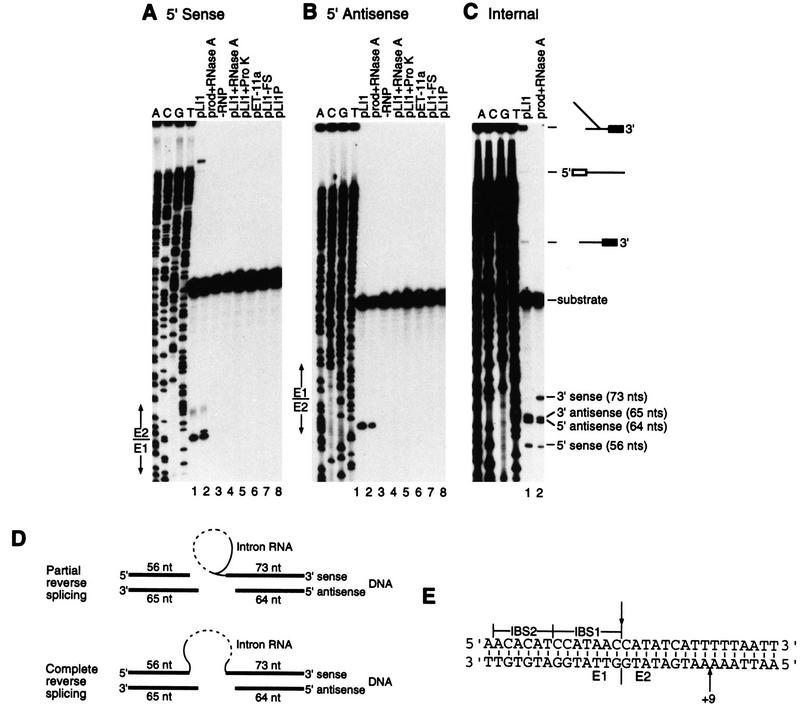
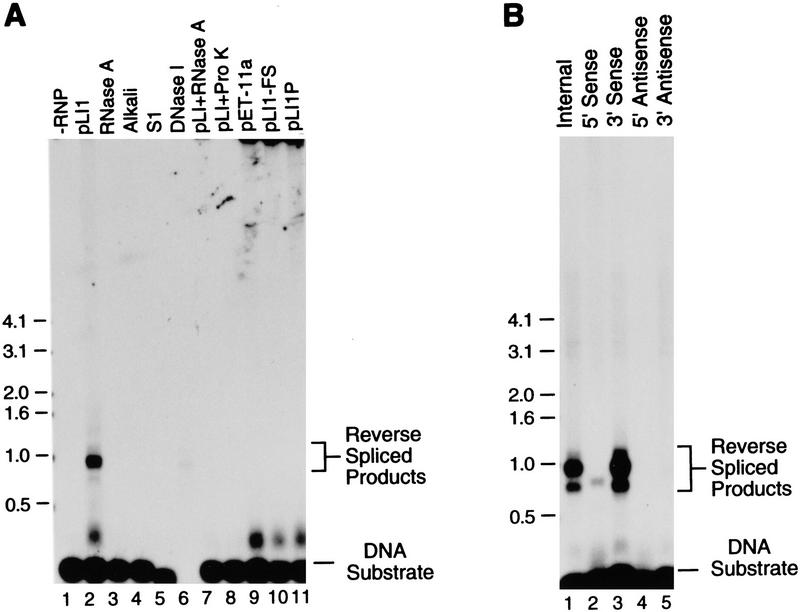
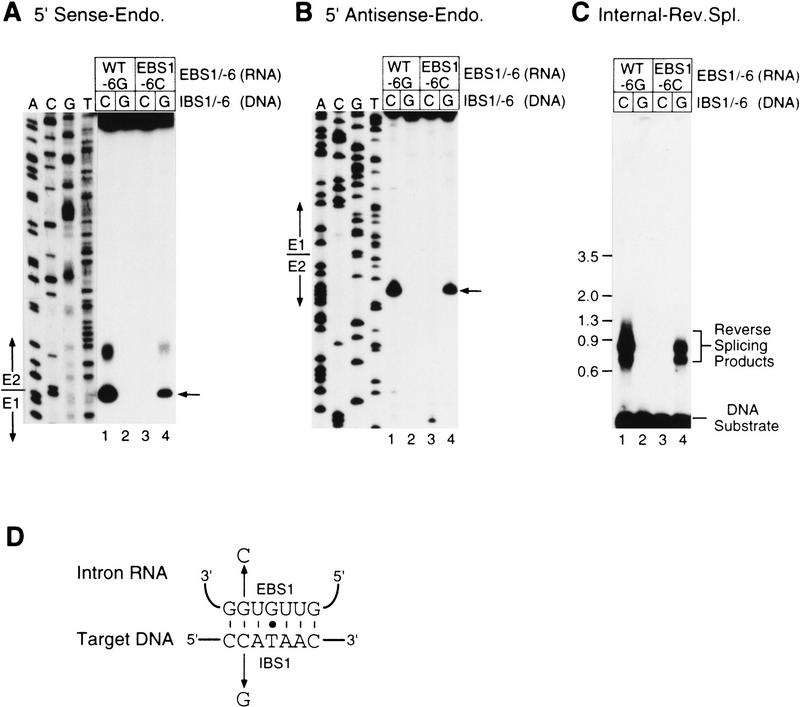
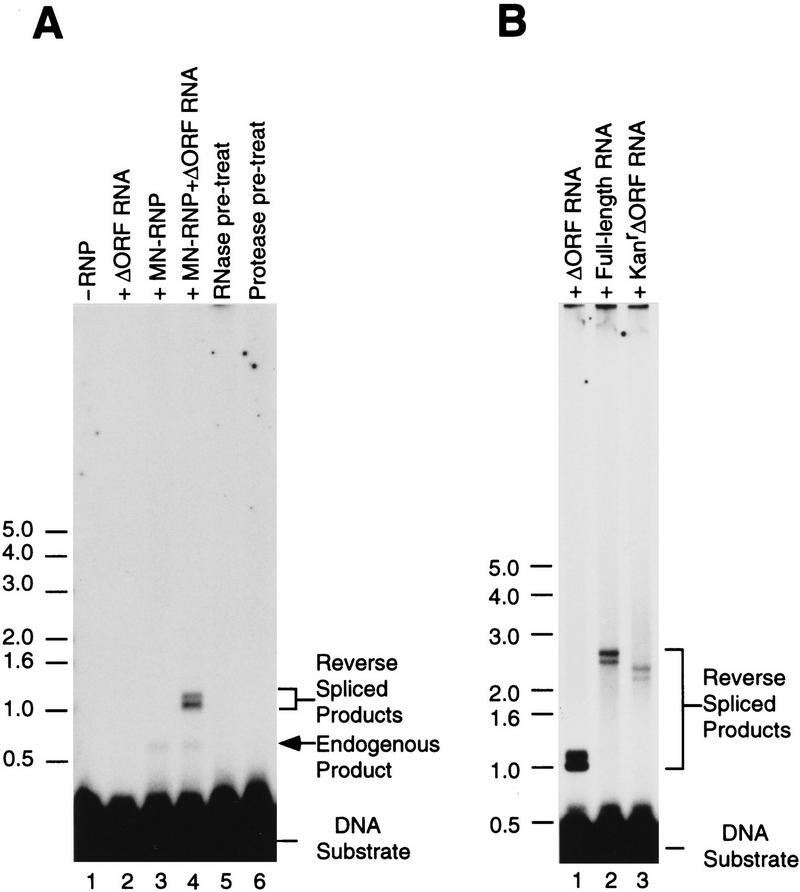
The Lactococcus lactis group II intron Ll.ltrB is similar to mobile yeast mtDNA group II introns, which encode reverse transcriptase, RNA maturase, and DNA endonuclease activities for site-specific DNA insertion. Here, we show that the Lactococcal intron can be expressed and spliced efficiently in Escherichia coli. The intron-encoded protein LtrA has reverse transcriptase and RNA maturase activities, with the latter activity shown both in vivo and in vitro, a first for any group II intron-encoded protein. As for the yeast mtDNA introns, the DNA endonuclease activity of the Lactococcal intron is associated with RNP particles containing both the intron-encoded protein and the excised intron RNA. Also, the intron RNA cleaves the sense-strand of the recipient DNA by a reverse splicing reaction, whereas the intron-encoded protein cleaves the antisense strand. The Lactococcal intron endonuclease can be obtained in large quantities by coexpression of the LtrA protein with the intron RNA in E. coli or reconstituted in vitro by incubating the expressed LtrA protein with in vitro-synthesized intron RNA. Furthermore, the specificity of the endonuclease and reverse splicing reactions can be changed predictably by modifying the RNA component. Expression in E. coli facilitates the use of group II introns for the targeting of specific foreign sequences to a desired site in DNA.


Figures

Figure 1
Figure 1
Expression of the LtrA protein in E. coli. (A) Diagram of the Ll.ltrB intron and constructs pLI1, pLI1P, and pLI1–NHis used for expression of the LtrA protein in E. coli. The protein domains shared by other group II intron ORFs are indicated (Mohr et al. 1993). Exons (E1 and E2) are open boxes, the intron is a line, and the LtrA ORF is a box within the intron. Vector sequences are indicated by broken lines. (B) SDS–PAGE of expressed proteins. Constructs were expressed in E. coli BL21(DE3) grown at 22°C or 37°C, and proteins in the soluble, insoluble, and RNP fractions (0.24 OD260 units) were analyzed by SDS–PAGE (Laemmli 1970) with a 3% stacking gel and an 8% resolving gel. Shown is a Coomassie blue-stained gel. Numbers at left indicate molecular mass markers (kD).
Figure 2
Figure 2
RT activity in RNP particle preparations from E. coli. (A) RT assays with poly(rA)–oligo(dT)18. RNP particles were isolated from cells grown at 37°C, and RT activity was assayed, as described in Materials and Methods. For pLI1P, the data shown are for cells grown at 22°C, because no RT activity was detected in RNP preparations from cells grown at 37°C. (B) Endogenous reverse transcription reactions in the RNP particles. Reactions were carried out in the presence or absence of 20 pmoles of 3′ exon, 5′ exon, or ampR primers. (C) Control for accessibility of primers to endogenous RNA templates. Endogenous reactions with pLI1 RNP particles were carried out with different DNA primers in the presence (shaded bars) or absence (open bars) of M-MLV RT. (D) SDS–PAGE of RNP particle proteins. SDS–PAGE was carried out as in Fig. 1, with 0.5 OD260 units of RNP particles. Numbers at left indicate molecular mass markers (kD). Error bars in the RT assays indicate standard deviations for three determinations.
Figure 3
Figure 3
RNA splicing in E. coli. Northern hybridizations were performed with RNA extracted from E. coli 0 to 4 hr after induction of transcription from plasmid pLI1 (lanes 1–6). Oligonucleotide probe A hybridizes to the 3′ splice site of the precursor RNA, whereas probe B hybridizes to the splice junction of the ligated exons. (Lanes 7) RNA transcribed from pLI2–ΔORF and self-spliced in vitro (IV). The hybridization to self-spliced RNA shows the specificity of the probes and provides RNA size markers (precursor, 1.25 kb, ligated exons 0.35 kb). (Lanes 8) DNA size markers, with sizes (kb) indicated to the right. In the schematic below, exons are □, the intron is a shaded box, and vector sequences are represented by a line. Probes are shown as black bars.
Figure 4
Figure 4
RNA splicing is accurate in E. coli. (A) Primer extension analysis. RNAs extracted from E. coli at the indicated times after induction of transcription from plasmids pLI1 (lanes 1–6) or pLI2–ΔORF (lanes 7–9) were reverse-transcribed with intron-specific primer 1 or exon 2-specific primer 2. The cDNA bands, of lengths indicated in nucleotides to the right of each panel, correspond to precursors (Pre) and intron lariat for primer 1, and ligated exons (E1E2) for primer 2. (B) Schematic of RNAs, cDNAs, and PCR products. RNAs are depicted as in Fig. 3, cDNA extension products are shown as broken lines, PCR products as wavy lines, and primers as black bars.
Figure 4
Figure 4
RNA splicing is accurate in E. coli. (A) Primer extension analysis. RNAs extracted from E. coli at the indicated times after induction of transcription from plasmids pLI1 (lanes 1–6) or pLI2–ΔORF (lanes 7–9) were reverse-transcribed with intron-specific primer 1 or exon 2-specific primer 2. The cDNA bands, of lengths indicated in nucleotides to the right of each panel, correspond to precursors (Pre) and intron lariat for primer 1, and ligated exons (E1E2) for primer 2. (B) Schematic of RNAs, cDNAs, and PCR products. RNAs are depicted as in Fig. 3, cDNA extension products are shown as broken lines, PCR products as wavy lines, and primers as black bars.
Figure 5
Figure 5
Protein-dependent in vitro splicing of the Ll.ltrB intron. 32P-Labeled in vitro transcript pLI2–ΔORF/EcoRI was incubated for 0, 10, or 30 min under high salt (HS) (lanes 1–3) or low salt (LS) (lanes 4–15) conditions (see Materials and Methods) in the presence or absence of MNase-digested RNP particles (0.1 OD260 unit) from E. coli expression strains grown at 37°C. The products were analyzed in a denaturing 4% polyacrylamide gel, which was dried and autoradiographed. (Lanes 1–6) Precursor RNA incubated in the absence of RNP particles; (lanes 7–15) precursor RNA incubated under LS conditions with MNase-digested RNP particles from E. coli expressing pLI1 (lanes 7–9), pET-11a (lanes 10–12), or pLI1–FS (lanes 13–15). (Pre) Unspliced precursor RNA; (E1E2) ligated exons; (E1) exon 1.
Figure 6
Figure 6
Assay of DNA endonuclease activity with E1E2 DNA substrates. (A,B) Endonuclease assays with 5′ sense and 5′ antisensestrand-labeled substrates, respectively. RNP particles (0.025 OD260 unit) from the indicated strains grown at 37°C were incubated with the labeled DNA substrates, and the cleavage products were analyzed in a denaturing 6% polyacrylamide gel, alongside sequencing ladders obtained from pLHS with the same 5′-end-labeled primer used to generate the substrate. (Lanes 1) pLI1 RNP particles; (lanes 2) cleavage products from the reaction of lane 1 incubated with RNase A; (lanes 3) DNA substrate incubated in the absence of RNP particles; (lanes 4,5) pLI1 RNP particles pretreated with RNase A or proteinase K; (lanes 6–8) RNP particles from cells containing the vector pET-11a, pLI1–FS, and pLI1P, respectively. The diffuse bands above the major sense strand cleavage product were not detected with internally labeled DNA substrate (see below) and are presumably an artifact of the 5′-end-labeled substrate. (C) Endonuclease assays with internally labeled DNA substrate. (Lane 1) pLI1 RNP particles; (lane 2) cleavage products from the reaction of lane 1 incubated with RNase A, as above. (D) Schematic showing the products expected for partial and complete reverse splicing of the Ll.ltrB intron into the DNA substrate. The dashed line depicts the cleaved region of the intron RNA (see Fig. 7). (E) Sequence of the Ll.ltrB target site showing the location of the cleavage sites (arrows) on the sense (top) and antisense (bottom) strands.
Figure 7
Figure 7
Reverse splicing of the Ll.ltrB intron into the E1E2 DNA substrate. (A) Reverse splicing reactions with internally labeled DNA substrate. RNP particles (0.025 OD260 unit) from cells grown at 37°C were incubated with the 129-bp 32P-labeled E1E2 DNA substrate (150,000 cpm, ∼125 fmoles). The products were denatured with glyoxal and analyzed in a 1% agarose gel. (Lane 1) DNA substrate incubated in the absence of RNP particles; (lane 2) DNA substrate incubated with RNP particles from cells expressing pLI1; (lanes 3–6) reverse spliced products of pLI1 RNP particles treated with RNase A, alkali, S1 nuclease, or DNase I; (lanes 7,8) pLI1 RNP particles pretreated with RNase A or proteinase K prior to reverse splicing (see Materials and Methods); (lanes 9–11) DNA substrate incubated with RNP particles from cells containing pET-11a, pLI1–FS, and pLI1P, respectively. (B) Reverse splicing reaction with E1E2 DNA substrates labeled separately at each of the four termini. pLI1 RNP particles were incubated with 5′- or 3′-end-labeled DNA substrates (150,000 cpm; ∼250 fmoles of 5′-end-labeled substrates and ∼200 fmoles of 3′-end-labeled substrates), and the products were analyzed as above. Numbers to the left indicate DNA size markers (kb).
Figure 8
Figure 8
Modifiable specificity of the Ll.ltrB endonuclease and reverse splicing activity. (A,B) Endonuclease assays with DNA substrates labeled at the 5′ ends of the sense and antisense strands, respectively. RNP particles from cells grown at 37°C expressing pLI1 (WT; lanes 1,2) or pLI1-EBS1-6C (lanes 3,4) were incubated with either the wild-type E1E2 DNA substrate (lanes 1,3) or a modified DNA substrate having a C → G change at E1–6 (E1–6G; lanes 2,4). The products were analyzed in a denaturing 6% polyacrylamide gel, which was dried and autoradiographed. The diffuse bands above the major sense strand cleavage product are presumably an artifact of the 5′-labeled substrate, as in Fig. 6. (C) Reverse splicing assays. The RNP particles were incubated as above with internally labeled DNA substrates, and the products were denatured with glyoxal and analyzed in a 1% agarose gel. Numbers to the left indicate DNA size markers (kb). (D) EBS1/IBS1 interactions for wild-type and modified forms of the LI.ltrB intron and DNA target sites. Watson–Crick and G-T pairings are indicated by short vertical bars and a dot, respectively.
Figure 9
Figure 9
Reconstitution of Ll.ltrB intron endonuclease activity. (A) Reconstitution and sensitivity to pretreatment with RNase and protease. The endonuclease was reconstituted with spliced pLI2–ΔORF /BamHI RNA and MNase-digested RNP particles and used for reverse splicing assays with internally labeled E1E2 DNA substrate (∼30 fmoles). (Lane 1) DNA substrate incubated without RNP particles; (lane 2) DNA substrate incubated with in vitro-spliced pLI2–ΔORF RNA alone; (lane 3) DNA substrate incubated with MNase-digested RNP particles alone; (lane 4) DNA substrate incubated with endonuclease reconstituted by mixing MNase-digested RNP particles with in vitro spliced pLI2–ΔORF RNA; (lanes 5,6) reconstituted endonuclease preincubated with RNase or proteinase K prior to the reverse splicing reaction (see Methods). Reverse-spliced products were denatured with glyoxal and analyzed in a 1% agarose gel. Numbers to the left indicate size markers. (B) Reconstitution with full-length and modified intron RNAs. Reverse splicing into the E1E2 DNA substrate (∼60 fmoles) was carried out with endonucleases reconstituted with the following in vitro spliced RNAs: (Lane 1) pLI2–ΔORF; (lane 2) pLI1; (lane 3) pLI2–ΔORFkanR. The products were analyzed as above.

References

    1. Belfort M, Ehrenman K, Chandry PS. Genetic and molecular analysis of RNA splicing in Escherichia coli. Methods Enzymol. 1990;181:521–539. - PubMed
    1. Bonen L. Trans-splicing of pre-mRNA in plants, animals, and protists. FASEB J. 1993;7:40–46. - PubMed
    1. Caprara MG, Mohr G, Lambowitz AM. A tyrosyl-tRNA synthetase protein induces tertiary folding of the group I intron catalytic core. J Mol Biol. 1996;257:512–531. - PubMed
    1. Carignani G, Groudinsky O, Frezza D, Schiavon E, Bergantino E, Slonimski P. An mRNA maturase is encoded by the first intron of the mitochondrial gene for the subunit I of cytochrome oxidase in S. cerevisiae. Cell. 1983;35:733–742. - PubMed
    1. Collins ML, Hunsaker WR. Improved hybridization assays employing tailed oligonucleotide probes: A direct comparison with 5′-end-labeled oligonucleotide probes and nick-translated plasmid probes. Anal Biochem. 1985;151:211–224. - PubMed

Publication types

MeSH terms