

Reduction of HIV-1 in blood and lymph nodes following potent antiretroviral therapy and the virologic correlates of treatment failure
- PMID: 9356491
- PMCID: PMC25043
- DOI: 10.1073/pnas.94.23.12574
Reduction of HIV-1 in blood and lymph nodes following potent antiretroviral therapy and the virologic correlates of treatment failure
Abstract
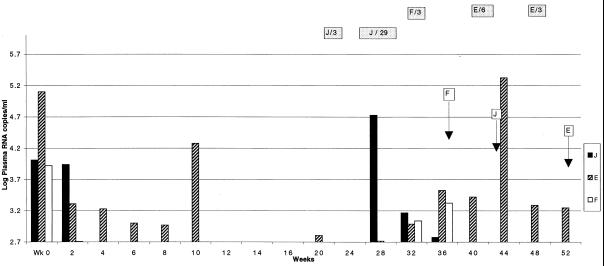
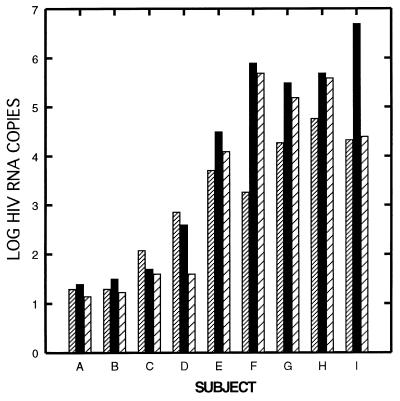
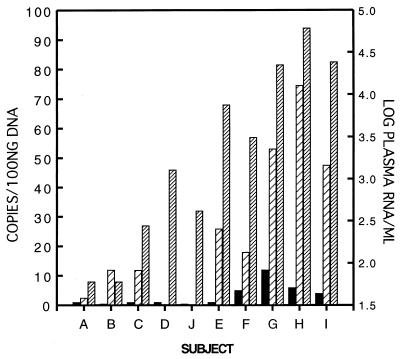
Potent antiretroviral therapy can reduce plasma HIV RNA levels below the threshold of detection for periods of a year or more. The magnitude of HIV RNA reduction in the lymphoid tissue in patients with suppression of HIV RNA levels in plasma beyond 6 months has not been determined. We evaluated levels of HIV RNA and DNA and characterized resistance mutations in blood and inguinal lymph node biopsies obtained from 10 HIV-infected subjects who received 36-52 weeks of indinavir (IDV)/zidovudine (ZDV)/lamivudine (3TC), IDV, or ZDV/3TC. After 1 year of therapy, viral RNA levels in LN of individuals remained detectable but were log10 = 4 lower than in subjects on the triple drug regimen with interruption of therapy or in those treated with ZDV/3TC alone, who had viral loads in their lymph nodes indistinguishable from those expected for untreated patients. In all cases viral DNA remained detectable in lymph nodes and peripheral blood mononuclear cells (PBMC). When plasma virus suppression was incomplete, lymph node and PBMC cultures were positive and drug resistance developed. These studies indicate that pronounced and sustained suppression of plasma viremia by a potent antiretroviral combination is associated with low HIV RNA levels in the lymph nodes 1 year after treatment. Conversely, the persistence of even modest levels of plasma virus after 1 year of treatment reflects ongoing viral replication, the emergence of drug resistance, and the maintenance of high burdens of virus in the lymph nodes.
Figures
References
-
- Havlir D V, Richman D D. Ann Intern Med. 1996;124:984–994. - PubMed
-
- Gulick R, Mellors J, Havlir D, Eron J, Gonzalez C, McMahon D, Richman D, Valentine F, Jonas L, Meibohm A, Chiou R, Deutsch P, Emini E, Chodakewitz J. N Engl J Med. 1997;337:734–739. - PubMed
-
- Embretson J, Zupancic M, Ribas J L, Burke A, Racz P, Tenner-Racz K, Haase A T. Nature (London) 1993;363:359–362. - PubMed
-
- Pantaleo G, Graziosi C, Demarest J F, Butini L, Montroni M, Fox C H, Orenstein J M, Kotler D P, Fauci A S. Nature (London) 1993;362:355–358. - PubMed
-
- Lafeuillade A, Tamalet C, Poggi C, Pellegrino P, Tourres C, Izopet J. AIDS. 1997;11:67–72. - PubMed
Publication types
MeSH terms
Substances
Grants and funding
LinkOut - more resources
Full Text Sources
Other Literature Sources
Medical
