

Deciphering a neural code for vision
- PMID: 9356504
- PMCID: PMC25071
- DOI: 10.1073/pnas.94.23.12649
Deciphering a neural code for vision
Abstract
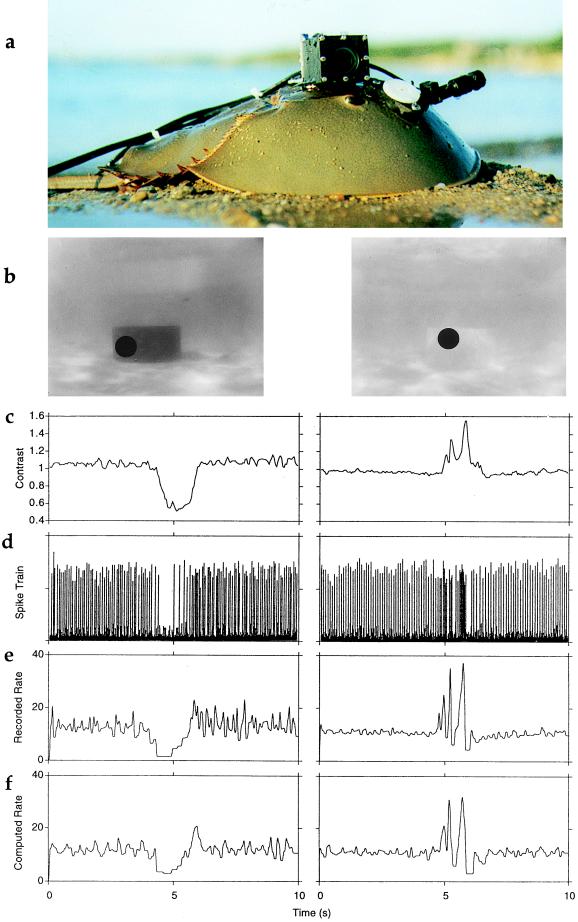
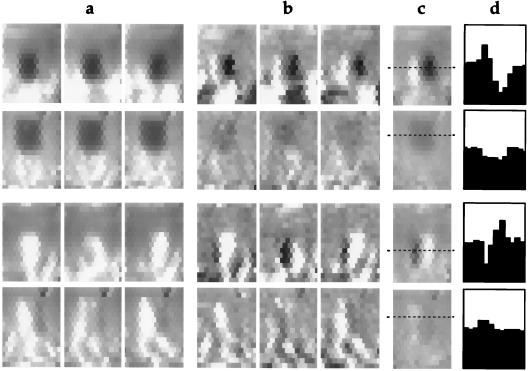
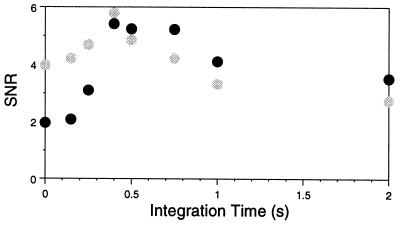
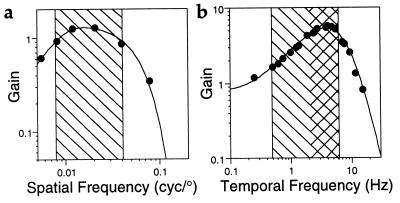
Deciphering the information that eyes, ears, and other sensory organs transmit to the brain is important for understanding the neural basis of behavior. Recordings from single sensory nerve cells have yielded useful insights, but single neurons generally do not mediate behavior; networks of neurons do. Monitoring the activity of all cells in a neural network of a behaving animal, however, is not yet possible. Taking an alternative approach, we used a realistic cell-based model to compute the ensemble of neural activity generated by one sensory organ, the lateral eye of the horseshoe crab, Limulus polyphemus. We studied how the neural network of this eye encodes natural scenes by presenting to the model movies recorded with a video camera mounted above the eye of an animal that was exploring its underwater habitat. Model predictions were confirmed by simultaneously recording responses from single optic nerve fibers of the same animal. We report here that the eye transmits to the brain robust "neural images" of objects having the size, contrast, and motion of potential mates. The neural code for such objects is not found in ambiguous messages of individual optic nerve fibers but rather in patterns of coherent activity that extend over small ensembles of nerve fibers and are bound together by stimulus motion. Integrative properties of neurons in the first synaptic layer of the brain appear well suited to detecting the patterns of coherent activity. Neural coding by this relatively simple eye helps explain how horseshoe crabs find mates and may lead to a better understanding of how more complex sensory organs process information.
Figures
Similar articles
-
Using the horseshoe crab, Limulus Polyphemus, in vision research.J Vis Exp. 2009 Jul 3;(29):1384. doi: 10.3791/1384. J Vis Exp. 2009. PMID: 19578331 Free PMC article.
-
The visual ecology of fiddler crabs.J Comp Physiol A Neuroethol Sens Neural Behav Physiol. 2006 Jan;192(1):1-25. doi: 10.1007/s00359-005-0048-7. Epub 2005 Dec 10. J Comp Physiol A Neuroethol Sens Neural Behav Physiol. 2006. PMID: 16341863 Review.
-
Limulus vision in the marine environment.Biol Bull. 2001 Apr;200(2):169-76. doi: 10.2307/1543311. Biol Bull. 2001. PMID: 11341579 Review.
-
Cell-based model of the Limulus lateral eye.J Neurophysiol. 1998 Oct;80(4):1800-15. doi: 10.1152/jn.1998.80.4.1800. J Neurophysiol. 1998. PMID: 9772240
-
Visual performance of horseshoe crabs day and night.Vis Neurosci. 1991 Sep;7(3):179-89. doi: 10.1017/s0952523800004016. Vis Neurosci. 1991. PMID: 1751413
Cited by
-
Impact of noise on retinal coding of visual signals.J Neurophysiol. 2004 Aug;92(2):1023-33. doi: 10.1152/jn.01089.2003. Epub 2004 Apr 7. J Neurophysiol. 2004. PMID: 15071086 Free PMC article.
-
Processing of natural temporal stimuli by macaque retinal ganglion cells.J Neurosci. 2002 Nov 15;22(22):9945-60. doi: 10.1523/JNEUROSCI.22-22-09945.2002. J Neurosci. 2002. PMID: 12427852 Free PMC article.
-
Ecological expected utility and the mythical neural code.Cogn Neurodyn. 2010 Mar;4(1):25-35. doi: 10.1007/s11571-009-9090-4. Epub 2009 Sep 4. Cogn Neurodyn. 2010. PMID: 19731084 Free PMC article.
-
Using the horseshoe crab, Limulus Polyphemus, in vision research.J Vis Exp. 2009 Jul 3;(29):1384. doi: 10.3791/1384. J Vis Exp. 2009. PMID: 19578331 Free PMC article.
-
The visual ecology of fiddler crabs.J Comp Physiol A Neuroethol Sens Neural Behav Physiol. 2006 Jan;192(1):1-25. doi: 10.1007/s00359-005-0048-7. Epub 2005 Dec 10. J Comp Physiol A Neuroethol Sens Neural Behav Physiol. 2006. PMID: 16341863 Review.
References
-
- Dowling J E. The Retina: An Approachable Part of the Brain. Cambridge, MA: Harvard Univ. Press; 1987.
-
- Rieke F, Warland D, DeRuyter van Steveninck R R, Bialek W. Spikes: Exploring the Neural Code. Cambridge, MA: MIT Press; 1997.
-
- Lettvin Y L, Maturana H R, McColluch W S, Pitts W H. Proc Inst Radio Eng. 1959;47:1940–1951.
-
- Levine J S, MacNichol E F. Sens Processes. 1979;3:95–131. - PubMed
Publication types
MeSH terms
Grants and funding
LinkOut - more resources
Full Text Sources
