. 1997 Nov 17;186(10):1677-87.
doi: 10.1084/jem.186.10.1677.

Regulation of experimental autoimmune encephalomyelitis by natural killer (NK) cells

Affiliations

Regulation of experimental autoimmune encephalomyelitis by natural killer (NK) cells

B Zhang et al. J Exp Med. .

Abstract

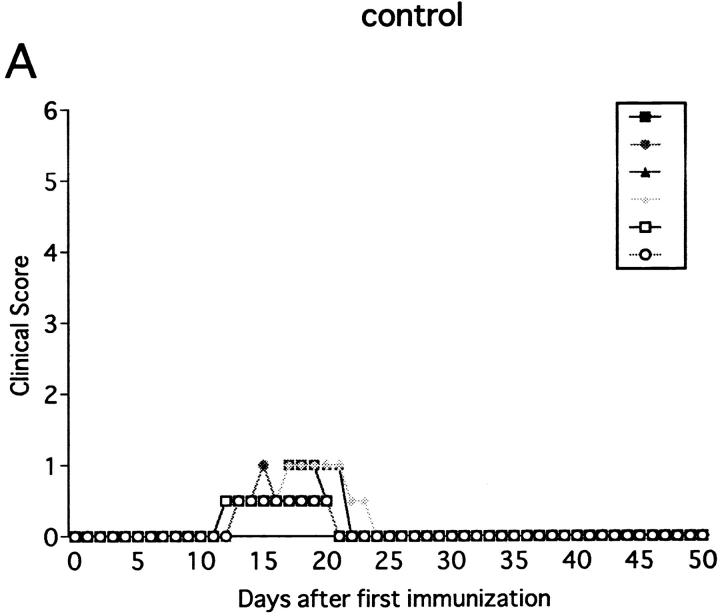
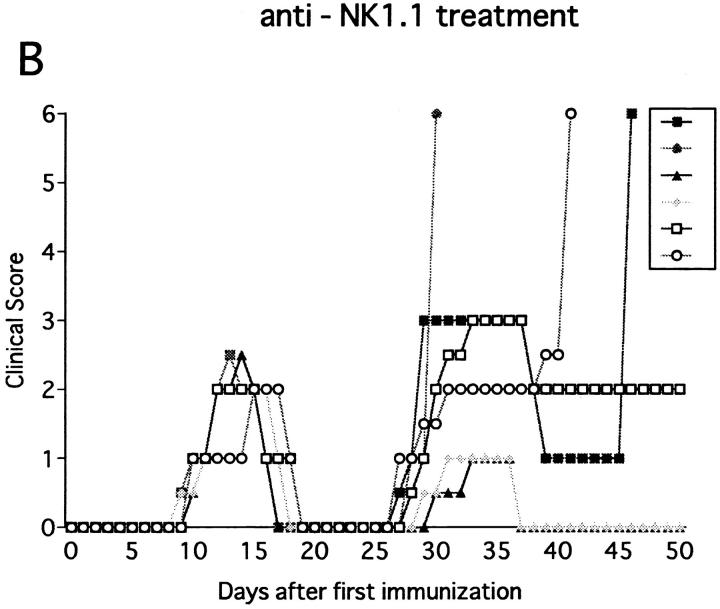
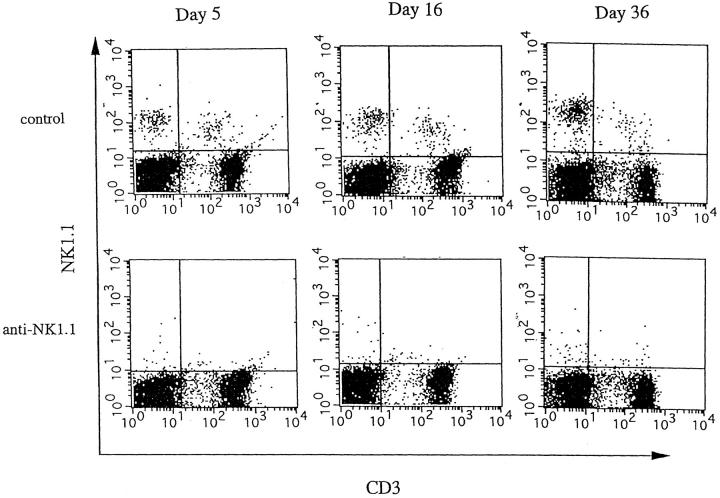
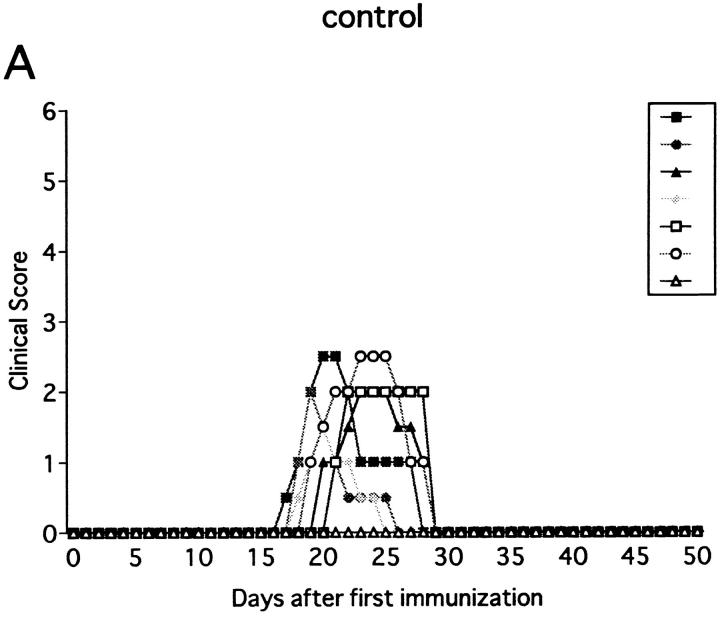
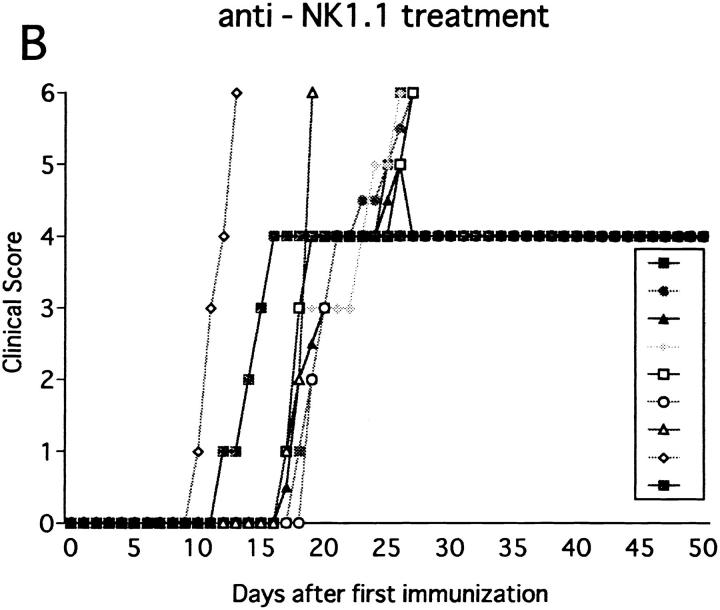
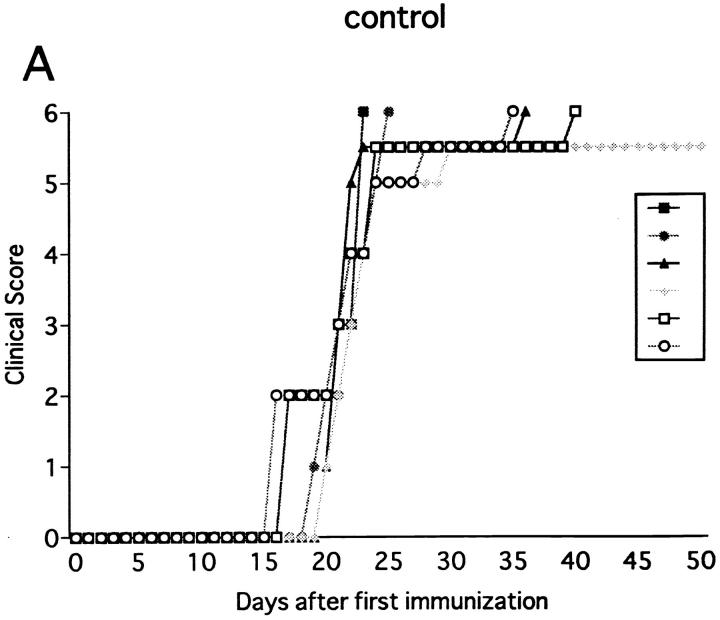
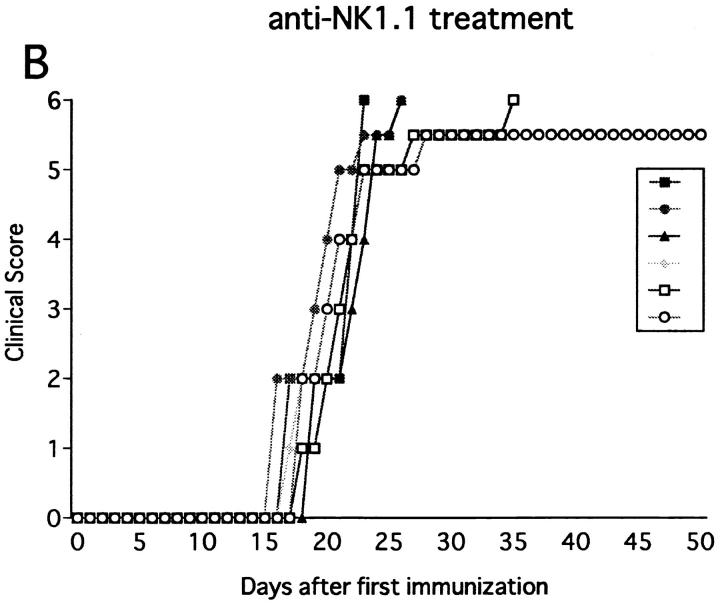
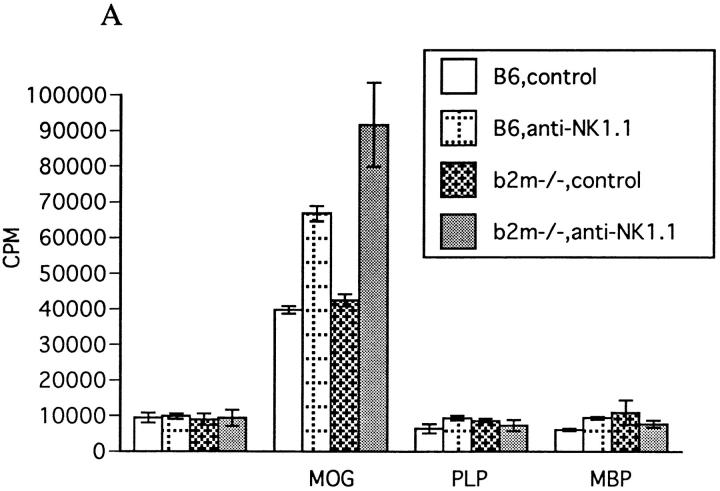
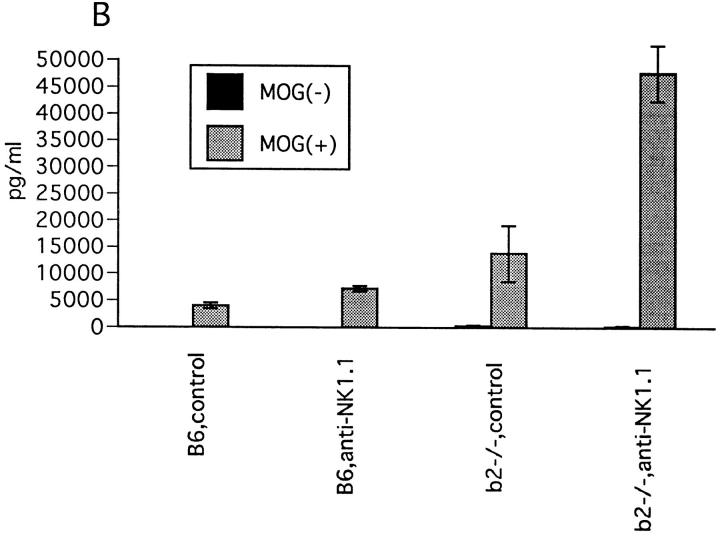
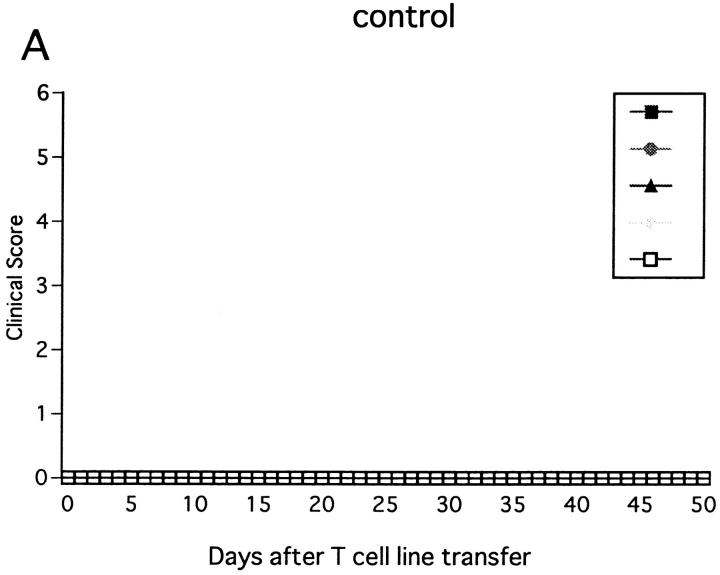
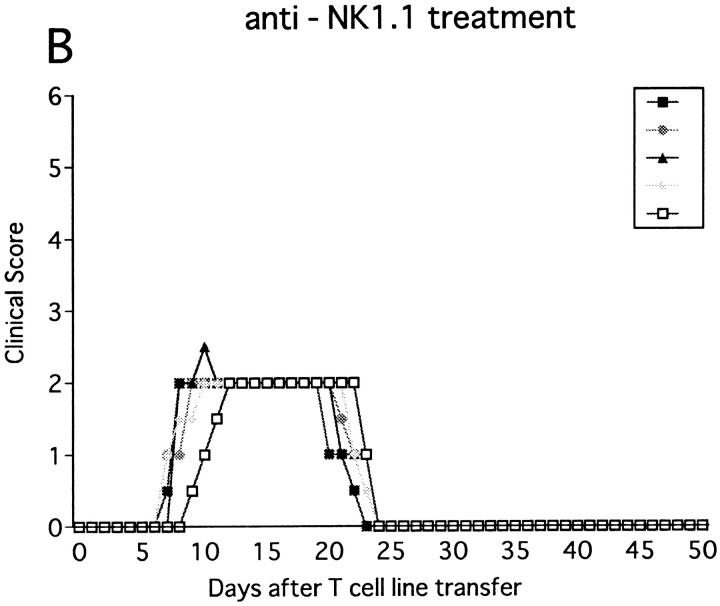
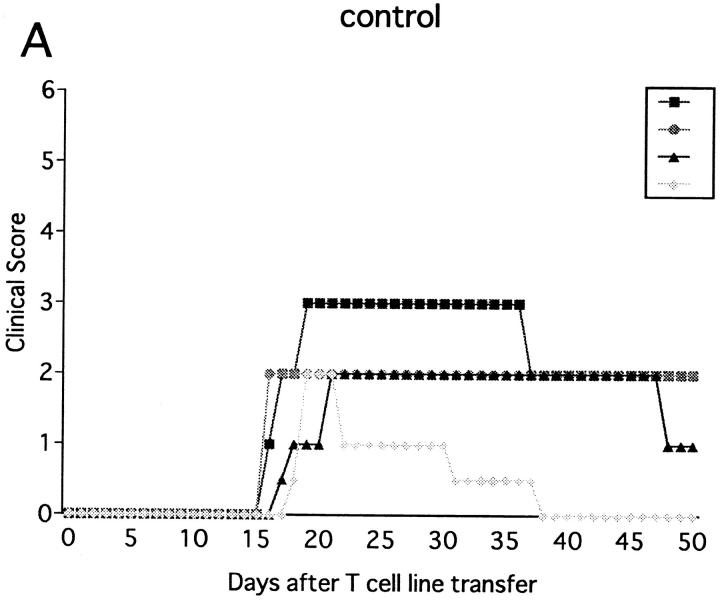
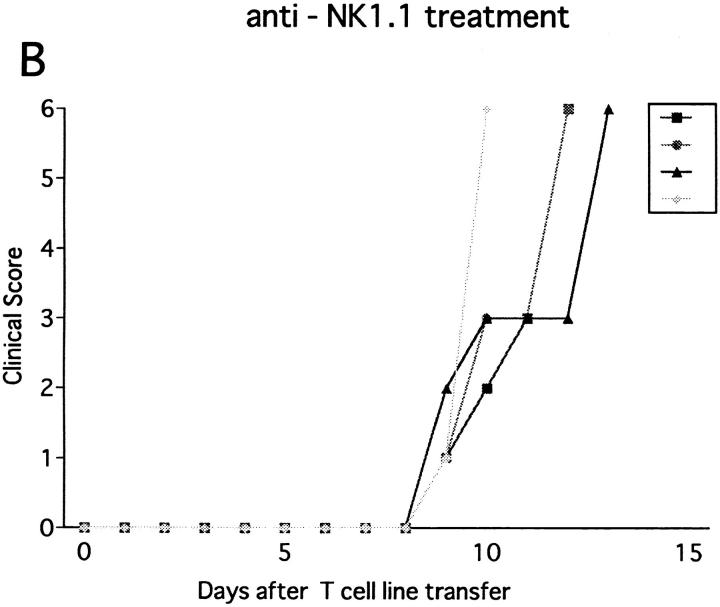
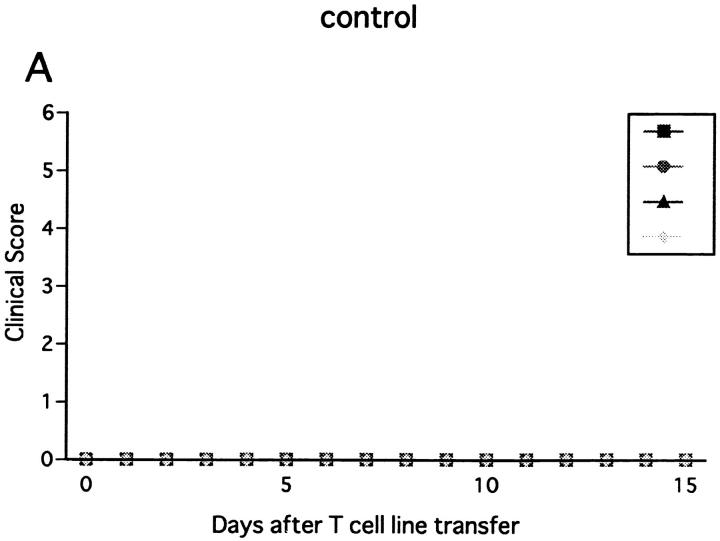
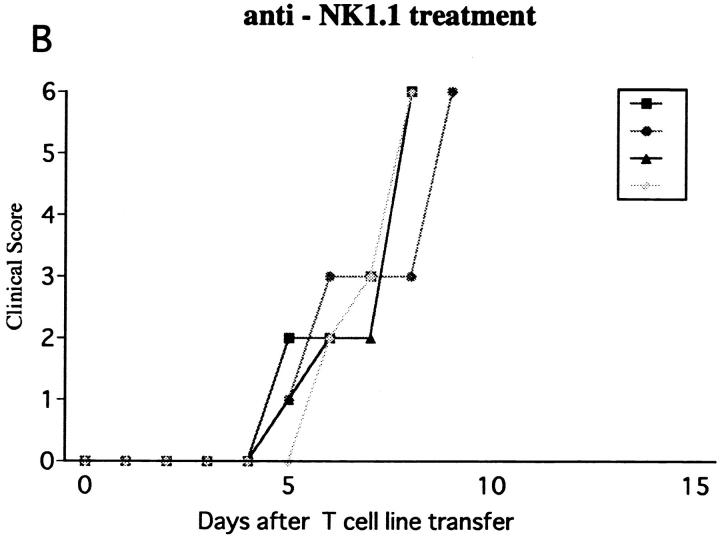
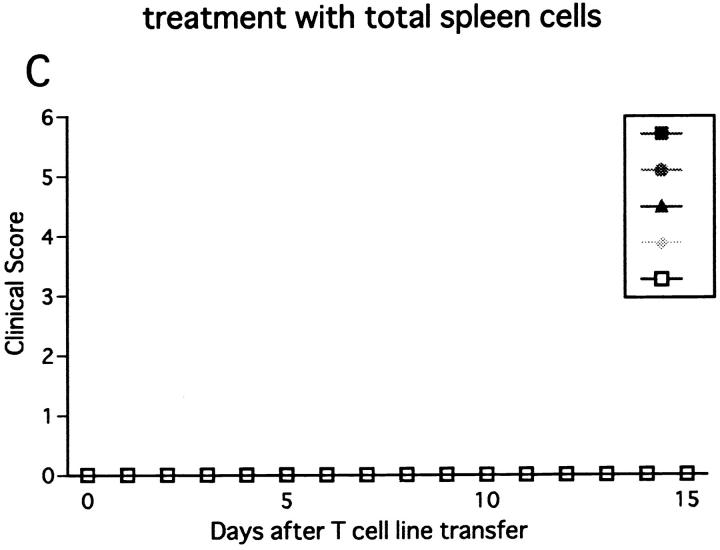
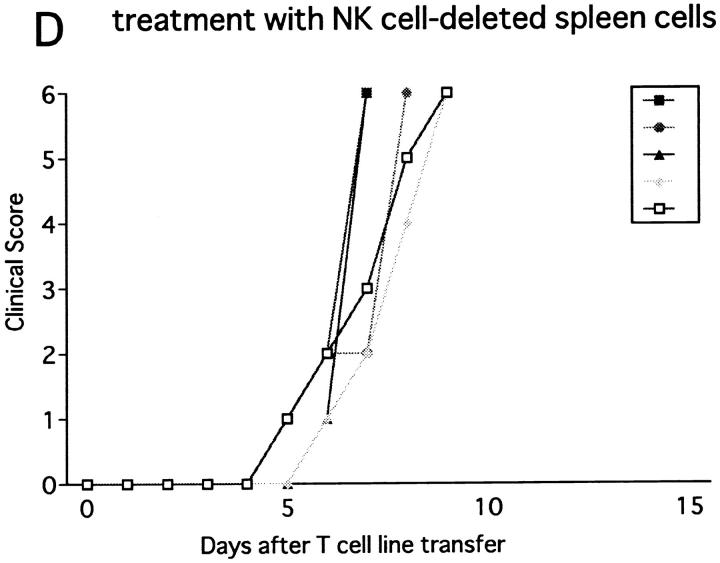
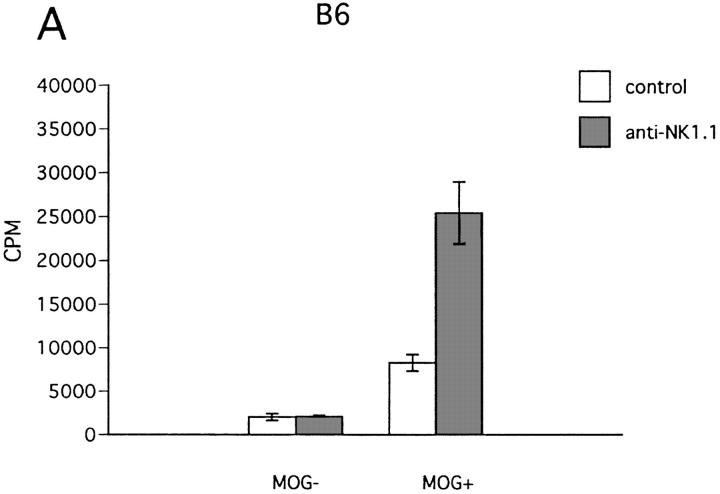
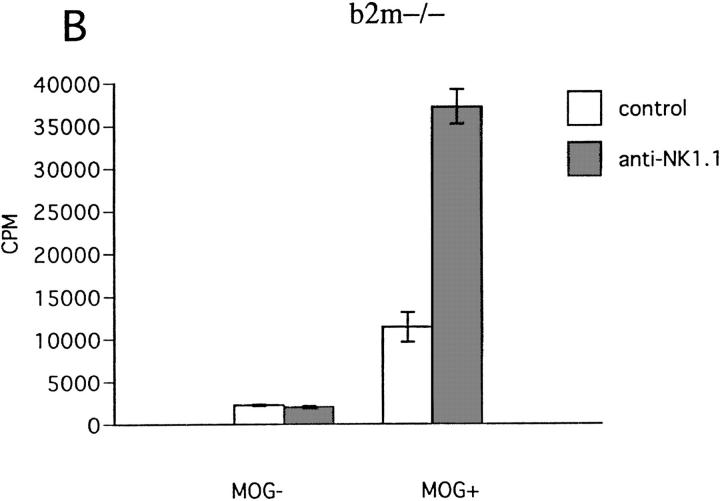
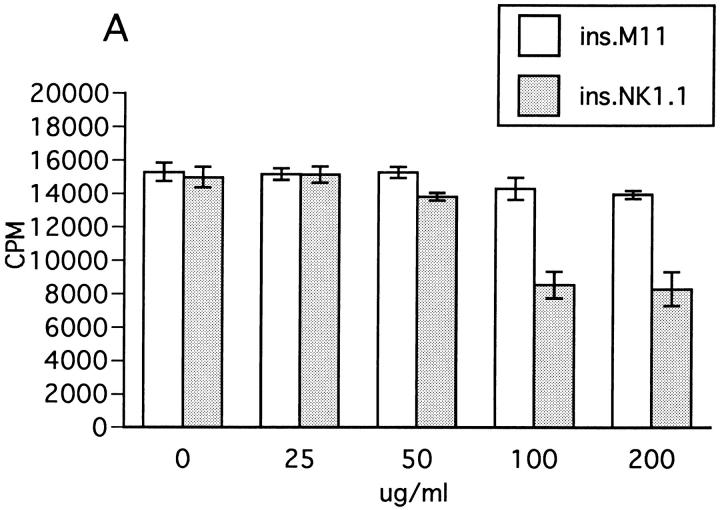
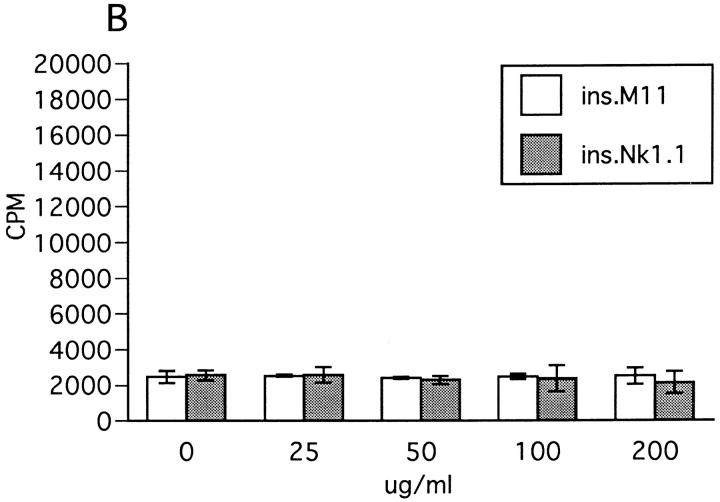
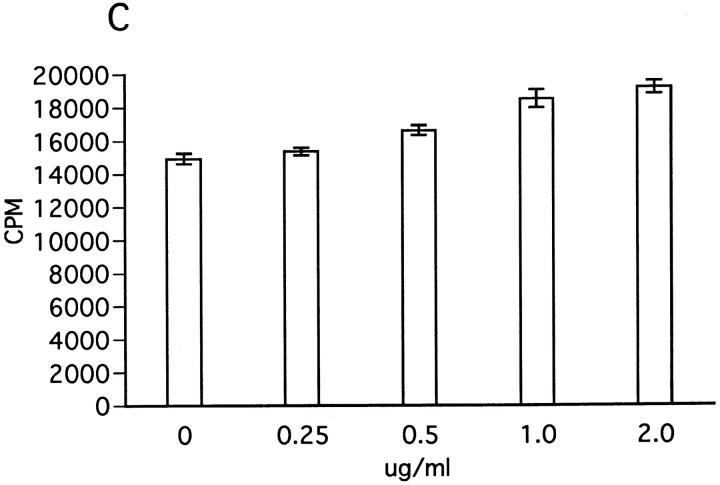
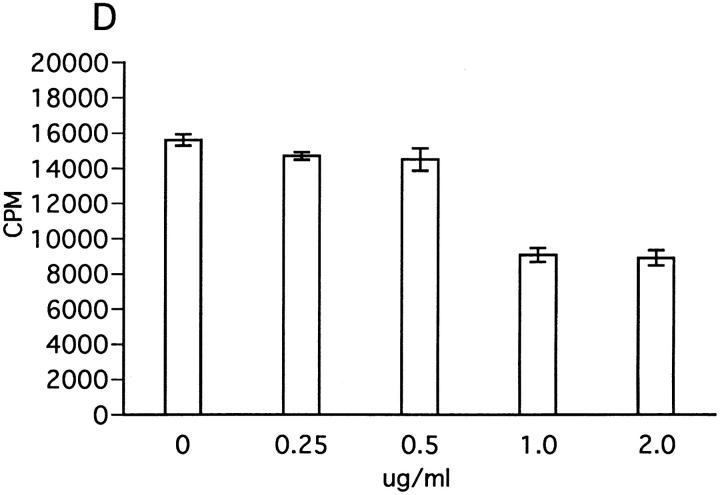
In this report, we establish a regulatory role of natural killer (NK) cells in experimental autoimmune encephalomyelitis (EAE), a prototype T helper cell type 1 (Th1)-mediated disease. Active sensitization of C57BL/6 (B6) mice with the myelin oligodendrocyte glycoprotein (MOG)35-55 peptide induces a mild form of monophasic EAE. When mice were deprived of NK cells by antibody treatment before immunization, they developed a more serious form of EAE associated with relapse. Aggravation of EAE by NK cell deletion was also seen in beta 2-microglobulin-/- (beta 2m-/-) mice, indicating that NK cells can play a regulatory role in a manner independent of CD8+ T cells or NK1.1+ T cells (NK-T cells). The disease enhancement was associated with augmentation of T cell proliferation and production of Th1 cytokines in response to MOG35-55. EAE passively induced by the MOG35-55-specific T cell line was also enhanced by NK cell deletion in B6, beta 2m-/-, and recombination activation gene 2 (RAG-2)-/- mice, indicating that the regulation by NK cells can be independent of T, B, or NK-T cells. We further showed that NK cells inhibit T cell proliferation triggered by antigen or cytokine stimulation. Taken together, we conclude that NK cells are an important regulator for EAE in both induction and effector phases.


Figures

Figure 1
Figure 1
Effect of anti-NK1.1 mAb on MOG35-55 induced EAE in wild-type B6 mice. Mice were immunized two times with the MOG35-55 for EAE induction. They were intravenously injected with PBS, 500 μg of control mAb (M-11; A), or 500 μg of anti-NK1.1 mAb (PK136; B) 1 d before first immunization with the MOG peptide. Clinical score of individual mice at each observation time point is shown by different marks. This is a representative of two experiments with similar results. The result of pretreatment with PBS did not differ significantly from that with control mAb.
Figure 1
Figure 1
Effect of anti-NK1.1 mAb on MOG35-55 induced EAE in wild-type B6 mice. Mice were immunized two times with the MOG35-55 for EAE induction. They were intravenously injected with PBS, 500 μg of control mAb (M-11; A), or 500 μg of anti-NK1.1 mAb (PK136; B) 1 d before first immunization with the MOG peptide. Clinical score of individual mice at each observation time point is shown by different marks. This is a representative of two experiments with similar results. The result of pretreatment with PBS did not differ significantly from that with control mAb.
Figure 2
Figure 2
NK cell deletion by anti-NK1.1 mAb. B6 mice were intraperitoneally injected with 500 μg of control mAb (M-11; top) or 500 μg of anti-NK1.1 mAb (PK136; bottom). On days 5, 16, and 36, the spleen cells were stained with anti-NK1.1-PE and anti-CD3-FITC mAbs. Note the persistent deletion of NK cells (NK1.1+CD3 cells) in the total spleen cells after anti-NK1.1 mAb treatment: 2.68–5.63% in mice treated with control mAb versus 0.3–0.6% in mice treated with anti-NK1.1 mAb.
Figure 3
Figure 3
Effect of anti-NK1.1 mAb on MOG35-55 induced EAE in β2m−/− mice. The mice were immunized two times with MOG35-55 peptide for EAE induction. On the day before first immunization, control mAb (A) or anti-NK1.1 mAb (B) was intravenously injected. This is a representative of three experiments with similar results.
Figure 3
Figure 3
Effect of anti-NK1.1 mAb on MOG35-55 induced EAE in β2m−/− mice. The mice were immunized two times with MOG35-55 peptide for EAE induction. On the day before first immunization, control mAb (A) or anti-NK1.1 mAb (B) was intravenously injected. This is a representative of three experiments with similar results.
Figure 4
Figure 4
Effect of anti-NK1.1 mAb on MOG35-55 induced EAE in IFN-γ−/− mice. The mice were immunized two times with MOG35-55 peptide for EAE induction. 1 d before first immunization, the mice were intravenously injected with control mAb (A) or anti-NK1.1 mAb (B). The result of pretreatment with PBS did not differ from results shown in A or B.
Figure 4
Figure 4
Effect of anti-NK1.1 mAb on MOG35-55 induced EAE in IFN-γ−/− mice. The mice were immunized two times with MOG35-55 peptide for EAE induction. 1 d before first immunization, the mice were intravenously injected with control mAb (A) or anti-NK1.1 mAb (B). The result of pretreatment with PBS did not differ from results shown in A or B.
Figure 5
Figure 5
Effect of NK cell deletion on T cell response to MOG35-55. (A) LN cell proliferative response. 11 d after immunization with MOG35-55, draining LN cells were prepared and their proliferative responses to MOG35-55, PLP136-150 (PLP), and rat myelin basic protein89-101 (MBP) (reference 9) were assayed by a standard method. 1 d before immunization, mice were injected intravenously either with control mAb or with anti-NK1.1 mAb. Data represent mean ± SD of the mean cpm obtained by triplicate cultures in four independent experiments. Each column shows the data of wild-type B6 mice pretreated with control M-11 mAb (B6,control), B6 pretreated with anti-NK1.1 mAb (B6,anti-NK1.1), β2m−/− mice pretreated with control M-11 mAb (b2m−/−, control), and β2m−/− mice pretreated with anti-NK1.1 mAb (b2m−/−, anti-NK1.1). (B) IFN-γ production by LN cells. 11 d after immunization with MOG35-55, the LN cells from control mAb– (control) or anti-NK1.1 mAb– treated (anti-NK1.1) B6 or β2m−/− mice were cultured for 40 h with (MOG+) or without MOG35-55 (MOG−) and the supernatants were collected for measurement of IFN-γ, IL-2, IL-4, and IL-10 by ELISA. Although IL-2, IL-4, and IL-10 were not detectable in this experimental setting, significant production of IFM-γ was measured as shown here. Data represent mean ± SD of the mean value obtained by duplicate assays in four independent experiments.
Figure 5
Figure 5
Effect of NK cell deletion on T cell response to MOG35-55. (A) LN cell proliferative response. 11 d after immunization with MOG35-55, draining LN cells were prepared and their proliferative responses to MOG35-55, PLP136-150 (PLP), and rat myelin basic protein89-101 (MBP) (reference 9) were assayed by a standard method. 1 d before immunization, mice were injected intravenously either with control mAb or with anti-NK1.1 mAb. Data represent mean ± SD of the mean cpm obtained by triplicate cultures in four independent experiments. Each column shows the data of wild-type B6 mice pretreated with control M-11 mAb (B6,control), B6 pretreated with anti-NK1.1 mAb (B6,anti-NK1.1), β2m−/− mice pretreated with control M-11 mAb (b2m−/−, control), and β2m−/− mice pretreated with anti-NK1.1 mAb (b2m−/−, anti-NK1.1). (B) IFN-γ production by LN cells. 11 d after immunization with MOG35-55, the LN cells from control mAb– (control) or anti-NK1.1 mAb– treated (anti-NK1.1) B6 or β2m−/− mice were cultured for 40 h with (MOG+) or without MOG35-55 (MOG−) and the supernatants were collected for measurement of IFN-γ, IL-2, IL-4, and IL-10 by ELISA. Although IL-2, IL-4, and IL-10 were not detectable in this experimental setting, significant production of IFM-γ was measured as shown here. Data represent mean ± SD of the mean value obtained by duplicate assays in four independent experiments.
Figure 6
Figure 6
Effect of NK cell deletion on passive EAE in wild-type B6 mice. After activation with MOG35-55 for 3 d, ZB-1 line cells (3 × 10⁶) were intravenously transferred into wild-type B6 mice pretreated on day −1 with control mAb (A) or with anti-NK1.1 mAb (B). The mice had been x irradiated (450 rad) shortly before cell transfer, and received 500 ng of PT immediately after cell transfer.
Figure 6
Figure 6
Effect of NK cell deletion on passive EAE in wild-type B6 mice. After activation with MOG35-55 for 3 d, ZB-1 line cells (3 × 10⁶) were intravenously transferred into wild-type B6 mice pretreated on day −1 with control mAb (A) or with anti-NK1.1 mAb (B). The mice had been x irradiated (450 rad) shortly before cell transfer, and received 500 ng of PT immediately after cell transfer.
Figure 7
Figure 7
Effect of NK cell deletion on passive EAE in β2m−/− mice. After activation with MOG35-55 for 3 d, ZB-1 line cells (107) were intravenously transferred into β2m−/− mice pretreated on day −1 with control mAb (A) or with anti-NK1.1 mAb (B). The mice had been x irradiated (450 rad) shortly before cell transfer, and received 500 ng of PT immediately after cell transfer.
Figure 7
Figure 7
Effect of NK cell deletion on passive EAE in β2m−/− mice. After activation with MOG35-55 for 3 d, ZB-1 line cells (107) were intravenously transferred into β2m−/− mice pretreated on day −1 with control mAb (A) or with anti-NK1.1 mAb (B). The mice had been x irradiated (450 rad) shortly before cell transfer, and received 500 ng of PT immediately after cell transfer.
Figure 8
Figure 8
Effect of NK cell deletion on passive EAE in RAG-2−/− mice and the treatment with spleen cells. 5 × 10⁵ of activated ZB-1 line cells were intravenously transferred into (A) RAG-2−/− mice pretreated on day −1 with control mAb (A) or with anti-NK1.1 mAb (B, C, and D). The mice were injected with 500 ng PT after cell transfer. Although mice in B did not receive any further manipulation, 2 × 10⁷ of spleen cells from RAG-2−/− mice were intravenously transferred to mice in C on day 2 and the same number of spleen cells from RAG-2−/− mice which had been pretreated with anti-NK1.1 mAb on day −1, were intravenously transferred to mice in D. This is a representative of two experiments with similar results.
Figure 8
Figure 8
Effect of NK cell deletion on passive EAE in RAG-2−/− mice and the treatment with spleen cells. 5 × 10⁵ of activated ZB-1 line cells were intravenously transferred into (A) RAG-2−/− mice pretreated on day −1 with control mAb (A) or with anti-NK1.1 mAb (B, C, and D). The mice were injected with 500 ng PT after cell transfer. Although mice in B did not receive any further manipulation, 2 × 10⁷ of spleen cells from RAG-2−/− mice were intravenously transferred to mice in C on day 2 and the same number of spleen cells from RAG-2−/− mice which had been pretreated with anti-NK1.1 mAb on day −1, were intravenously transferred to mice in D. This is a representative of two experiments with similar results.
Figure 9
Figure 9
Effect of NK cell deletion on antigen-induced proliferation of T line cells. ZB-1 T line cells (4 × 10⁴ cells/well) were stimulated with MOG35-55 in the presence of x irradiated spleen cells (8 × 10⁵ cells/well) from wild-type B6 (A) or β2m−/− mice (B). In each experiment, spleen cells from mice pretreated with control mAb (control) and those pretreated with anti-NK1.1 mAb (anti-NK1.1) were compared in their accessory function. Data represent mean cpm ± SD of triplicate cultures. This is a representative of three experiments with similar results.
Figure 9
Figure 9
Effect of NK cell deletion on antigen-induced proliferation of T line cells. ZB-1 T line cells (4 × 10⁴ cells/well) were stimulated with MOG35-55 in the presence of x irradiated spleen cells (8 × 10⁵ cells/well) from wild-type B6 (A) or β2m−/− mice (B). In each experiment, spleen cells from mice pretreated with control mAb (control) and those pretreated with anti-NK1.1 mAb (anti-NK1.1) were compared in their accessory function. Data represent mean cpm ± SD of triplicate cultures. This is a representative of three experiments with similar results.
Figure 10
Figure 10
Effect of insolubilized anti-NK1.1 mAb, IFN-γ, and anti–IFN-γ on ZB-1 line proliferation. (A) Anti-NK1.1 and control M-11 mAb dissolved in PBS were added into relevant wells at various concentrations (shown in micrograms per milliliter), incubated overnight, and then washed with PBS intensively. ZB-1 line cells (4 × 10⁴/well) were stimulated with MOG35-55 (25 μg/ml) in the presence of irradiated spleen APCs (8 × 10⁵/well) in the wells coated with M-11 (ins. M11) or with anti-NK1.1 mAb (ins.NK1.1). (B) ZB-1 line cells were cultured with spleen cell APCs in the absence of the MOG peptide in the antibody-coated wells in parallel with experiment A. (C) ZB-1 line cells were stimulated with MOG35-55 using spleen APCs in the presence of different concentrations of recombinant mouse IFN-γ (PharMingen). (D) ZB-1 line cells were stimulated with MOG35-55 using spleen APCs in the presence of different concentrations of anti–mouse IFN-γ mAb (PharMingen). All the data represent mean cpm ± SD of triplicate cultures.
Figure 10
Figure 10
Effect of insolubilized anti-NK1.1 mAb, IFN-γ, and anti–IFN-γ on ZB-1 line proliferation. (A) Anti-NK1.1 and control M-11 mAb dissolved in PBS were added into relevant wells at various concentrations (shown in micrograms per milliliter), incubated overnight, and then washed with PBS intensively. ZB-1 line cells (4 × 10⁴/well) were stimulated with MOG35-55 (25 μg/ml) in the presence of irradiated spleen APCs (8 × 10⁵/well) in the wells coated with M-11 (ins. M11) or with anti-NK1.1 mAb (ins.NK1.1). (B) ZB-1 line cells were cultured with spleen cell APCs in the absence of the MOG peptide in the antibody-coated wells in parallel with experiment A. (C) ZB-1 line cells were stimulated with MOG35-55 using spleen APCs in the presence of different concentrations of recombinant mouse IFN-γ (PharMingen). (D) ZB-1 line cells were stimulated with MOG35-55 using spleen APCs in the presence of different concentrations of anti–mouse IFN-γ mAb (PharMingen). All the data represent mean cpm ± SD of triplicate cultures.

References

    1. Experimental allergic encephalomyelitis: a useful model for multiple sclerosis. 1984. E.C. Alvord, Jr., M.W. Kies, and A.J. Suckling, editors. Alan R. Liss, New York.
    1. Tabira, T., and J. Kira. 1992. Strain and species differences of encephalitogenic determinants of myelin basic protein and proteolipid apoprotein. In Myelin: Biology and Chemistry. R.E. Martenson, editor. CRC Press Inc., Boca Raton, FL. 783–799.
    1. Kumar V, Sercarz EE. The involvement of T cell receptor peptide-specific regulatory CD4+T cells in recovery from antigen-induced autoimmune disease. J Exp Med. 1993;178:909–916. - PMC - PubMed
    1. Chen Y, Kuchroo VK, Inobe J-I, Hafler DA, Weiner HL. Regulatory T cell clones induced by oral tolerance: suppression of autoimmune encephalomyelitis. Science (Wash DC) 1994;265:1237–1240. - PubMed
    1. Sun D, Ben-Nun A, Wekerle H. Regulatory circuits in autoimmunity: recruitment of counter-regulatory CD8+ T cells by encephalitogenic CD4+T line cells. Eur J Immunol. 1988;18:1993–1999. - PubMed

Publication types

MeSH terms