. 1997 Nov 17;186(10):1713-24.
doi: 10.1084/jem.186.10.1713.

Regulation of ZAP-70 intracellular localization: visualization with the green fluorescent protein

Affiliations

Regulation of ZAP-70 intracellular localization: visualization with the green fluorescent protein

J Sloan-Lancaster et al. J Exp Med. .

Abstract

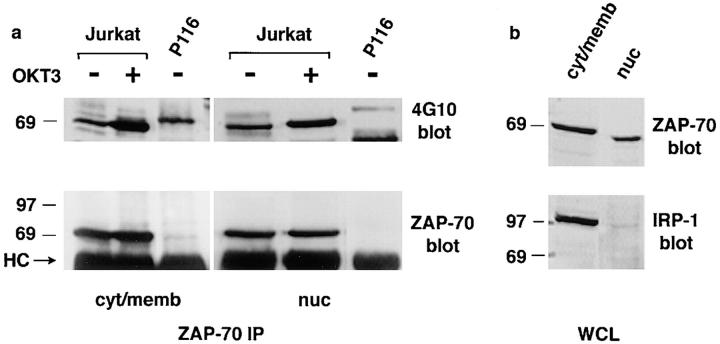
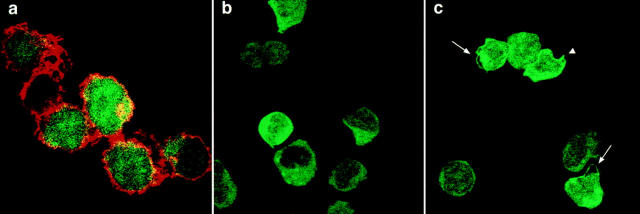
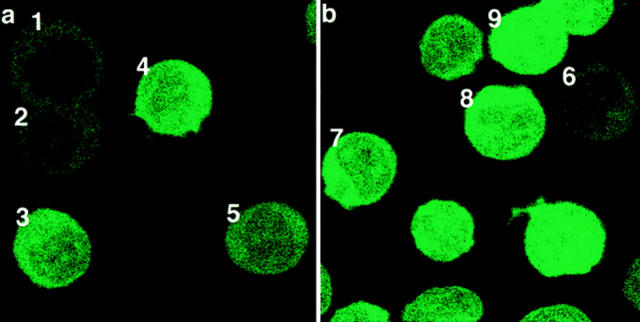
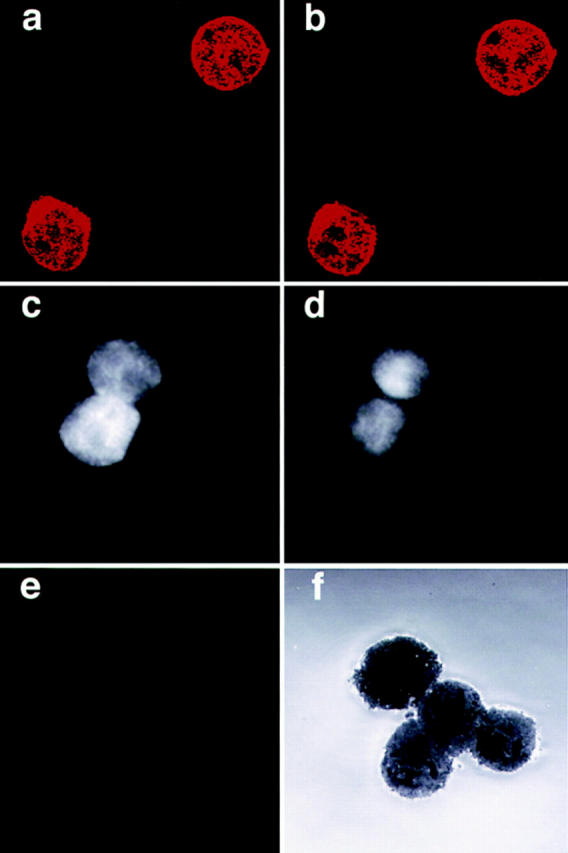
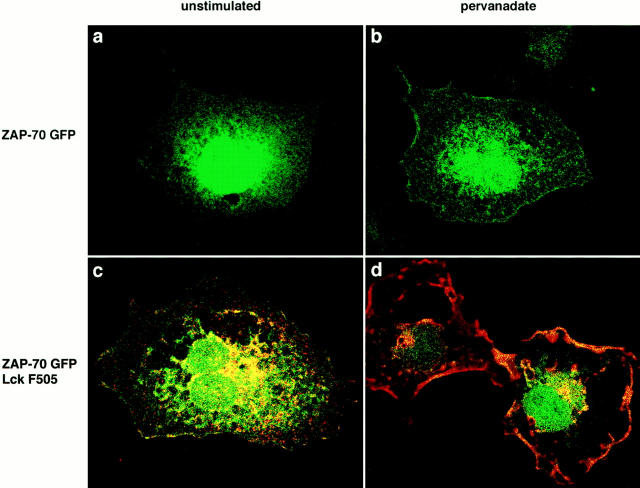
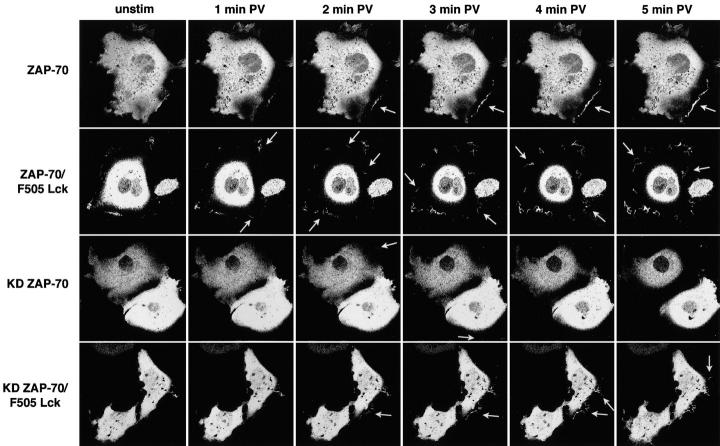
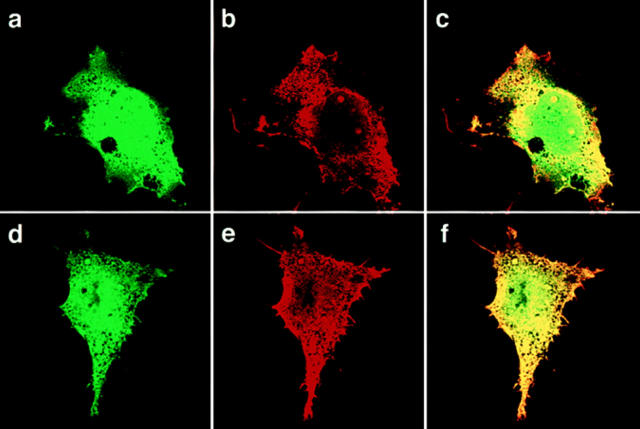
To investigate the cellular dynamics of ZAP-70, we have studied the distribution and regulation of its intracellular location using a ZAP-70 green fluorescent protein chimera. Initial experiments in epithelial cells indicated that ZAP-70 is diffusely located throughout the quiescent cell, and accumulates at the plasma membrane upon cellular activation, a phenotype enhanced by the coexpression of Lck and the initiation of ZAP-70 kinase activity. Subsequent studies in T cells confirmed this phenotype. Intriguingly, a large amount of ZAP-70, both chimeric and endogenous, resides in the nucleus of quiescent and activated cells. Nuclear ZAP-70 becomes tyrosine phosphorylated upon stimulation via the T cell receptor, indicating that it may have an important biologic function.


Figures

Figure 9
Figure 9
Biochemical isolation of ZAP-70 from nuclei of Jurkat cells, and demonstration of its increased tyrosine phosphorylation after anti-TCR stimulation. (a) Cytosol/membrane (1.2 × 10⁷ cells) and nuclear fractions (2.6 × 10⁷ cells) of Jurkat or P116 cells, immunoprecipitated with anti–ZAP-70, were analyzed by antiphosphotyrosine Western blotting (top). The stripped membrane was reprobed with anti–ZAP-70 (bottom). Specific activity of ZAP-70 after cellular stimulation was 2.4 for cytosolic/membrane ZAP-70 and 1.4 for nuclear ZAP-70. A nonspecific band appears in the 4G10 blot of P116 cells, which migrates more slowly than the phosphorylated ZAP-70. (b) Whole lysate samples from the purified material (6 × 10⁵ cells/lane) was immunoblotted with anti–ZAP-70, and then reprobed with anti–IRP-1. Densitometric analysis confirmed that there was a 5.3 fold enrichment of ZAP-70 in the nuclear fraction as compared to IRP-1. This was confirmed in 3 independent experiments, with enrichment of ZAP-70 as compared to IRP-n1 ranging from 5 fold to 6.2 fold.
Figure 5
Figure 5
Intracellular location of ZAP-70 GFP in stably transfected P116 T cells, and its movement to the plasma membrane upon cellular activation. (a) Nuclear expression of ZAP-70 GFP in P116/2G1 cells is highlighted by the nucleolar exclusion pattern. Endogenous Lck, stained with anti-Lck and a rhodamine-coupled secondary mAb, is entirely extranuclear in all cells, and areas of yellow indicate the cytosolic colocalization of ZAP-70 GFP and Lck. (b and c) P116/2G1 cells were left untreated (b) or stimulated with F(ab′)2 of OKT3 for 2 min at 37°C (c). Arrows and arrowheads indicate peripheral rims and membrane blebs of ZAP-70 GFP, respectively (c).
Figure 6
Figure 6
Quantitation of nuclear ZAP-70 GFP, and its relationship to expression levels, in individual cells of stably transfected P116 subclones. The middle section from a complete Z series of 0.5 μM optical sections through a field of F4 (a) and H9 (b) subclones is shown. Numbered cells correlate with the corresponding quantitation analyses reported in (c) for F4 and (d) for H9. Mean pixel intensity throughout individual cells is reported as a method to accurately compare GFP expression levels between cells. Percent nuclear ZAP-70 GFP was determined as described in Materials and Methods.
Figure 6
Figure 6
Quantitation of nuclear ZAP-70 GFP, and its relationship to expression levels, in individual cells of stably transfected P116 subclones. The middle section from a complete Z series of 0.5 μM optical sections through a field of F4 (a) and H9 (b) subclones is shown. Numbered cells correlate with the corresponding quantitation analyses reported in (c) for F4 and (d) for H9. Mean pixel intensity throughout individual cells is reported as a method to accurately compare GFP expression levels between cells. Percent nuclear ZAP-70 GFP was determined as described in Materials and Methods.
Figure 7
Figure 7
Identification of endogenous ZAP-70 in the nucleus of Jurkat cells by IF staining. Jurkat (a, b, c, and d) and P116 (e and f ) cells were stained with affinity-purified anti–ZAP-70 antiserum. 0.5 μM slices through the middle of the cells are displayed (a, b, e, and f ). Two 0.5 μM slices, 1 μM apart, are shown for anti–ZAP-70–stained Jurkat cells (a and b), and one for P116 cells (e). An image of the same field as in e, using the reflector optics, indicates the specificity of the Ab stain (f ). The nuclear staining of the anti–ZAP-70 is further verified by colocalization of anti– ZAP-70 (c) with the Hoechst DNA stain (d) in the same cells.
Figure 2
Figure 2
ZAP-70 GFP expression and cellular location in Cos 7 cells. Cos 7 cells expressing pEGFP/ZAP-70 alone (a and b) or together with pSXSRαLck F505 (c and d) were left untreated (a and c) or stimulated with pervanadate for 1 (d) or 3 min (b). Coverslips were mounted directly (a and b) or after first staining with anti-Lck (c and d). The optical sections of a complete Z series were then projected to produce the composite single (a and b) or dual (c and d) color images shown (green, ZAP-70 GFP fusion protein; red, immunostain of Lck F505). Areas of yellow represent colocalization of ZAP-70 GFP and Lck F505 (c and d).
Figure 1
Figure 1
In vitro functional activity and apparent molecular weight of the ZAP-70 GFP fusion protein. (a) Schematic of the ZAP-70 GFP fusion protein, showing the position of the GFP (F64L, S65T) molecule at the COOH terminus of ZAP-70, with a predicted molecular weight of ∼97 kD. (b) Cos 7 cells expressing pEGFP/ZAP-70 and pSXSRαLck F505, were incubated for 10 min with or without PV as indicated. Immunoprecipitation of lysed cells was performed with either anti– ZAP-70 antiserum or A2B4 mAb, and the phosphorlyated proteins from an in vitro kinase assay analyzed (top). An anti–ZAP-70 Western blot of the same membrane is shown (bottom).
Figure 1
Figure 1
In vitro functional activity and apparent molecular weight of the ZAP-70 GFP fusion protein. (a) Schematic of the ZAP-70 GFP fusion protein, showing the position of the GFP (F64L, S65T) molecule at the COOH terminus of ZAP-70, with a predicted molecular weight of ∼97 kD. (b) Cos 7 cells expressing pEGFP/ZAP-70 and pSXSRαLck F505, were incubated for 10 min with or without PV as indicated. Immunoprecipitation of lysed cells was performed with either anti– ZAP-70 antiserum or A2B4 mAb, and the phosphorlyated proteins from an in vitro kinase assay analyzed (top). An anti–ZAP-70 Western blot of the same membrane is shown (bottom).
Figure 3
Figure 3
Effects of F505 Lck and cellular stimulation on the kinetics of plasma membrane acquisition of ZAP-70 GFP and KD ZAP-70 GFP. Individual live Cos 7 cells were examined by confocal microscopy and plasma membrane acquisition of ZAP-70 GFP assessed as described in Materials and Methods. A single image of each cell is shown before activation (unstim) with subsequent images shown at 1-min intervals after the addition of PV. Arrows highlight specific areas of plasma membrane accumulation of the ZAP-70 GFP fusion proteins.
Figure 4
Figure 4
Quantitation and functional reconstitution analyses of ZAP-70 GFP in stably transfected P116 subclones. (a) Cell lysates of Jurkat, P116, or P116/ ZAP-70 GFP subclones were immunoprecipitated with anti– ZAP-70. Immunoprecipitated proteins were analyzed by SDS-PAGE and Western blot using anti–ZAP-70 (2 × 10⁶ cells/ lane). Levels of ZAP-70 GFP expression in each subclone, presented as a percent of endogenous ZAP-70 in Jurkat cells, were as follows: 97% for C8, 143% for C11, 131% for H9, and 94% for F4. (b) Cells were lysed directly or first stimulated for 2 min with OKT3 F(ab′)2 at 37°C, and antiphosphotyrosine Western blot analysis of whole cellular lysates (2 × 10⁵ cells/lane) performed.
Figure 8
Figure 8
Demonstration of inaccessibility of Abs to nuclei. Cos 7 cells, expressing ZAP-70 GFP, were immunostained with anti-GFP (a–c) or anti–ZAP-70 (d–f ). ZAP-70 GFP (a and d), Ab signals (b and e) and the dual-color overlays (c and f ) are shown for a 0.5 μM slice through an individual cell stained with either anti-GFP (a–c) or anti–ZAP-70 (d–f ).

References

    1. Samelson LE, Klausner RD. Tyrosine kinases and tyrosine-based activation motifs. J Biol Chem. 1992;267:24913–24916. - PubMed
    1. Weiss A, Littman DR. Signal transduction by lymphocyte antigen receptors. Cell. 1994;76:263–274. - PubMed
    1. Iwashima M, Irving BA, van Oers NSC, Chan AC, Weiss A. Sequential interactions of the TCR with two distinct cytoplasmic tyrosine kinases. Science (Wash DC) 1994;263:1136–1139. - PubMed
    1. van Oers NS, Killeen N, Weiss A. Lck regulates the tyrosine phosphorylation of the T cell receptor subunits and ZAP-70 in murine thymocytes. J Exp Med. 1996;183:1053–1062. - PMC - PubMed
    1. Pawson T. Protein modules and signalling networks. Nature (Lond) 1995;373:573–580. - PubMed

Publication types

MeSH terms