. 1997 Dec 1;17(23):8927-36.
doi: 10.1523/JNEUROSCI.17-23-08927.1997.

Knock-out mice reveal a critical antiepileptic role for neuropeptide Y

Affiliations

Knock-out mice reveal a critical antiepileptic role for neuropeptide Y

S C Baraban et al. J Neurosci. .

Abstract

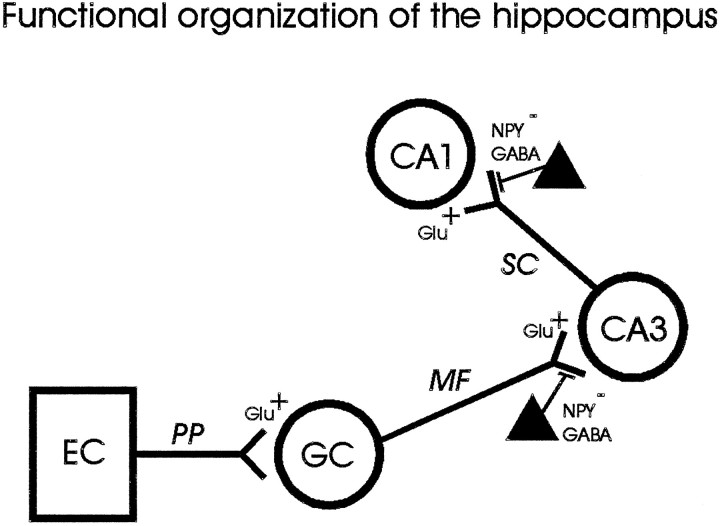
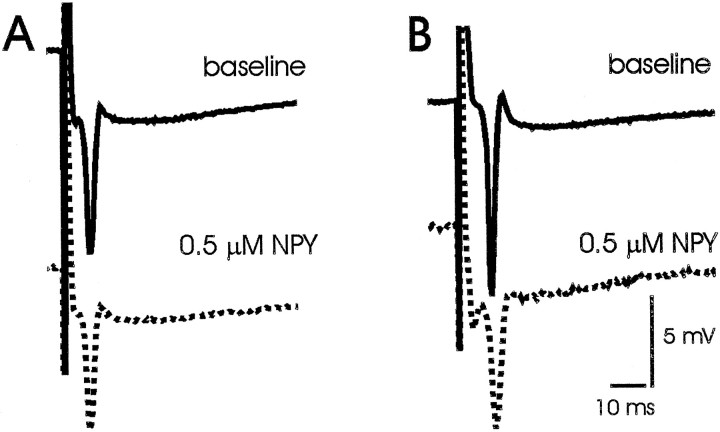
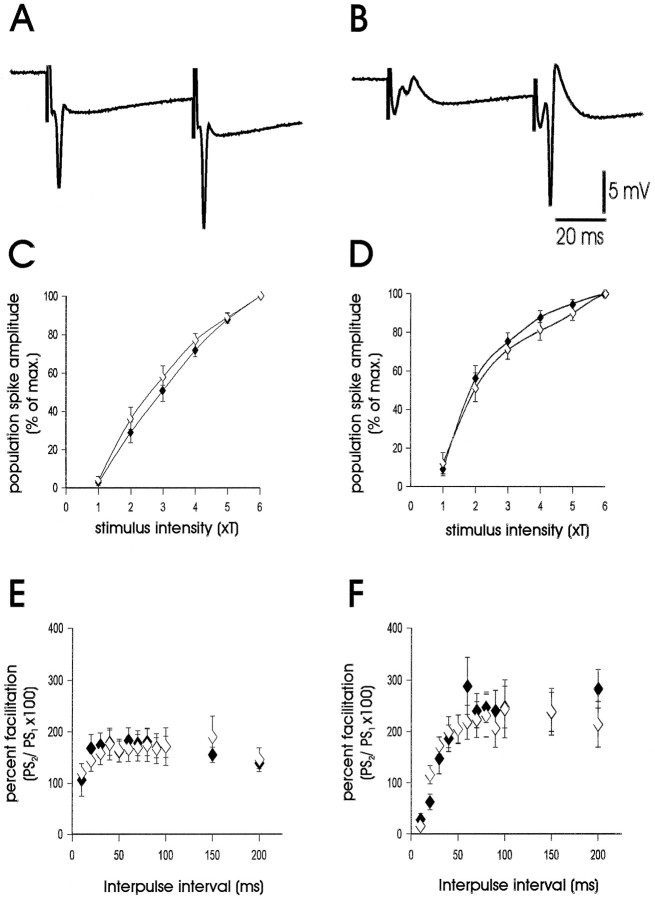
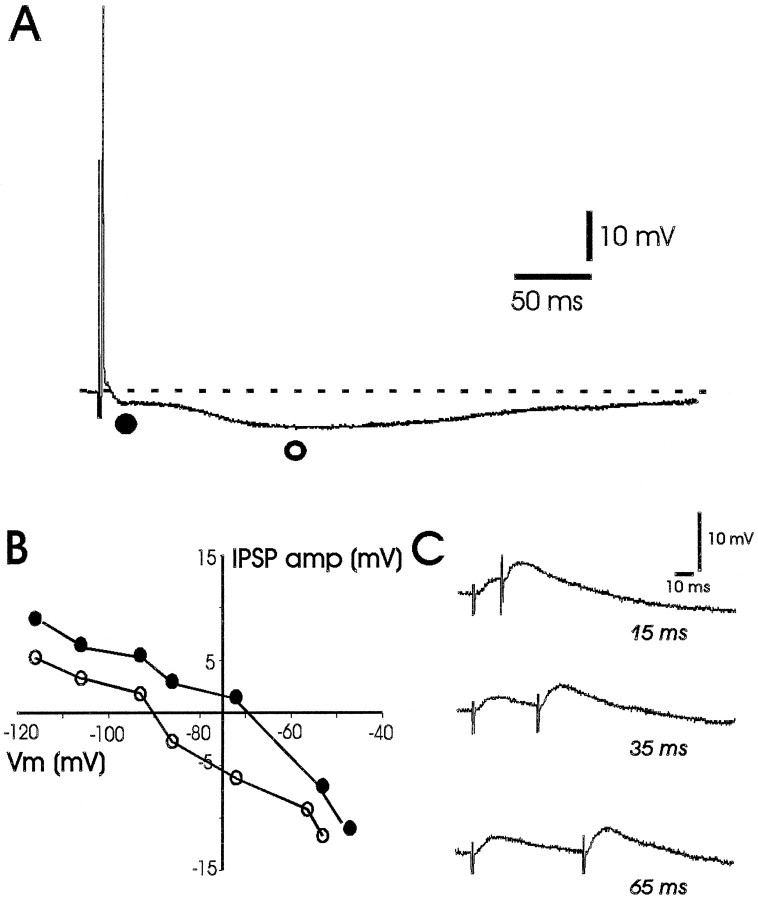
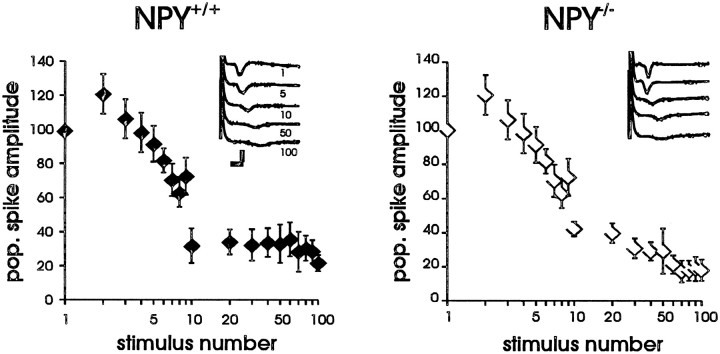
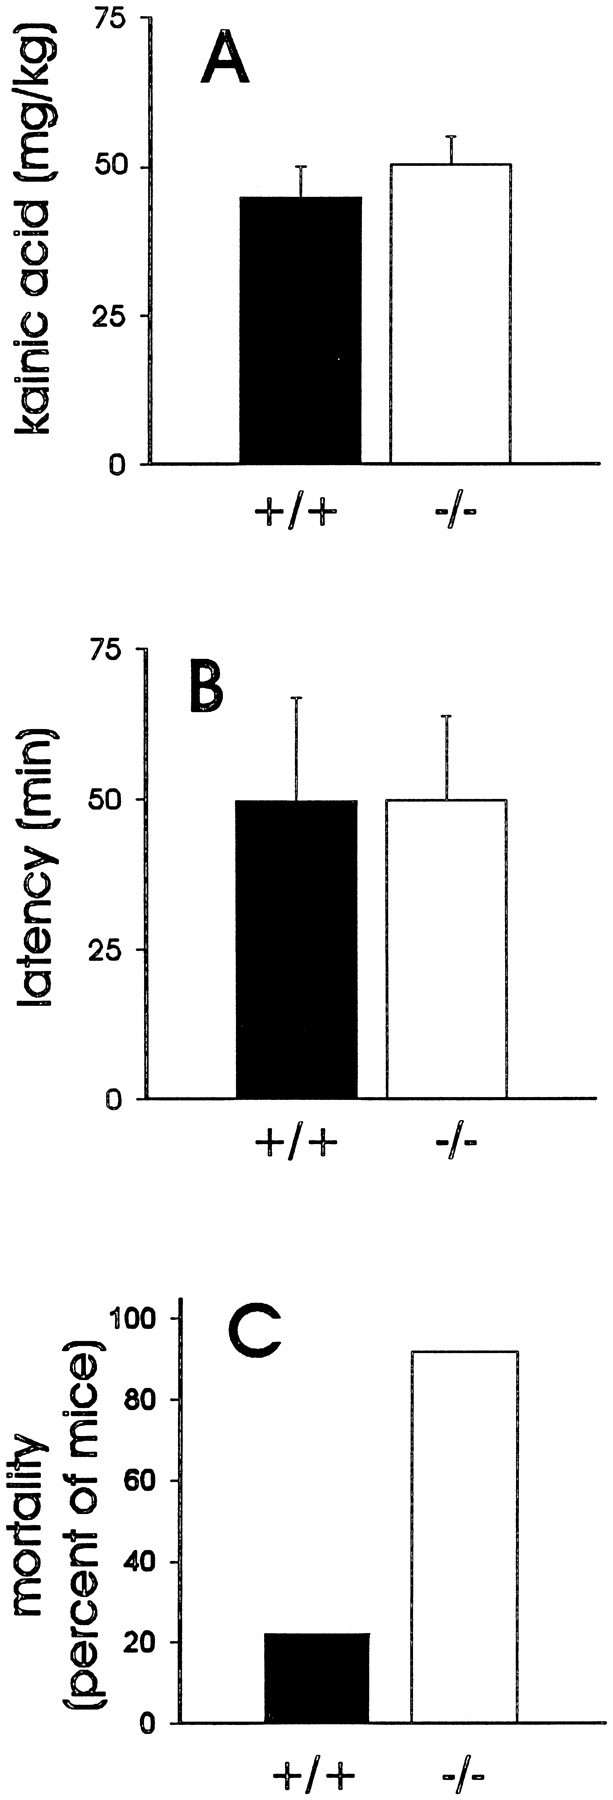
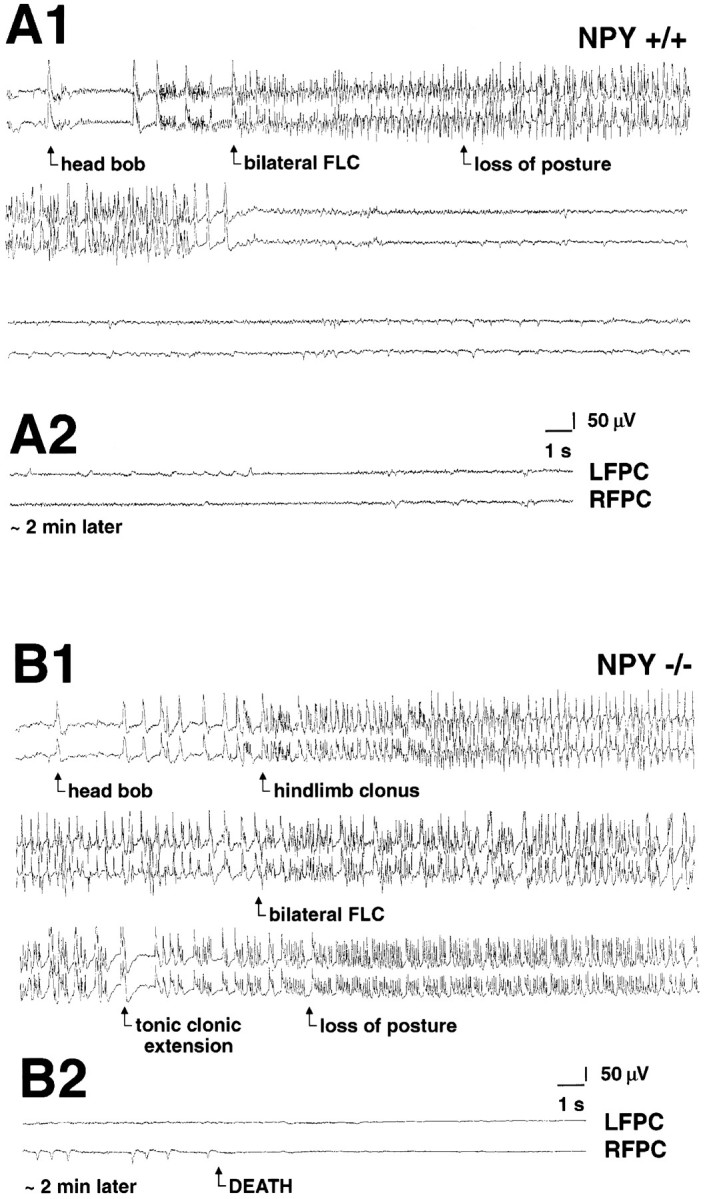
Neuropeptide Y (NPY) inhibits excitatory synaptic transmission in the hippocampus and is implicated in control of limbic seizures. In the present study, we examined hippocampal function and the response to pharmacologically induced seizures in mutant mice lacking this peptide. In slice electrophysiology studies, no change in normal hippocampal function was observed in NPY-deficient mice compared with normal wild-type littermates. Kainic acid (KA) produced limbic seizures at a comparable latency and concentration in NPY-deficient mice compared with littermates. However, KA-induced seizures progressed uncontrollably and ultimately produced death in 93% of NPY-deficient mice, whereas death was rarely observed in wild-type littermates. Intracerebroventricular NPY infusion, before KA administration, prevented death in NPY-deficient mice. These results suggest a critical role for endogenous NPY in seizure control.


Figures

Fig. 1.
Fig. 1.
Schematic representation of the hippocampal trisynaptic circuit. Feed-forward excitation enters the hippocampus from the entorhinal cortex (EC) via the perforant path (PP); glutamatergic granule cells (GC) in the dentate gyrus make excitatory synaptic connections ontoCA3 pyramidal neurons via mossy fibers (MF); and glutamatergic CA3pyramidal neurons make excitatory synaptic connections ontoCA1 pyramidal neurons via the Schaffer collaterals (SC). Interneurons containing NPY and GABA (filled triangles) are thought to inhibit excitation by acting at presynaptic sites to reduce excitatory neurotransmitter release at mossy fiber–CA3 and Schaffer collateral–CA1 synapses in the hippocampus.
Fig. 4.
Fig. 4.
Effect of exogenous NPY on synaptic responses in mouse hippocampus. A, Representative CA1 field recording during stimulation of Schaffer collaterals in a hippocampal slice from an NPY+/+ mouse in normal recording medium (baseline) and ∼20 min after bath application of neuropeptide Y (0.5 μm NPY). B, Representative CA1 field recording during stimulation of Schaffer collaterals in a hippocampal slice from an NPY−/−mouse in normal recording medium (baseline) and ∼20 min after bath application of neuropeptide Y (0.5 μmNPY).
Fig. 2.
Fig. 2.
Characterization of synaptic function in hippocampal slices. A, Representative population spike response in the CA1 pyramidal cell region in a hippocampal slice from an NPY−/− mouse. Schaffer collaterals were stimulated at 4 × threshold (T) for generation of a population spike. B, Representative population spike response in the GC region in a hippocampal slice from an NPY−/− mouse. The perforant path was stimulated at 4 × threshold for generation of a population spike. Stimulation protocols elicited typical paired-pulse facilitation of the second population spike response at both Schaffer collateral–CA1 (A) and perforant path–GC synapses (B). Stimulus artifacts are clipped in bothtraces. C, Input–output curves of population spike responses recorded in the CA1 pyramidal cell region (st. pyramidale) to stimulation of the Schaffer collaterals. Threshold for stimulation was defined for each slice as the minimum current required to elicit a detectable population spike (PS); the x-axis shows stimulus intensity in terms of threshold multiples. Responses are normalized with respect to maximumPS amplitude to allow averaging of responses from all slices from NPY-deficient animals (closed diamonds;n = 15) and all slices from littermate wild-type animals (open diamonds; n = 15). The values represent the mean ± SEM. D, Input–output curves of population spike responses recorded in the dentate GC body layer to stimulation of the perforant path. E, Plot of paired-pulse facilitation (amplitude of PS response to second stimulus divided by amplitude of population spike response to first stimulus) in the CA1 pyramidal cell region for hippocampal slices from NPY-deficient (closed diamonds;n = 11) and littermate wild-type control (open diamonds; n = 12) mice; stimulus intensity was at 4× threshold. F, Plot of paired-pulse facilitation in the GC region of hippocampal slices from NPY-deficient and littermate wild-type control mice.
Fig. 3.
Fig. 3.
Intracellular synaptic response in a CA1 pyramidal neuron from an NPY−/− mouse. A, Representative intracellular recording from a CA1 pyramidal neuron (resting membrane potential = −64 mV) during Schaffer collateral stimulation. Note the presence of an EPSP followed by a biphasic IPSP with fast (closed circle) and slow (open circle) components. B, Reversal potential plot of the fast and slow IPSPs for this CA1 pyramidal neuron. Reversal potentials were determined by systematically changing the membrane potential via intrasomatic current injection, evoking IPSPs at a stimulation intensity subthreshold for generation of an action potential and measuring the amplitude and polarity of the resulting IPSP at the time points indicated in A(open and closed circles). Vm, Membrane voltage. C, Intracellular response to paired-pulse stimulation of the Schaffer collaterals for this CA1 pyramidal neuron. Note the presence of paired-pulse facilitation of the EPSP at interpulse intervals between 15 and 65 msec.
Fig. 5.
Fig. 5.
Effect of high frequency stimulation on synaptic responses. Plots of the response to high frequency tetanic stimulation (100 pulses at 50 Hz; stimulation at 4× threshold) in the CA1 pyramidal cell region of wild-type (NPY+/+) and NPY-deficient (NPY−/−) mice. They-axis shows population spike amplitude plotted as the percent of initial response (normalized to 100%). Representative extracellular field recordings are shown in insets. Calibration, 5 mV, 20 msec.
Fig. 6.
Fig. 6.
Response to pharmacologically induced seizure activity. A, Plot of the concentration of kainic acid required to elicit a full behavioral seizure in littermate wild-type control mice (closed bar;n = 9) or NPY-deficient mice (open bar; n = 13). B, Plot of the latencies to first forelimb clonus in wild-type and NPY-deficient mice. Bars in A andB show the mean ± SEM. C, Plot of the percent mortality in littermate wild-type and NPY-deficient mice after kainic acid administration (20–100 mg/kg, i.p.).
Fig. 7.
Fig. 7.
Electrographic activity during a kainate-induced seizure. A1, Representative electrographic (EEG) traces recorded from a wild-type mouse [top, left frontoparietal cortex (LFPC); bottom, right frontoparietal cortex (RFPC)] during a kainic acid-induced seizure (duration, 43 sec). EEG tracing was taken at ∼50 min after the first injection of kainic acid. A2, Same animal ∼2 min later (traces as described inA1). Note the termination of seizure activity and restoration of normal EEG activity. B1, Representative EEG traces recorded from a NPY-deficient mouse (traces as described in A1) during a kainic acid-induced seizure (duration, 220 sec). EEGtracing was taken at ∼50 min after the first injection of kainic acid. B2, Same animal ∼2 min later. Note the progression to a flat EEG associated with death of this animal.FLC, Forelimb clonus.
Fig. 8.
Fig. 8.
Expression of lacZ in the hippocampus of heterozygous mice; X-gal staining of tissue from NPY+/− mice. A, X-gal staining in a whole-brain section through the hippocampal formation from a normal heterozygous mouse. B, X-gal staining in a whole-brain section through the hippocampal formation 24 hr after a kainic-acid induced seizure (60 mg/kg, i.p.). Note the increased X-gal staining in the stratum oriens region of CA3 (arrow) and particularly in the granule cell layer of the dentate gyrus (arrowhead) in this thick tissue section.C, High magnification of X-gal staining in the stratum oriens region of CA3 (1000-μm-thick tissue section) from a different heterozygous mouse. D, High magnification of X-gal staining in the stratum oriens region of CA3 (1000-μm-thick tissue section) 24 hr after a kainic acid-induced seizure. E, High magnification of X-gal staining in the dentate gyrus (1000-μm-thick tissue section) from a different heterozygous mouse.F, High magnification of X-gal staining in the dentate gyrus (1000-μm-thick tissue section) 24 hr after a kainic acid-induced seizure.

References

    1. Alger BE, Nicoll RA. Feedforward dendritic inhibition in rat hippocampal pyramidal cells studied in vitro. J Physiol (Lond) 1982;328:105–123. - PMC - PubMed
    1. Allen YS, Adrian TE, Allen JM, Tatemoto K, Crow TJ, Bloom SR, Polak JM. Neuropeptide Y distribution in the rat brain. Science. 1983;221:877–879. - PubMed
    1. Andersen P, Bliss TVP, Lømo T, Olsen LI, Skrede KK. Lamellar organization of hippocampal excitatory pathways. Acta Physiol Scand. 1969;76:4A–5A. - PubMed
    1. Austin KB, Bronzino JD, Morgane PJ. Paired-pulse facilitation and inhibition in the dentate gyrus is dependent on behavioral state. Exp Brain Res. 1989;77:594–604. - PubMed
    1. Baraban SC, Schwartzkroin PA. Effects of prenatal cocaine exposure on the developing hippocampus: intrinsic and synaptic physiology. J Neurophysiol. 1997;77:126–136. - PubMed

Publication types

MeSH terms