. 1997 Dec 1;17(23):8955-63.
doi: 10.1523/JNEUROSCI.17-23-08955.1997.

Inhibition of axonal growth by brefeldin A in hippocampal neurons in culture

Affiliations

Inhibition of axonal growth by brefeldin A in hippocampal neurons in culture

M Jareb et al. J Neurosci. .

Abstract

The outgrowth of neuronal processes involves a great increase in the surface area of the cell. The supply of membrane material necessarily must be coordinated with the demands for neurite growth. The selective growth of only one or two neurites at any given time during the development of polarity raises the possibility that the production of materials by the soma is limiting for growth (Dotti and Banker, 1987; Dotti et al., Goslin and Banker, 1990). To examine the role of the availability of membrane components during the development of polarity and axonal elongation, we treated neurons with brefeldin A, an antibiotic that disrupts the trafficking of vesicles from the Golgi complex to the plasma membrane. Treatment with brefeldin A (1 microg/ml) inhibited axonal growth within 0.5 hr; in unpolarized cells it prevented the formation of an axon. These results indicate that the availability of membrane components of Golgi-derived vesicles is required for axonal growth and hence the development of polarity. Inhibitors of protein and RNA synthesis also blocked axonal growth and the development of polarity, but over a much slower time course. This suggests that the full complement of proteins and mRNAs required for the initial development of polarity is present for several hours before polarity is actually established.


Figures

Fig. 1.
Fig. 1.
The effects of brefeldin A on the organization of the Golgi complex in cultured hippocampal neurons. The Golgi complex was visualized with a polyclonal antibody against the Golgi resident protein mannosidase II. Fluorescent micrographs were enlarged to show somata (D–F). In control neurons (A,D), the nucleus typically lies at one pole of the cell, and the Golgi complex is present as a single discrete spot near the edge of the nucleus that faces the cytoplasm. After exposure to BFA (3.57 μm) for 15 min (B,E), mannosidase II immunoreactivity was diffusely distributed throughout the cytoplasm. Within 30 min after removal of BFA (C, F), the Golgi complex had nearly regained its normal position and appearance. Scale bars, 10 μm.
Fig. 2.
Fig. 2.
The effects of brefeldin A on the cell surface expression of proteins in cultured hippocampal neurons by replication-defective adenovirus. LDLR was expressed in 1-d-old neurons using replication-defective adenovirus. The distribution of LDLR was visualized by immunofluorescence. The fluorescence micrographs illustrate a representative cell from a control culture 16 hr after infection (A, C) and from a culture exposed to BFA (3.57 μm) 4 hr after infection and fixed 12 hr later (B, D). In the control cultures, cell surface labeling was observed on minor processes, the cell body, and the proximal axon. In BFA-treated cultures, labeling was confined primarily to the cell body and exhibited a tubular appearance. When BFA-treated cultures were exposed to antibody before fixation (to prevent intracellular labeling), no staining was observed. Scale bar, 20 μm.
Fig. 3.
Fig. 3.
The effects of brefeldin A on the morphological development of cultured hippocampal neurons. The phase contrast micrographs illustrate representative fields from a control culture 24 hr after plating (A) and from a culture exposed to BFA (3.57 μm) 18 hr after plating and photographed 6 hr later (B). In the control culture, half of the neurons have become polarized (asterisks), i.e., they had formed a single, long axon as well as several, short, minor processes. The other neurons had minor processes but had not yet developed axons (arrows). In cultures treated with BFA, unpolarized cells predominate. Scale bar, 20 μm.
Fig. 4.
Fig. 4.
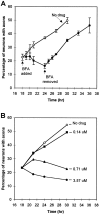
Brefeldin A inhibits the development of morphological polarity by cultured hippocampal neurons.A, Cultures were treated with BFA (3.57 μm) at 18 hr after plating and examined at varying times later. In control cultures (open circles), ∼23% of the cells had become polarized 18 hr after plating, and the proportion of cells that developed axons increased at an approximately linear rate during the next 12 hr. In the presence of BFA (filled circles), there was no increase in the number of cells that developed axons. By 3 hr there was a slight but significant decrease in the proportion of polarized cells. If BFA was removed after 6 hr of exposure, cells resumed axonal development at approximately the same rate observed in control cultures. Time points for BFA-treated and control cultures represent means from four experiments. Time points from cultures in which BFA was removed represent means from two experiments. In each experiment at each time point, two or three coverslips were fixed, and the proportion of cells with axons was determined, based on counts of 200–300 cells. B, The effects of brefeldin A on axonal development were dose-dependent. Cultures were treated with BFA at concentrations of 0.14 μm (filled squares), 0.71 μm (filled triangles), or 3.57 μm (filled circles). At the highest concentration tested (3.57 μm), axonal development was completely inhibited. Lower concentrations (as low as 0.71 μm) significantly reduced the rate of axonal development. Time points represent means from two experiments. In each experiment at each time point, two or three coverslips were fixed, and the proportion of cells with axons was determined, based on counts of 200–300 cells.
Fig. 5.
Fig. 5.
Brefeldin A inhibits the development of polarity more rapidly than do inhibitors of protein or RNA synthesis. Cultures were treated with BFA (3.57 μm; filled circles), cycloheximide (71 μm; filled triangles), or actinomycin D (8 μm; filled squares) at 18 hr after plating and examined at varying times later. In control cultures (open circles), the proportion of neurons that developed axons increased at an approximately constant rate. All three drugs inhibited the development of a polarized morphology, but the effects of BFA were much more rapid. After addition of BFA, a reduction in the expected increase in the number of polarized cells was evident by 1 hr (p < 0.05, compared with control cultures). A statistically significant reduction in the proportion of neurons that had developed axons was first apparent 6 hr after addition of cycloheximide and 9 hr after addition of actinomycin D. Time points represent means from three experiments. In each experiment at each time point, two or three coverslips were fixed, and the proportion of cells with axons was determined, based on counts of 200–300 cells.
Fig. 6.
Fig. 6.
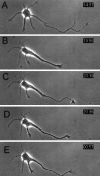
The effects of brefeldin A on neurite elongation. The culture was treated with BFA (3.57 μm) ∼24 hr after plating. This series of phase contrast micrographs illustrates a cell just before BFA treatment (A) and 1 hr (B), 3 hr (C), 6 hr (D), and 12 hr (E) after addition of BFA. Axonal elongation, which was evident before the addition of BFA, was completely inhibited within the first hour after treatment. After 3 hr, retraction of the axon was evident, although the axonal growth cone retained its normal appearance for >6 hr after addition of BFA. By 12 hr, the axon had retracted >60 μm, and the axonal growth cone had lost any lamellipodia or filopodia. The minor processes seemed primarily unaffected by treatment with BFA. Scale bar, 20 μm.
Fig. 7.
Fig. 7.
Axonal growth spurts persist for hours in brefeldin A. This set of phase contrast micrographs illustrates a cell just before BFA treatment (A) and at several time points between 6 and 11 hr after the addition of BFA (B–E). At 6 hr after BFA treatment, the axon had retracted markedly (B). Twenty minutes later a growth spurt in excess of 10 μm was evident (C). Fifteen minutes later, axonal retraction was observed (D). Several hours later, a motile axonal growth cone still persisted (E). The individual frames shown were taken from a time-lapse video recording in which images were collected every 8 sec. Scale bar, 20 μm.
Fig. 8.
Fig. 8.
The effects of cycloheximide on neurite elongation. The set of phase contrast micrographs illustrates a cell just before treatment with 71 μm cycloheximide (A) and 2 hr (B), 3 hr (C), 6 hr (D), and 12 hr (E) after treatment. Axonal growth continued normally for 3 hr after the addition of cycloheximide. By 6 hr, the axon had stopped growing and had retracted slightly, and its growth cone had disappeared. Over the next 6 hr, the axon became thinner and retracted still more. The minor processes also became thinner over time, but they did not retract. Scale bar, 20 μm.
Fig. 9.
Fig. 9.
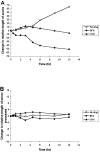
A comparison of the effects of brefeldin A and cycloheximide on the rate of neurite elongation. A,B, An illustration of the average net change in the length of the axon (A) and of the minor processes (B), measured relative to the length of these processes at the time drug treatment began (∼24 hr after plating). Cultures treated with BFA (3.57 μm; filled circles) or with cycloheximide (71 μm;filled triangles) were compared with control cultures treated with EtOH or H2O, respectively (open circles). Axonal growth was significantly inhibited within 1 hr after treatment with BFA (p < 0.001, BFA vs controls). At later times BFA-treated axons exhibited a net retraction, which reached an average of 51.1 μm by 12 hr. The rate of axonal growth in cycloheximide-treated cells was not significantly different from that of control cells until after 6 hr of treatment. At later times cycloheximide-treated axons exhibited a net retraction, which reached an average of 6.6 μm by 12 hr. At this stage of development, minor processes exhibit little or no net growth. Neither BFA nor cycloheximide caused a systematic change in the length of minor processes. These data are based on measurements of 24 randomly chosen stage 3 cells from two independent experiments.
Fig. 10.
Fig. 10.
Alteration of polarity induced by brefeldin A. This set of phase contrast micrographs illustrates a cell just before BFA treatment (A), 1 hr (B) and 6 hr (C) after the addition of BFA, and then 12 hr after BFA was removed and the cell was returned to control medium (D). Within 1 hr of BFA treatment, the axon had begun to retract, and by 6 hr, it had retracted back to the length of the minor processes of the cell. After removal of BFA, the initial axon did not regrow. Instead one of the minor processes became the new axon. Scale bar, 20 μm.

Similar articles

Cited by

References

    1. Akasaki K, Fukuzawa M, Kinoshita H, Furuno K, Tsuji H. Cycling of two endogenous lysosomal membrane proteins, lamp-2 and acid phosphatase, between the cell surface and lysosomes in cultured rat hepatocytes. J Biochem (Tokyo) 1993;114:598–604. - PubMed
    1. Andreose JS, Fumagalli G, Sigworth FJ, Caplan MJ. Real-time detection of the surface delivery of newly synthesized membrane proteins. Proc Natl Acad Sci USA. 1996;93:7661–7666. - PMC - PubMed
    1. Barroso M, Sztul ES. Basolateral to apical transcytosis in polarized cells is indirect and involves BFA and trimeric G protein sensitive passage through the apical endosome. J Cell Biol. 1994;124:83–100. - PMC - PubMed
    1. Boldin S, Futerman AH. Glucosylceramide synthesis is required for basic fibroblast growth factor and laminin to stimulate axonal growth. J Neurochem. 1997;68:882–885. - PubMed
    1. Bottenstein JE, Sato GH. Growth of a rat neuroblastoma cell line in serum-free supplemented medium. Proc Natl Acad Sci USA. 1979;76:514–517. - PMC - PubMed

Publication types

LinkOut - more resources