Comparative Study
. 1997 Dec 1;17(23):8997-9009.
doi: 10.1523/JNEUROSCI.17-23-08997.1997.

Development of intrinsic and synaptic properties in a forebrain nucleus essential to avian song learning

Affiliations
Comparative Study

Development of intrinsic and synaptic properties in a forebrain nucleus essential to avian song learning

F S Livingston et al. J Neurosci. .

Abstract

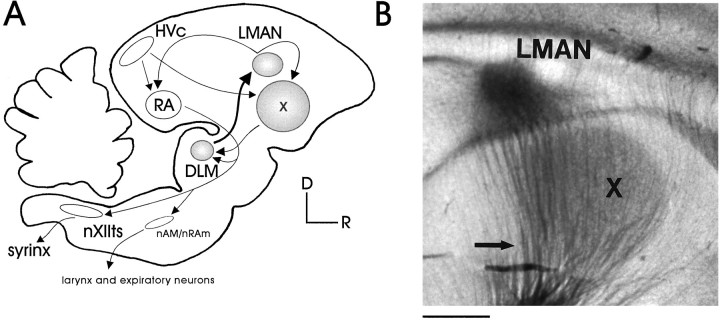
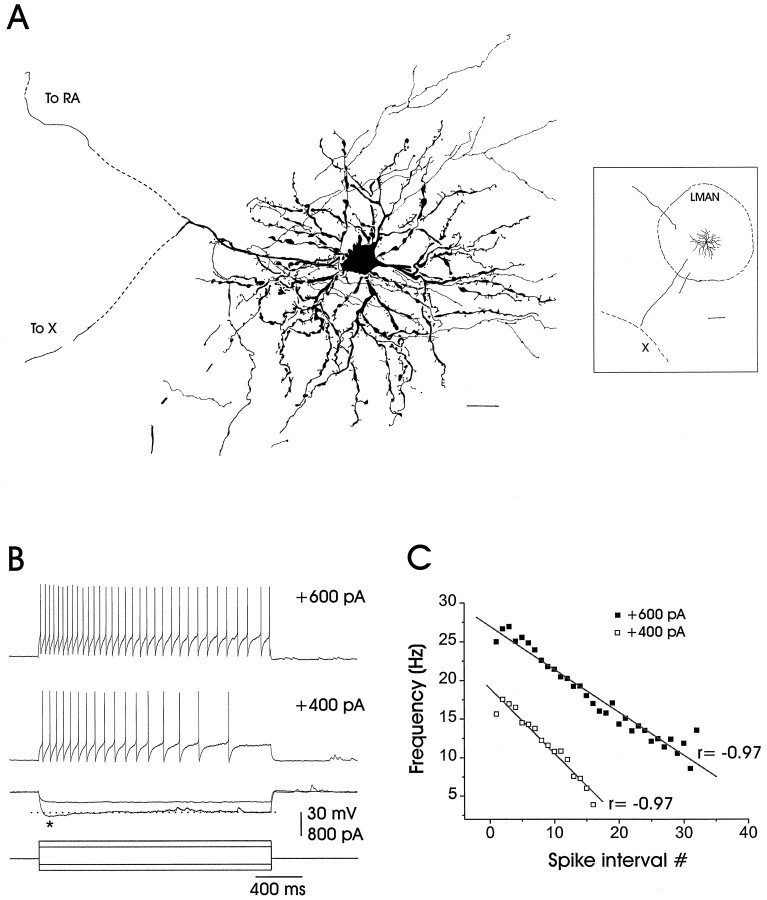
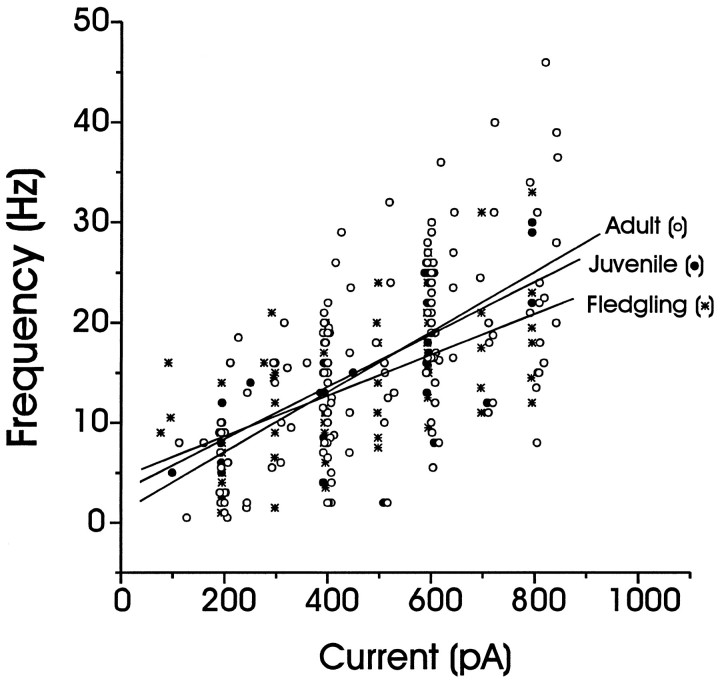
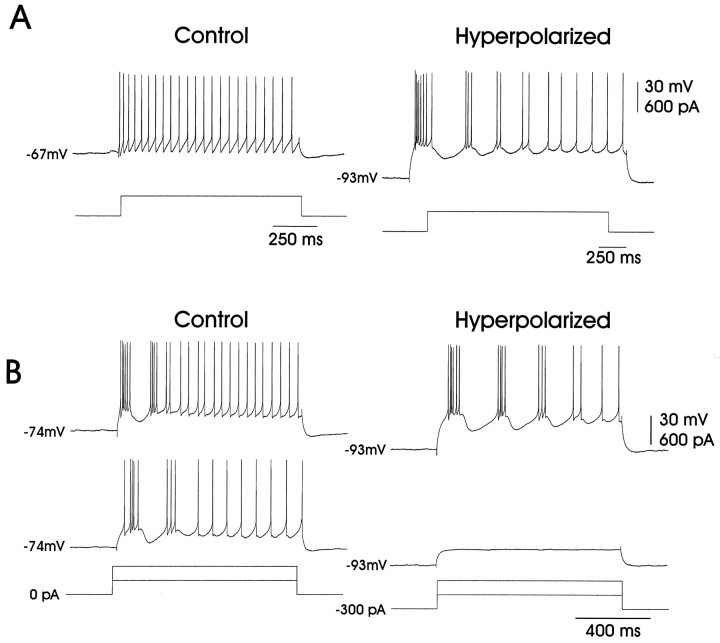
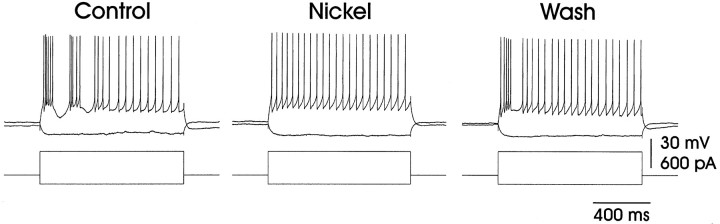
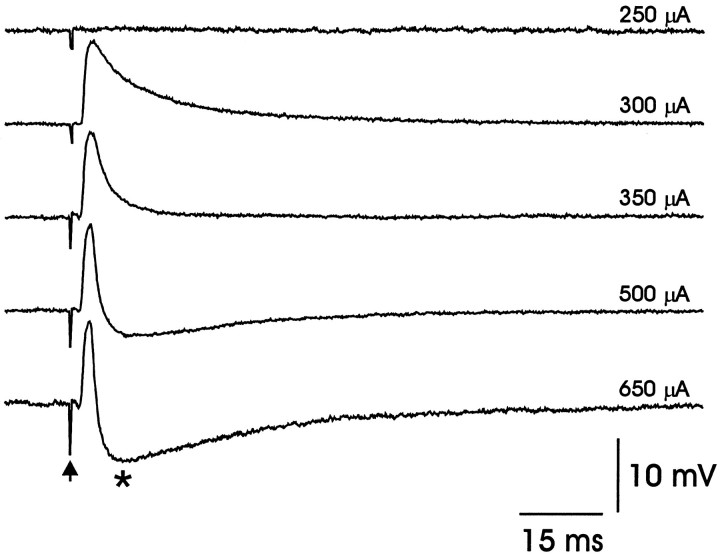
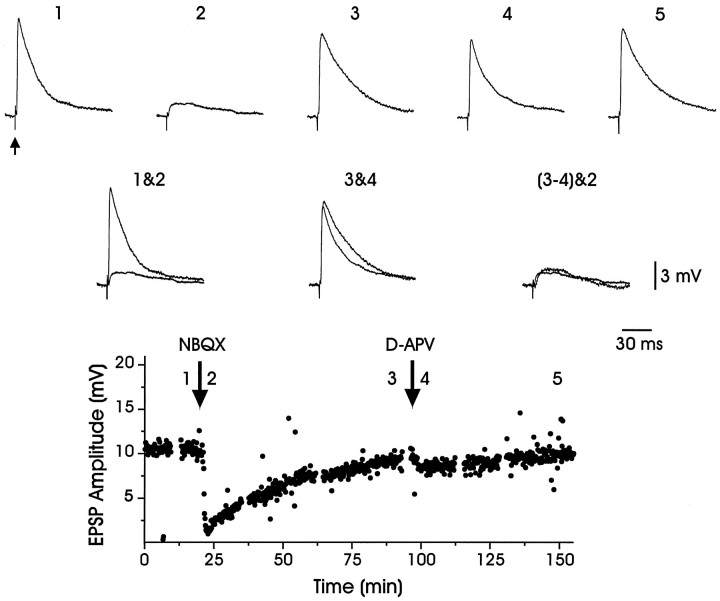
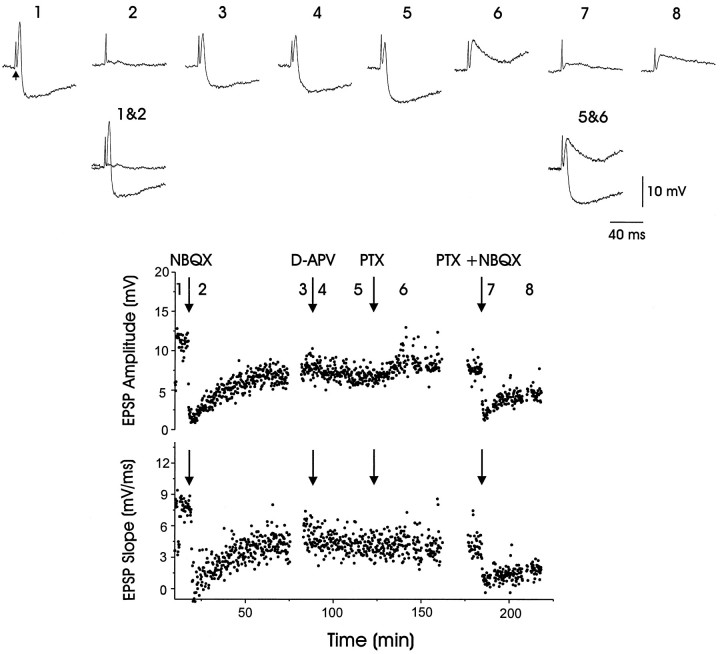
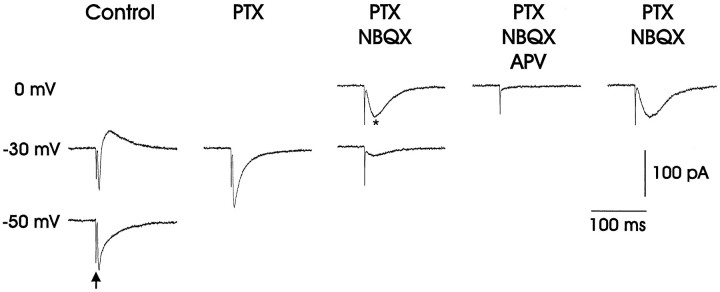
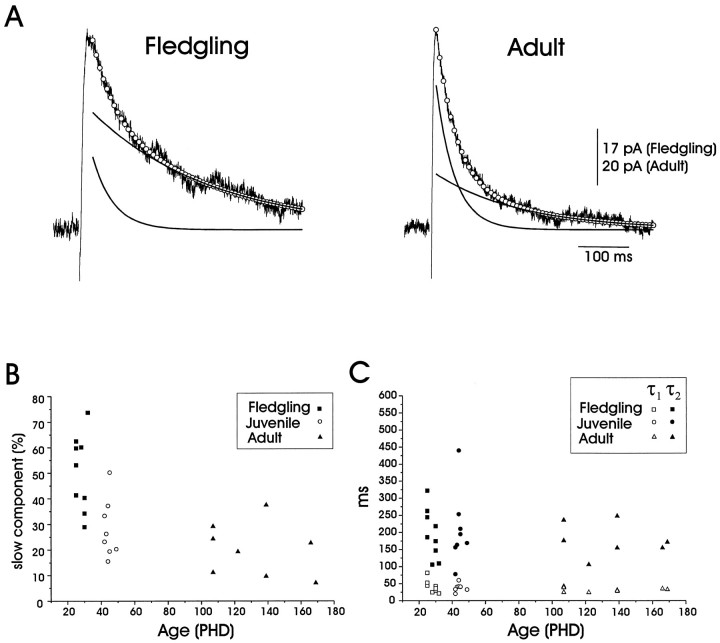
In male zebra finches, the lateral magnocellular nucleus of the anterior neostriatum (LMAN) is necessary for the development of learned song but is not required for the production of acoustically stereotyped (crystallized) adult song. One hypothesis is that the physiological properties of LMAN neurons change over development and thus limit the ability of LMAN to affect song. To test this idea, we used in vitro intracellular recordings to characterize the intrinsic and synaptic properties of LMAN neurons in fledgling [posthatch days (PHD) 22-32] and juvenile zebra finches (PHD 40-51) when LMAN lesions disrupt normal song development, and in adults (>PHD 90) when LMAN lesions are without effect. In fledglings, depolarizing currents caused LMAN projection neurons to fire bursts of action potentials because of a putative low-threshold calcium spike (LTS). In contrast, juvenile and adult LMAN projection neurons fired accommodating trains of action potentials when depolarized but did not exhibit the burst mode of firing. Electrical stimulation of thalamic afferents elicited both monosynaptic EPSPs mediated by AMPA and NMDA receptors and polysynaptic IPSPs mediated by GABAA receptors from LMAN neurons at all ages studied here. In whole-cell voltage-clamp recordings, the EPSCs (NMDA-EPSCs) consisted of fast and slow components. Unlike juvenile and adult NMDA-EPSCs, those in fledglings were dominated by the slower component. Thus, both the intrinsic and synaptic properties of LMAN neurons change markedly during early song development (PHD 22-40) and achieve several adult-like properties during early sensorimotor learning and well before the time when LMAN lesions no longer disrupt song development.


Figures

Fig. 1.
Fig. 1.
The song system. A, Simplified schematic of the song system. The motor pathway (open structures) is essential for the production of learned song and includes the nuclei HVc, RA,nAm/nRAm, and nXIIts. The anterior forebrain pathway (AFP; shaded structures) is critical for normal song development and contains X,DLM, and LMAN (D, dorsal;R, rostral). HVc, Used here as the proper name, also known as the higher vocal center; RA, robust nucleus of the archistriatum; nAm, nucleus ambiguus;nRAm, nucleus retroambigualis; nXIIts, tracheosyringeal portion of the hypoglossal nucleus; X, area X of the lobus parolfactorius; DLM, medial nucleus of the dorsolateral thalamus; LMAN, lateral portion of the magnocellular nucleus of the anterior neostriatum.B, LMAN and area X in a transilluminated parasagittal living brain slice, showing the ascending thalamic fibers from DLM (arrow). Scale bar, 800 μm.
Fig. 2.
Fig. 2.
The morphology and subthreshold and suprathreshold responses of an adult LMAN projection neuron.A, Camera lucida reconstruction of a neurobiotin-stained neuron of the type encountered in this study. LMAN projection neurons have spinous dendrites, local collaterals, and a bifurcated primary axon, with one process traveling caudally toward RA and the other ventrally toward area X (dashed lines represent missing portions of axons). The inset on theright is a low-power camera lucida reconstruction showing the same LMAN neuron in its relation to the borders of LMAN and area X (dorsal is toward the upper right, and rostral is toward the lower right). Scale bar, 20 μm; 200 μm for inset. B, Adult LMAN neurons typically fired action potential trains that accommodated in response to depolarizing currents, as shown in the top two traces. Inward rectification (marked by anasterisk) often occurred in response to the larger hyperpolarizing currents, as shown in the third set of traces. Resting potential = 76 mV. C, The instantaneous firing frequency is shown plotted as a function of the spike interval number and is well fit by a straight line [average correlation coefficient for the adult population, in response to +600 pA, was r = −0.93 ± 0.01 (n = 39)]. The average correlation coefficient for the juvenile population, in response to +600 pA, was r = −0.86 ± 0.03 (n = 12).
Fig. 4.
Fig. 4.
The morphology and sub- and suprathreshold responses of a fledgling LMAN projection neuron. A, Camera lucida reconstruction of a neurobiotin-stained fledgling projection neuron reveals similar morphology to adult neurons, including the spinous dendrites, local collaterals, and the bifurcating main axon with projections to area X and RA. The inseton the right is a low-power camera lucida reconstruction showing the same LMAN neuron with respect to the borders of LMAN (dorsal is toward the top of the figure; rostral is toward the right). Scale bar, 20 μm; 200 μm forinset. B, Fledgling LMAN projection neurons fired action potentials in two distinct modes in response to depolarizing current. In the top trace a fledgling neuron fired in a bursting manner (Mode 1) in response to depolarizing current injection. However, at a separate time during the recording session, the same neuron fired accommodating action potential trains (Mode 2) that were similar to those of adult neurons, as shown in the bottom trace. Note that the membrane potential shifted from −76 to −71 mV in parallel with the shift in firing modes. C, The instantaneous firing frequency is shown plotted as a function of the spike interval number. For cells firing in mode 2, this relationship was well fit by a straight line [r = −0.93; average correlation coefficient for the fledgling population, in response to +400 pA, wasr = −0.80 ± 0.07 (n = 6)]. However, cells that fired in Mode 1 had rapidly changing instantaneous firing frequencies and were poorly fit by a straight line (fit not shown).
Fig. 3.
Fig. 3.
Average action potential firing frequencies for different depolarizing currents (1–2 sec in duration) from LMAN neurons of various ages. The average action potential firing frequencies were calculated for fledgling (stars;n = 15), juvenile (filled circles; n = 14), and adult (open circle; n = 55) LMAN neurons and were plotted as a function of the injected current. Linear fits of the data from each age are shown; the firing rate in response to a given amount of injected current did not differ among the age groups. One-way ANOVAs demonstrated that the responses were not significantly different across ages at +200 pA (F = 0.2, p > 0.8), +400 pA (F = 0.5, p > 0.6), and +600 pA (F = 0.5, p> 0.6).
Fig. 5.
Fig. 5.
The effect of membrane potential on bursting in fledgling neurons. A, Hyperpolarization could unmask the bursting behavior in fledgling LMAN neurons. Initially, current injection (+400 pA) induced only the mode 2 adult-like firing in this fledgling neuron, as shown in the left trace. However, when the membrane was subjected to tonic hyperpolarization (−300 pA), the same depolarizing current (i.e., +400 pA) caused the neuron to fire in mode 1, as shown in the right trace.B, Hyperpolarization also could augment preexisting bursting behavior in fledgling LMAN neurons. The two left traces show a fledgling LMAN neuron that initially fired in mode 1 in response to depolarizing currents (+300 and +600 pA). When the same cell was subjected to tonic hyperpolarization (−300 pA), as shown in the right two traces, bursting was augmented in response to the +600 pA current injection, although the cell remained subthreshold when injected with the +300 pA current.
Fig. 6.
Fig. 6.
Mode 1 firing was blocked by extracellular application of nickel. This fledgling LMAN neuron fired in mode 1 in response to depolarizing current (left trace). Nickel (10 mm, applied via a puffer pipette) blocked the bursting behavior of this cell (middle trace). Sixty minutes after the nickel application the bursting behavior partially recovered (right trace). Resting potential = −75 mV.
Fig. 7.
Fig. 7.
Excitatory and inhibitory synaptic responses could be elicited from LMAN projection neurons by electrical stimulation of DLM axons. Synaptic potentials were elicited in LMAN projection neurons in response to increasing stimulus intensities (100 μsec duration; stimulus artifact marked by arrow; the stimulus amplitude for each trace is shown on the right). At threshold (∼300 μA) only an EPSP was elicited. At higher stimulus intensities an IPSP also was elicited (marked byasterisk).
Fig. 8.
Fig. 8.
EPSPs evoked in LMAN by thalamic fiber stimulation were blocked by glutamate receptor antagonists. An evoked EPSP (trace 1; arrow marks stimulus artifact) was reduced substantially (trace 2) by NBQX (25 μm), an antagonist of the AMPA subtype of glutamate receptor. The EPSP amplitude recovered after ∼75 min (trace 3). Subsequent application of d-APV (400 μm) only slightly reduced the EPSP amplitude (trace 4), which recovered completely after ∼50 min (trace 5). Traces 1&2 andtraces 3&4 are overlaid to facilitate the comparison of the drug effects. Traces 3 and 4 were subtracted to yield the d-APV-sensitive EPSP, and the resulting trace was overlaid with NBQX-insensitive EPSP (traces 3–4&2), revealing that they have a similar amplitude and time course. The bottom portion of the figure plots the EPSP amplitude over the course of the experiment (synaptic responses were evoked at 0.1 Hz; mean resting potential = −75 mV).
Fig. 9.
Fig. 9.
Both AMPA and GABAA receptor antagonists blocked IPSPs elicited in LMAN by electrical stimulation of thalamic axons. An evoked compound EPSP–IPSP (trace 1;arrow marks stimulus artifact) was blocked (trace 2) by NBQX (25 μm); the compound response partially recovered after ∼50 min (trace 3). In contrast, the application of d-APV (800 μm) had no effect on either the EPSP or the IPSP (traces 4and 5). The application of picrotoxin (PTX; 200 μm) selectively eliminated the IPSP, leaving only the EPSP (trace 6). The remaining EPSP was reduced substantially by the application of NBQX (25 μm; trace 7), followed by a partial recovery (trace 8). Traces 1&2 andtraces 5&6 are overlaid to facilitate comparison of the drug effects. The bottom two portions of the figure plot the PSP amplitude and onset slope over the course of the experiment (synaptic responses were elicited every 10 sec; average resting potential = −79 mV)
Fig. 10.
Fig. 10.
Whole-cell voltage-clamp recordings (holding potential specified to the left) showed that thalamic fiber stimulation (marked by arrow in bottom left trace) could evoke glutamatergic EPSCs that were blocked by the AMPA receptor antagonist NBQX, GABAergic IPSCs, and voltage-dependent NMDA receptor-mediated EPSCs from LMAN neurons. AtVh = −30 mV (relative toErev; see Materials and Methods), the evoked EPSC was inward-going, whereas the IPSC was outward. The GABAA receptor blocker picrotoxin (PTX; 50 μm) blocked the IPSC, leaving a fast inward current that was blocked by the AMPA receptor antagonist NBQX (2.5 μm). The remaining slower inward current, which increased in amplitude when the cell was held at 0 mV, was blocked by the NMDA receptor antagonist d-APV (50 μm). In LMAN, NMDA receptor-mediated EPSCs reversed positive of 0 mV (see Table 3), suggesting that the synaptic membrane was more negative than the reported values because of incomplete space clamp.
Fig. 11.
Fig. 11.
The decay kinetics of NMDA receptor-mediated EPSCs elicited in LMAN by thalamic fiber stimulation change during early development. A, On the left is an evoked NMDA receptor EPSC from a fledgling LMAN projection neuron, and on the right is a NMDA receptor EPSC from that of an adult. These NMDA receptor-mediated EPSCs were best fit by double exponentials, which are represented by the open circles. The black curves represent the fast (τ1) and slow (τ2) exponentials that constitute the double-exponential fit (fledgling: τ1 = 45 msec, τ2 = 245 msec, A1= 17, and A2 = 25.1; adult: τ1 = 38 msec, τ2 = 175 msec, A1 = 45.3, and A2= 18.6; see Materials and Methods). The slow component constituted a significantly larger fraction of the total synaptic current in the fledgling than in either the juvenile or adult [EPSCs were recorded in the presence of NBQX (2.5 μm) and picrotoxin (50 μm) at Vh = +20 mV ofErev]. B, The percentage of the falling phase of the total response amplitude constituted by the slow component of the double-exponential fit declined with age [(A2/(A1+A2))·100; see Materials and Methods and Table 3 for further details].C, Fast and slow time constants (τ1 and τ2) from the double-exponential fits did not change significantly as a function of age (see Materials and Methods and Table 3 for further details).

Similar articles

Cited by

References

    1. Aamodt SM, Kozlowski MR, Nordeen EJ, Nordeen KW. Distribution and developmental change in [3H]MK-801 binding within zebra finch song nuclei. J Neurobiol. 1992;23:997–1005. - PubMed
    1. Arnold AP. The effects of castration on song development in zebra finches (Poephila guttata). J Exp Zool. 1975;191:261–278. - PubMed
    1. Ball GF. Neurochemical specializations associated with vocal learning and production in songbirds and budgerigars. Brain Behav Evol. 1994;44:234–246. - PubMed
    1. Basham ME. Developmental regulation of mRNA for the NMDAR1 subunit in zebra finches. Soc Neurosci Abstr. 1996;22:692.
    1. Basham ME, Nordeen EJ, Nordeen KW. Blockade of NMDA receptors in the anterior forebrain impairs sensory acquisition in the zebra finch (Poephila guttata). Neurobiol Learn Mem. 1996;66:295–304. - PubMed

Publication types

MeSH terms

LinkOut - more resources