. 1997 Dec 1;17(23):9048-59.
doi: 10.1523/JNEUROSCI.17-23-09048.1997.

Mechanism and kinetics of heterosynaptic depression at a cerebellar synapse

Affiliations

Mechanism and kinetics of heterosynaptic depression at a cerebellar synapse

J S Dittman et al. J Neurosci. .

Abstract

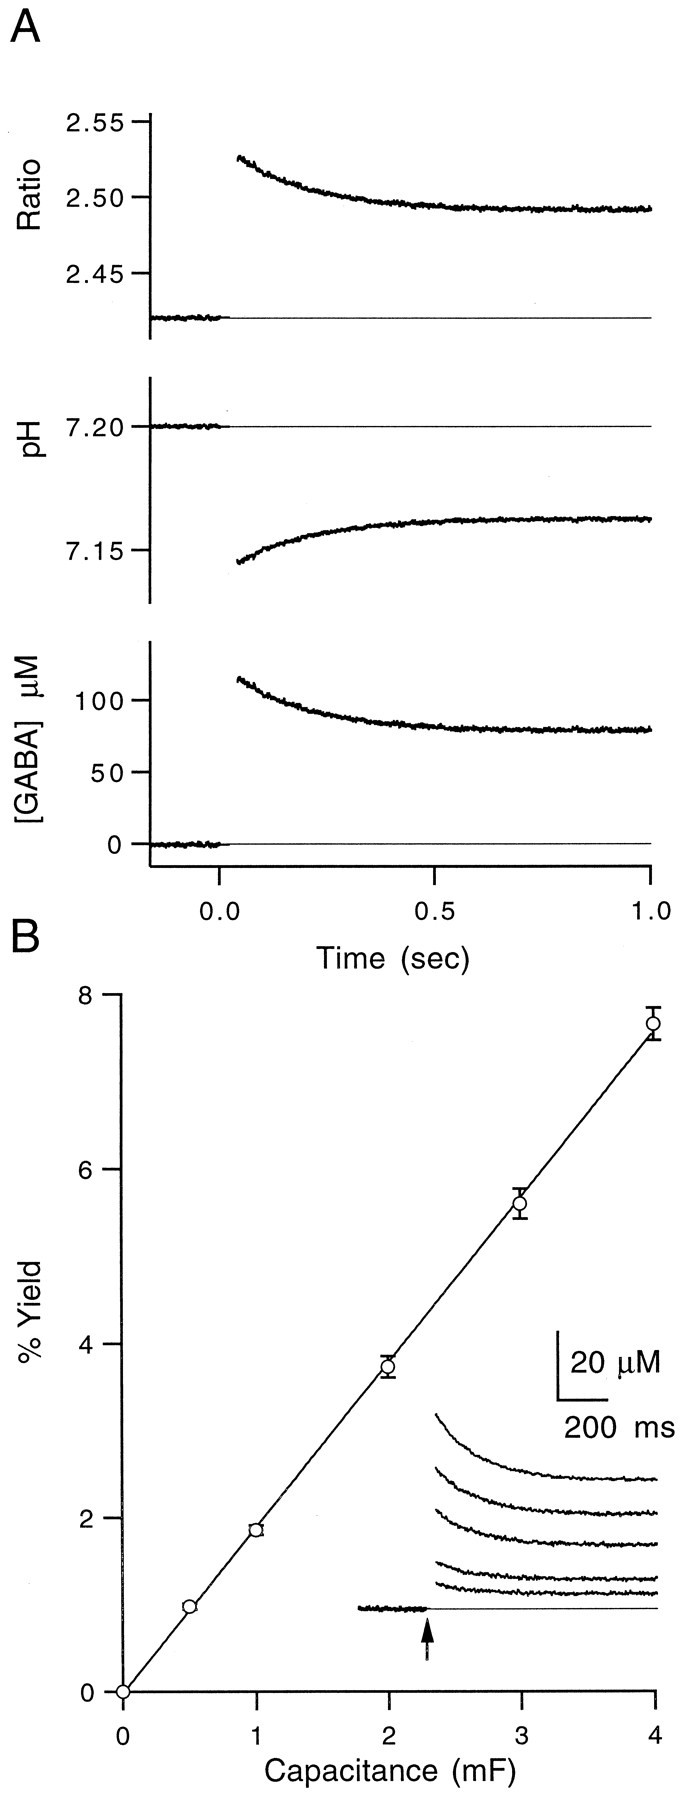
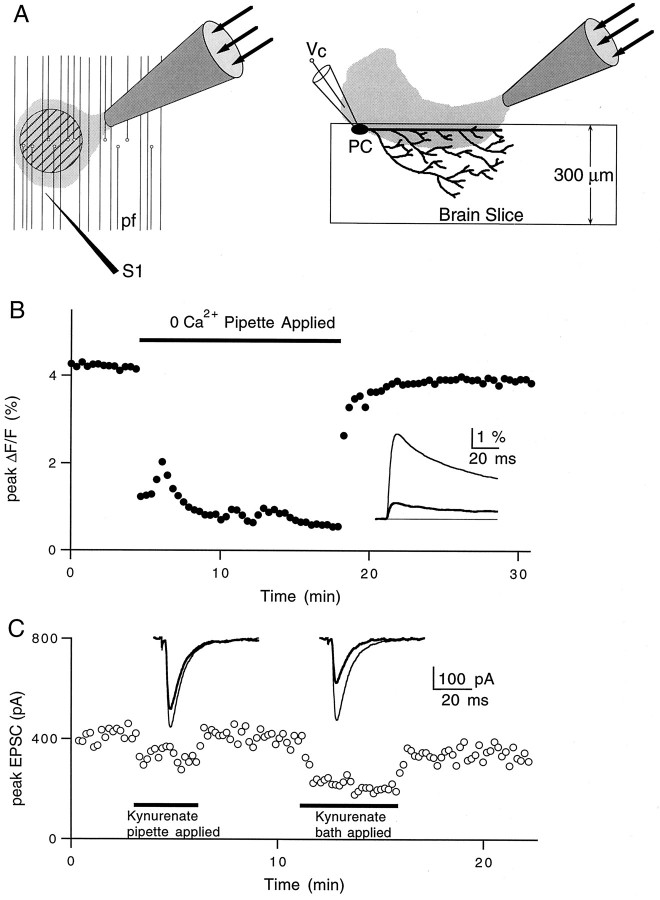
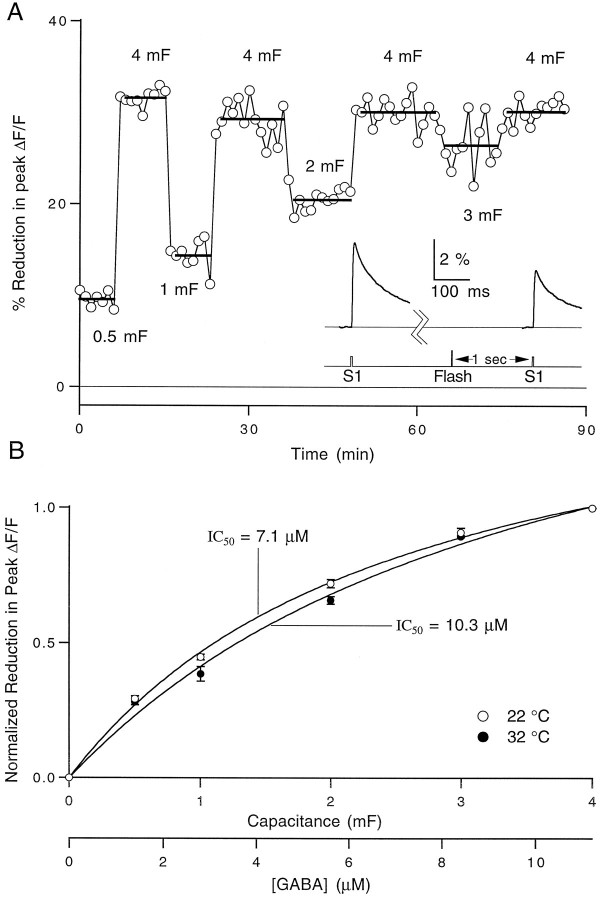
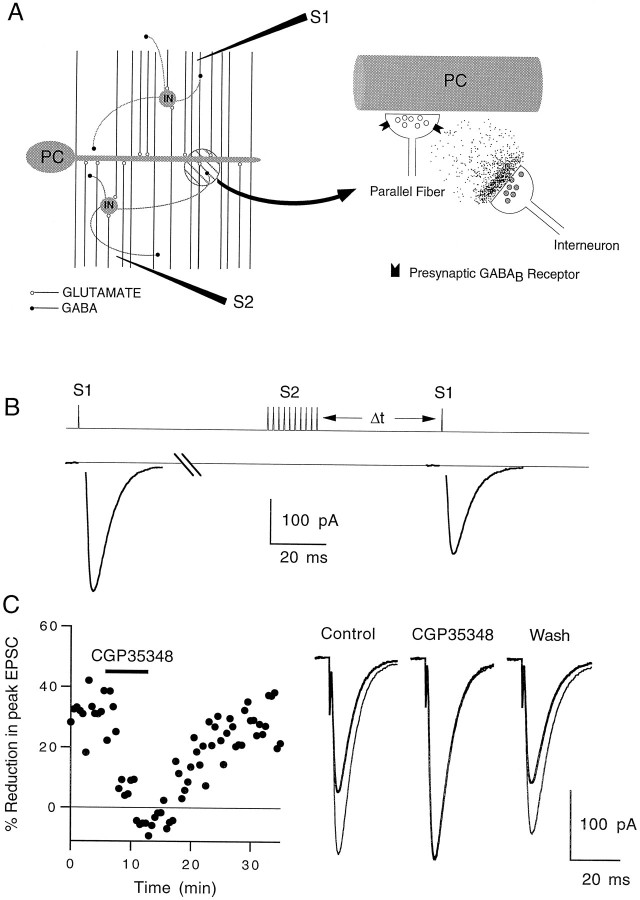
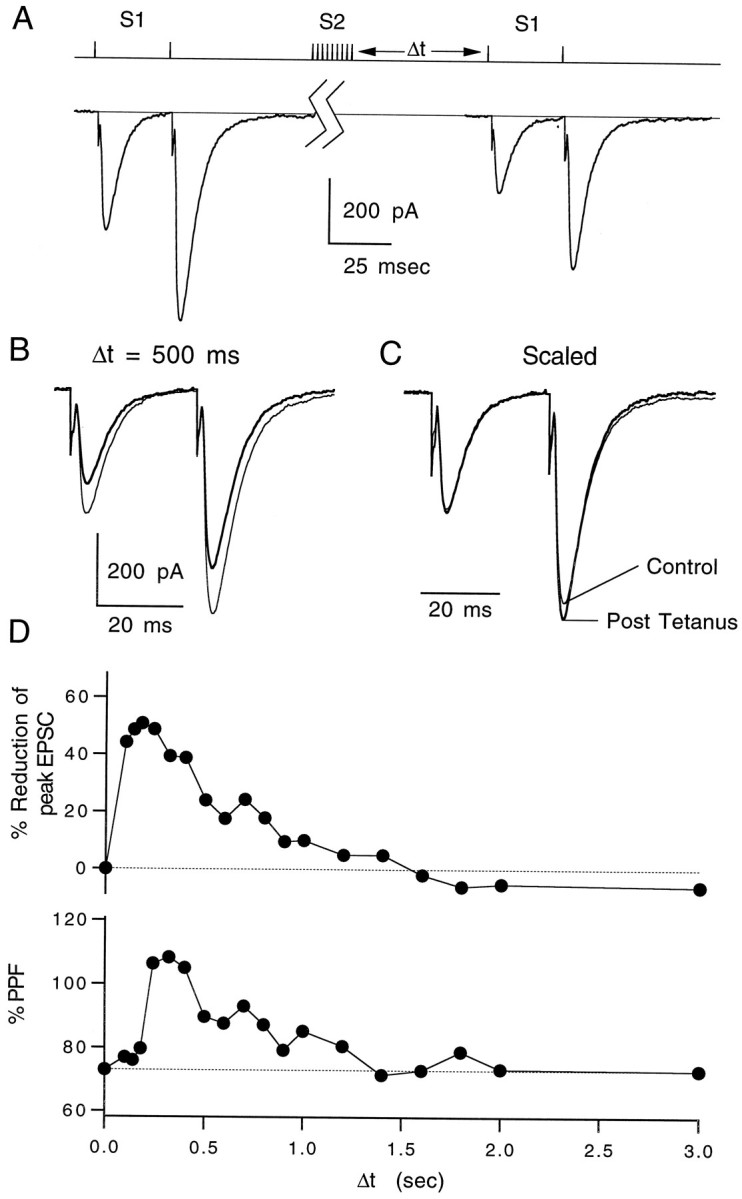
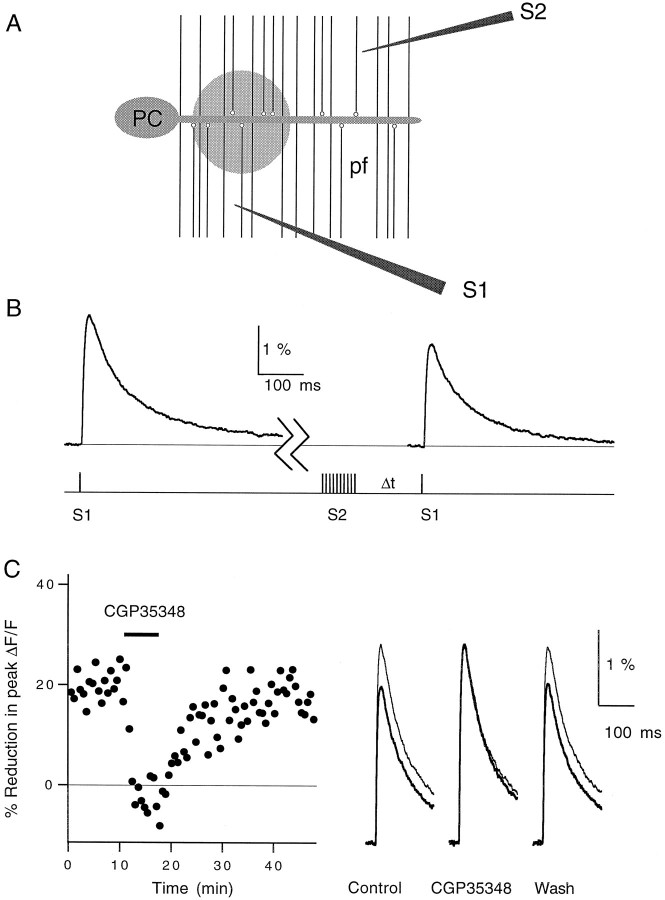
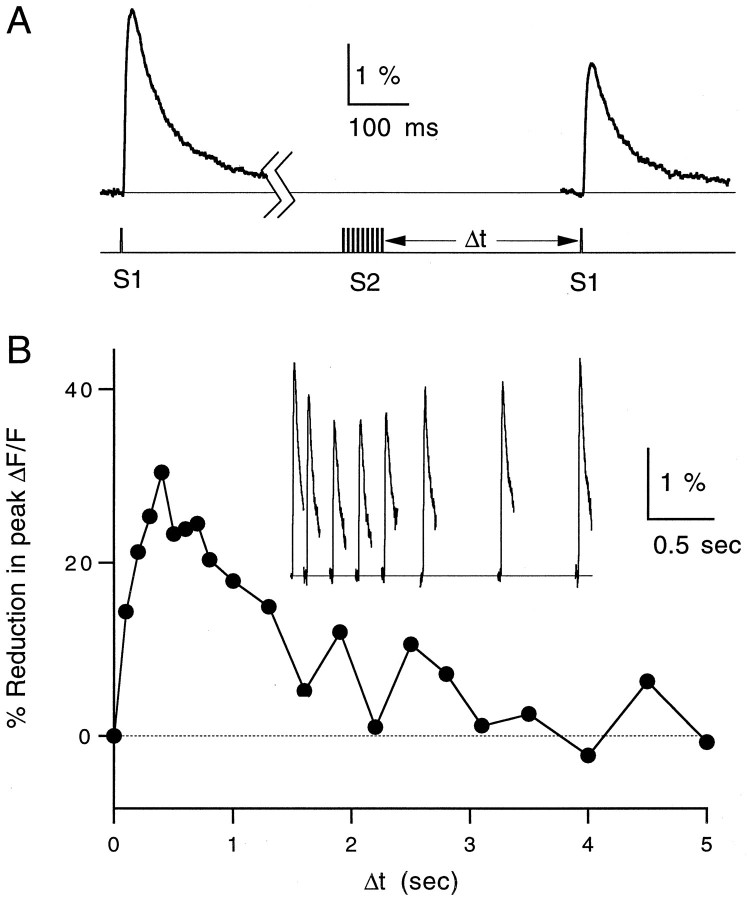
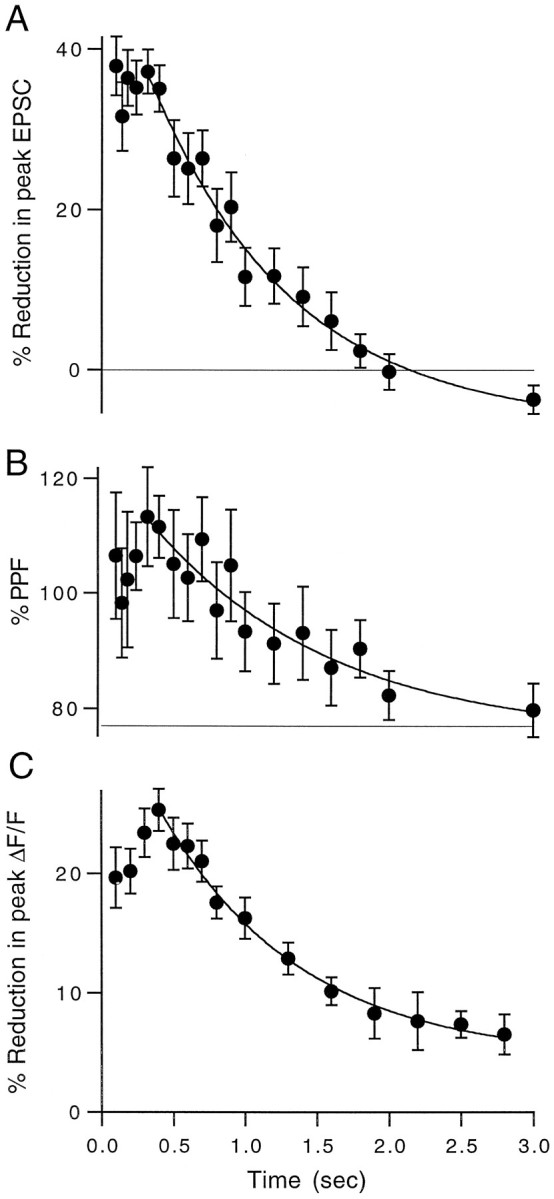
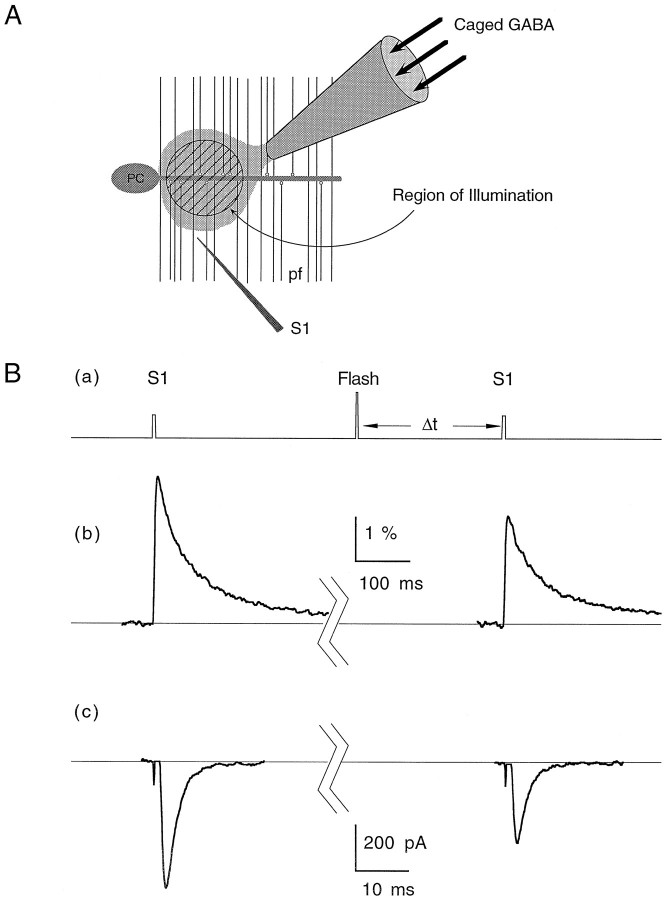
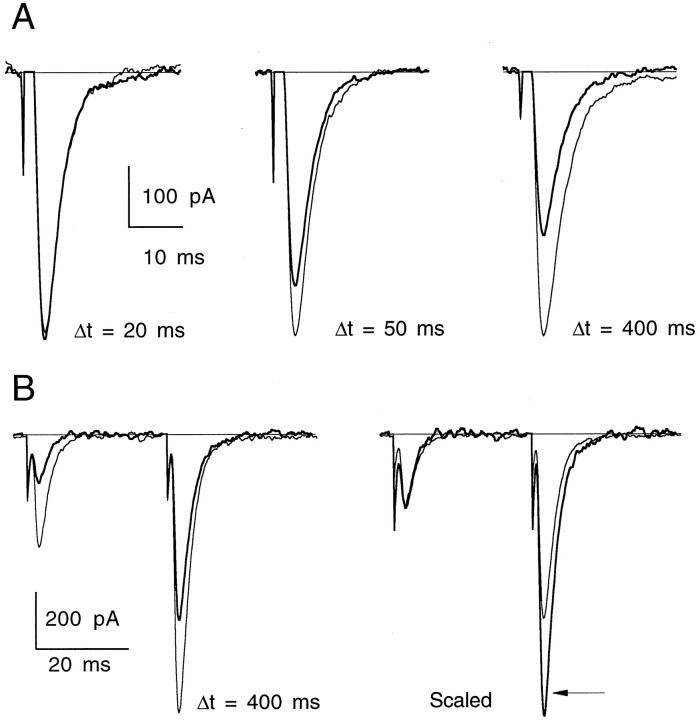
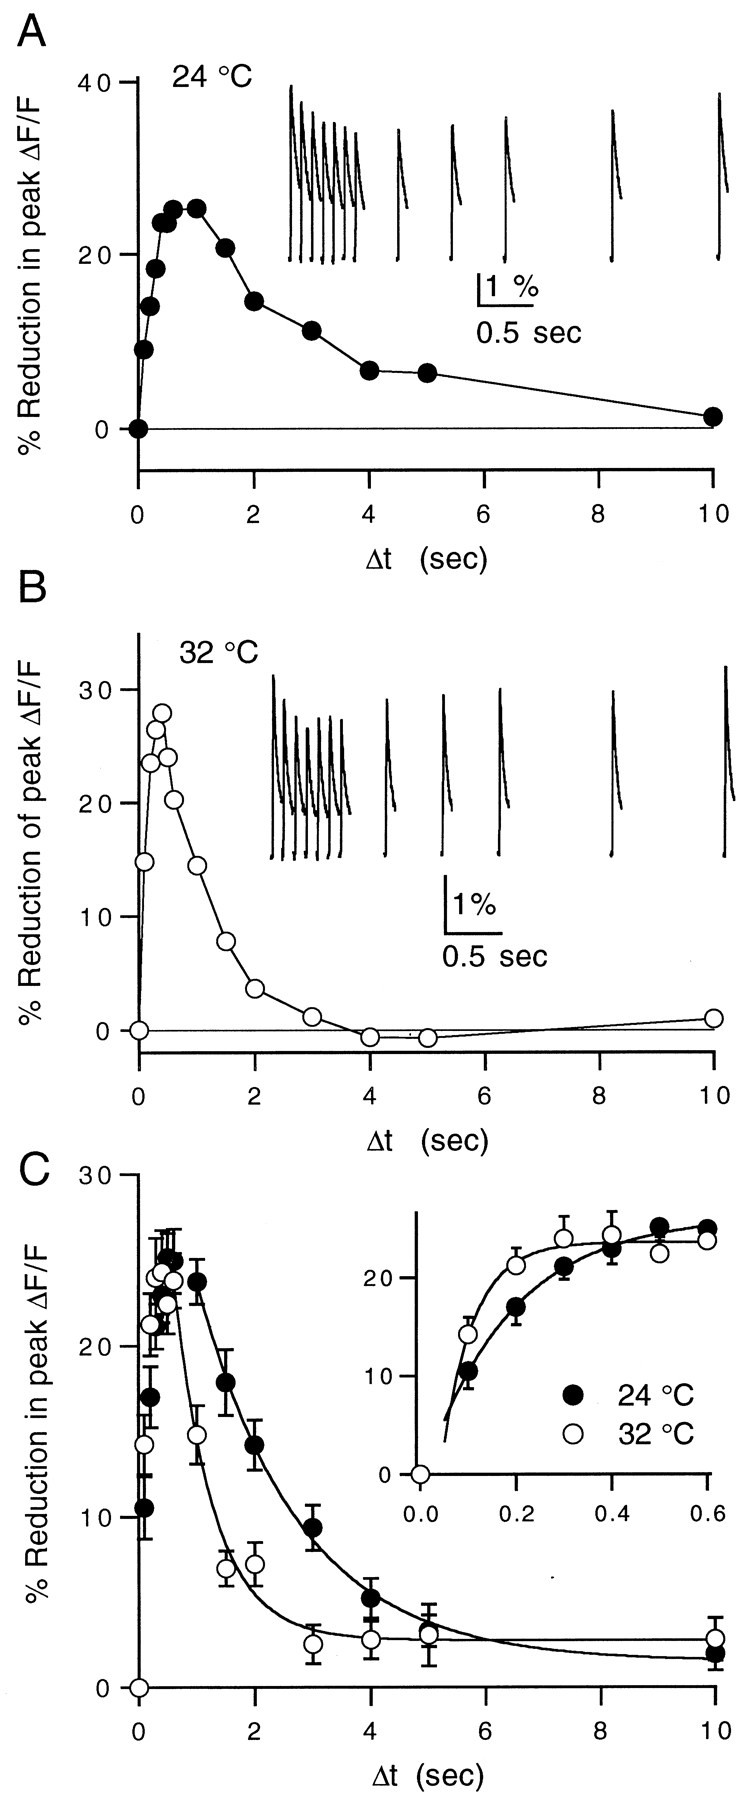
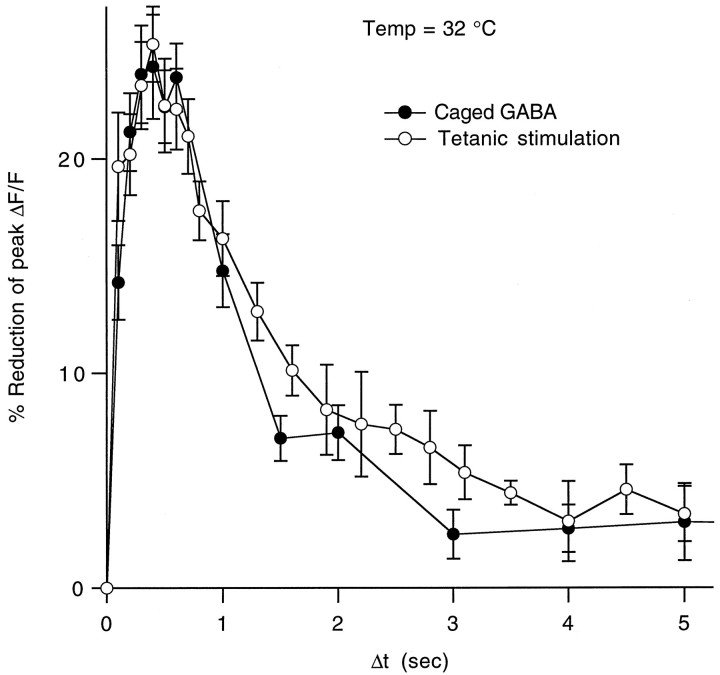
High levels of activity at a synapse can lead to spillover of neurotransmitter from the synaptic cleft. This extrasynaptic neurotransmitter can diffuse to neighboring synapses and modulate transmission via presynaptic receptors. We studied such modulation at the synapse between granule cells and Purkinje cells in rat cerebellar slices. Brief tetanic stimulation of granule cell parallel fibers activated inhibitory neurons, leading to a transient elevation of extracellular GABA, which in turn caused a short-lived heterosynaptic depression of the parallel fiber to Purkinje cell EPSC. Fluorometric calcium measurements revealed that this synaptic inhibition was associated with a decrease in presynaptic calcium influx. Heterosynaptic inhibition of synaptic currents and calcium influx was eliminated by antagonists of the GABAB receptor. The magnitude and time course of the depression of calcium influx were mimicked by the rapid release of an estimated 10 microM GABA using the technique of flash photolysis. We found that inhibition of presynaptic calcium influx peaked within 300 msec and decayed in <3 sec at 32 degrees C. These results indicate that presynaptic GABAB receptors can sense extrasynaptic GABA increases of several micromolar and that they rapidly regulate the release of neurotransmitter primarily by modulating voltage-gated calcium channels.


Figures

Fig. 1.
Fig. 1.
Photolysis calibrations using pH-sensitive fluorophores. A, Top, Ratio of two SNARF emission wavelengths before and after UV flash att = 0. Middle, Ratiometric estimate of pH after UV flash as described in Materials and Methods.Bottom, Calculated concentration of free GABA uncaged as described in Materials and Methods. All traces are averages of three trials. B, Average of eight calibration experiments showing the amount of uncaging at a variety of flashlamp output levels. Data were fit to a line with a slope of 1.9%/mF (data points are mean ± SEM, n = 8). Inset, Calculated free GABA concentration after UV flash at five capacitance levels for a representative experiment. Arrow marks the time of flash. Traces are averages of three trials.
Fig. 2.
Fig. 2.
Local pressure application and dilution estimates.A, Schematic illustrating the slice regions exposed to the pipette solution. Hatched circle in the left panel represents the region of parallel fibers (pf) where calcium measurements are taken.S1 is the stimulus electrode. The right panel illustrates a brain slice in cross section during voltage-clamp (Vc) recording from a Purkinje cell (PC). B, Representative experiment showing the effects of local application of 0 Ca2+solution on total presynaptic calcium influx. Inset, Averages of 10–15 traces in control (thin line) and 0 Ca2+ (thick line) conditions.C, Representative experiment showing the effects of local versus bath-applied kynurenate (150 μm) on Purkinje cell EPSC amplitudes. Inset, Averages of 10–15 traces in control (thin lines) and during exposure to kynurenate (thick lines) for pipette application (left) and bath application (right).
Fig. 3.
Fig. 3.
Dependence of reduction in presynaptic calcium influx on the concentration of uncaged GABA. A, Representative experiment showing the effect of uncaged GABA on presynaptic calcium influx at 22°C at five flash output levels. Each data point represents the percentage decrease in the peak magnesium green ΔF/F transient elicited 1 sec after a UV flash relative to a control ΔF/F transient elicited 8 sec before the flash. Flash energy is indicated on the graph as the amount of capacitance charged at 300 V. The bars represent the average reduction at the indicated capacitance value.Inset, Average of 10 fluorescence traces taken before and after a flash at 4 mF. B, Averages of three experiments performed at 22°C (open circles) and three experiments at 32°C (filled circles). Data points represent the mean ± SEM. Data were normalized to the percent reduction in peak ΔF/F at 4 mF in each experiment and fit to a logistic equation of the form: %Decrease = 100/(1 + IC50/[GABA]), where IC50 = 7.1 μm at 22°C and 10.3 μm at 32°C. The free GABA concentration scale at the bottom of the graph was calculated as explained in the text.
Fig. 4.
Fig. 4.
Heterosynaptic reduction in parallel fiber to Purkinje cell EPSC magnitude. A, Cartoon showing the GABA released by interneurons (IN) in the molecular layer diffusing to nearby parallel fiber presynaptic terminals and binding to GABAB receptors (right panel). Extracellular stimulus electrodes were placed in the molecular layer as shown in the left panel.S1 is the test electrode, and S2 is the tetanus electrode. PC, Purkinje cell. B, Pulse protocol for a representative experiment showing the effects of a 10 pulse, 100 Hz tetanus delivered by electrode S2 on the size of the EPSC elicited by electrode S1. The control pulse was given 5 sec before the tetanus. The test pulse was given 400 msec after the tetanus.C, Effect of 100 μm CGP35348 on heterosynaptic depression assayed 400 msec after the tetanus (left panel). Traces in theright panel are averages of 10 trials. The control EPSC (thin line) and post-tetanus EPSC (thick line) are superimposed. EPSCs were recorded at −20 mV.T = 33°C.
Fig. 5.
Fig. 5.
Time course of heterosynaptic depression.A, Pulse protocol for a representative experiment showing the effects of a 10 pulse, 100 Hz tetanus on a pair of test pulses given 30 msec apart. The control pair was elicited 10 sec before the tetanus, and the test pair was taken 400 msec after the tetanus.B, Superimposed control EPSC pairs (thin lines) and test pairs taken 500 msec after a tetanus (thick lines). C, Control and test pairs scaled to the peak of the first EPSC. Traces are averages of three trials. D, Time course of heterosynaptic depression (top) and increase in paired-pulse facilitation (bottom) of the test pair after tetanus. Data points represent averages of three trials each. Δt is the time between the tetanus and the test pair of EPSCs. EPSCs were recorded at −20 mV. T = 32°C.
Fig. 6.
Fig. 6.
Heterosynaptic reduction in stimulus-evoked presynaptic calcium influx. A, Cartoon showing the placement of the test electrode (S1) and the tetanus electrode (S2) in the molecular layer. Fluorescence measurements were taken from the shaded region of the parallel fibers (pf). PC, Purkinje cell. B, pulse protocol (bottom) and magnesium green ΔF/F fluorescence transients (top). Traces are averages of 15 trials. The first transient was evoked by electrode S1 10 sec before a 10 pulse, 100 Hz tetanus delivered by S2. The second transient was evoked by electrode S1 600 msec after the tetanus. C, Elimination of the post-tetanic reduction in calcium influx by 100 μmCGP35348 (left). Each data point represents the reduction in the peak ΔF/F transient evoked by S1 600 msec after a tetanus evoked by S2 relative to a control transient evoked by S1 10 sec before the tetanus. Traces in theright panel are averages of 15 traces each taken before (Control), during (CGP35348), and after (Wash) bath application of the GABABantagonist. Calcium transients taken before the tetanus (thin lines) and 600 msec after the tetanus (thick lines) are superimposed. T = 24°C.
Fig. 7.
Fig. 7.
Time course of reduction in presynaptic calcium influx. A, Magnesium green ΔF/Ftransients (top) and stimulus protocol (bottom) at 32°C. B, Time course of post-tetanic reduction of calcium influx. Each data point represents the relative decrease in the peak ΔF/F transient evoked by S1 after a tetanus delivered byS2 relative to a control transient evoked by S1 10 sec before the tetanus. Inset, Fluorescence transients taken at seven different times after tetanus. Traces and data points are averages of three trials. Δt is the time between the tetanus and the test pulse.
Fig. 8.
Fig. 8.
Summary of pre- and postsynaptic time course experiments. A, Time course of post-tetanic reduction in EPSC magnitude averaged over n = 7 experiments performed at 32–33°C. B, Time course of the increase in paired-pulse facilitation of the test EPSCs for the same experiments shown in A. C, Time course of the reduction in peak ΔF/F after a tetanus averaged overn = 7 experiments performed at 32–33°C. Data points are mean ± SEM. All three time courses were fit to single-exponential decays (solid lines) with time constants of 1.0, 1.25, and 1.1 sec, respectively.
Fig. 9.
Fig. 9.
Effects of uncaged GABA on presynaptic calcium influx and EPSC magnitude. A, Cartoon describing the placement of the pipette containing caged GABA in the molecular layer. A small spot represented by the hatched circlewithin the parallel fibers (pf) represents the region exposed to the UV flash. For calcium measurements, this is also the region monitored for fluorescence changes after stimulation by the test electrode (S1). For synaptic physiology experiments, the Purkinje cell (PC) was voltage-clamped to record EPSCs evoked by S1. Ba, Pulse protocol used for both EPSC and calcium influx measurements and representative experiments showing the effect of uncaged GABA on stimulus-evoked presynaptic calcium influx (Bb) and Purkinje cell EPSCs (Bc). In both cases, the control trace was evoked 10 sec before the flash and the test trace was evoked 400 msec after the flash. All traces represent averages of three to five trials. EPSCs were recorded at −40 mV. T = 32°C.
Fig. 10.
Fig. 10.
Inhibition of synaptic transmission by uncaged GABA. A, Superimposed traces from control (thin lines) and postphotolysis (thick lines) stimulus-evoked EPSCs for a representative experiment at three delay times after UV flash. Traces are averages of three to four trials.T = 32°C. B, Left, Paired-pulse facilitation before (thin lines) and 400 msec after UV flash (thick lines). Right, Traces are scaled to the peak of the first EPSC to reveal an increase in PPF (arrow) after exposure to uncaged GABA. Interstimulus interval for PPF was 30 msec. Traces are averages of four trials. EPSCs were recorded at −40 mV. T = 34°C.
Fig. 11.
Fig. 11.
Reduction in presynaptic calcium influx by uncaged GABA at 24 and 32°C. A, Representative example of a caged GABA experiment performed at 24°C measuring the time course of reduction in calcium influx after photolysis of caged GABA.Inset, ΔF/F signals after the UV flash. Data points and traces are averages of three trials. B, Example of a similar experiment performed at 32°C.Inset, ΔF/F signals after the UV flash.C, Averages of 10 experiments at 24°C (filled circles) and 9 experiments at 32°C (open circles). Falling phases are fit by single-exponential decays with time constants of 1.77 sec at 24°C and 0.68 sec at 32°C. Inset, Rising phase of the reduction in calcium influx after photolysis shown on an expanded time scale. The onset was fit to a single exponential in both cases with time constants of 184 msec at 24°C and 70 msec at 32°C. Data points are given as mean ± SEM.
Fig. 12.
Fig. 12.
Time course of reduction in presynaptic calcium influx caused by heterosynaptic depression versus uncaged GABA. The averages of both the post-tetanic and the photolysis-induced reductions in calcium influx at 32°C are superimposed to compare relative magnitudes and time courses. Data points are given as mean ± SEM.

References

    1. Albus JS. A theory of cerebellar function. Math Biosci. 1971;10:25–61.
    1. Anwyl R. Modulation of vertebrate neuronal calcium channels by transmitters. Brain Res Rev. 1991;16:265–281. - PubMed
    1. Bonanno G, Raiteri M. Functional evidence for multiple GABAB receptor subtypes in the rat cerebral cortex. J Pharmacol Exp Ther. 1992;262:114–118. - PubMed
    1. Bonanno G, Raiteri M. Multiple GABAB receptors. Trends Pharmacol Sci. 1993;14:259–261. - PubMed
    1. Davies CH, Davies SN, Collingridge GL. Paired-pulse depression of monosynaptic GABA-mediated inhibitory postsynaptic responses in rat hippocampus. J Physiol (Lond) 1990;424:513–531. - PMC - PubMed

Publication types

MeSH terms

LinkOut - more resources