. 1997 Dec 1;17(23):9085-94.
doi: 10.1523/JNEUROSCI.17-23-09085.1997.

In vitro ischemia promotes glutamate-mediated free radical generation and intracellular calcium accumulation in hippocampal pyramidal neurons

Affiliations

In vitro ischemia promotes glutamate-mediated free radical generation and intracellular calcium accumulation in hippocampal pyramidal neurons

J L Perez Velazquez et al. J Neurosci. .

Abstract

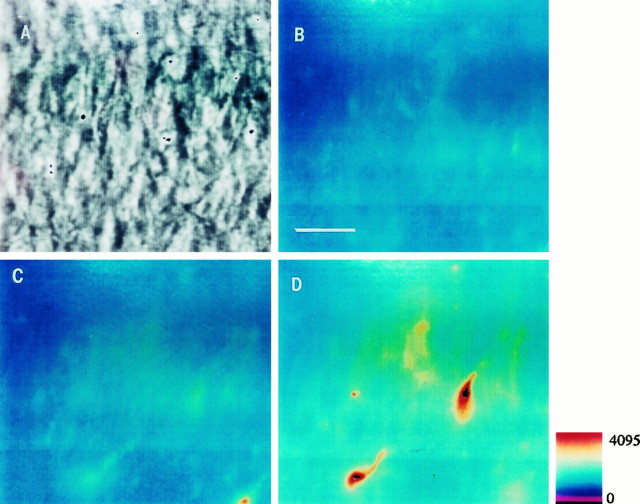
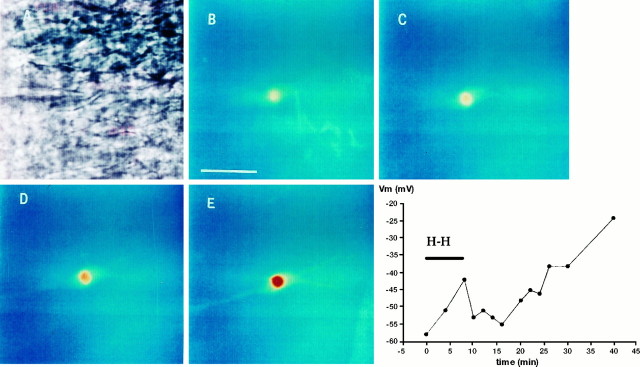
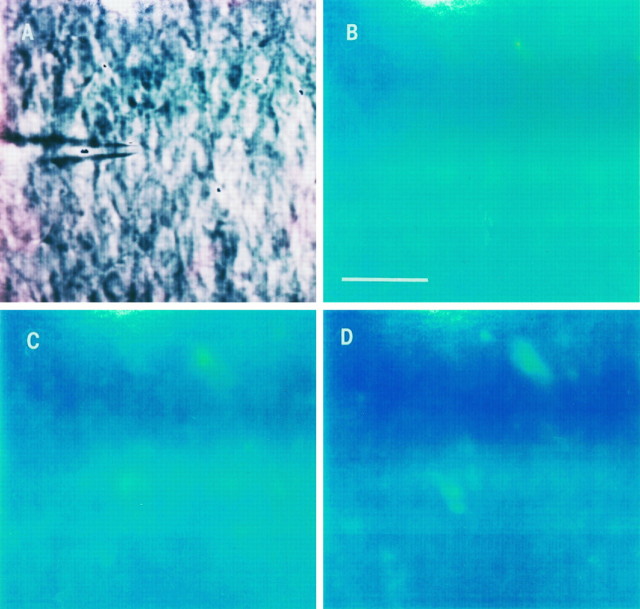
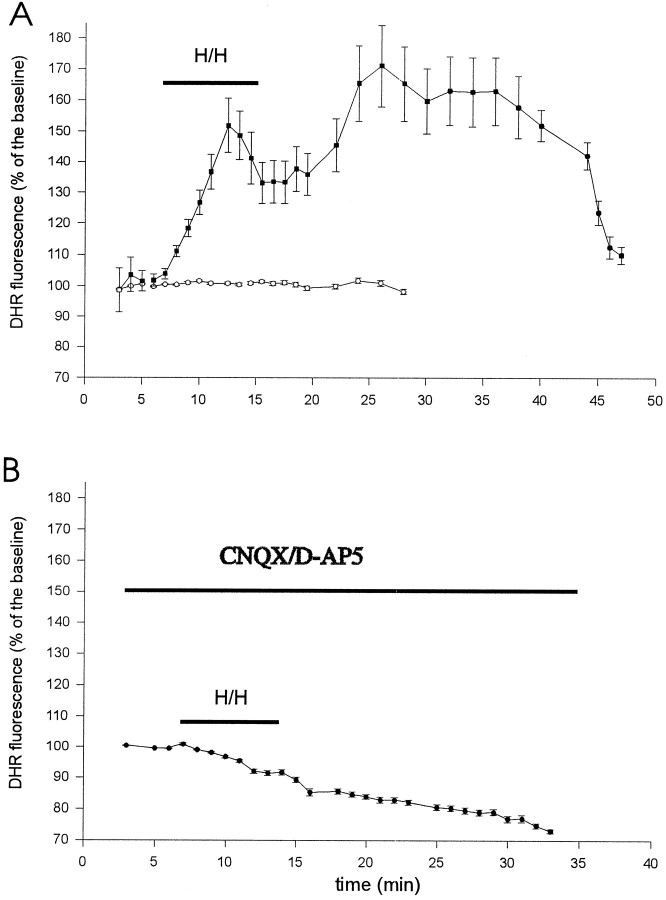
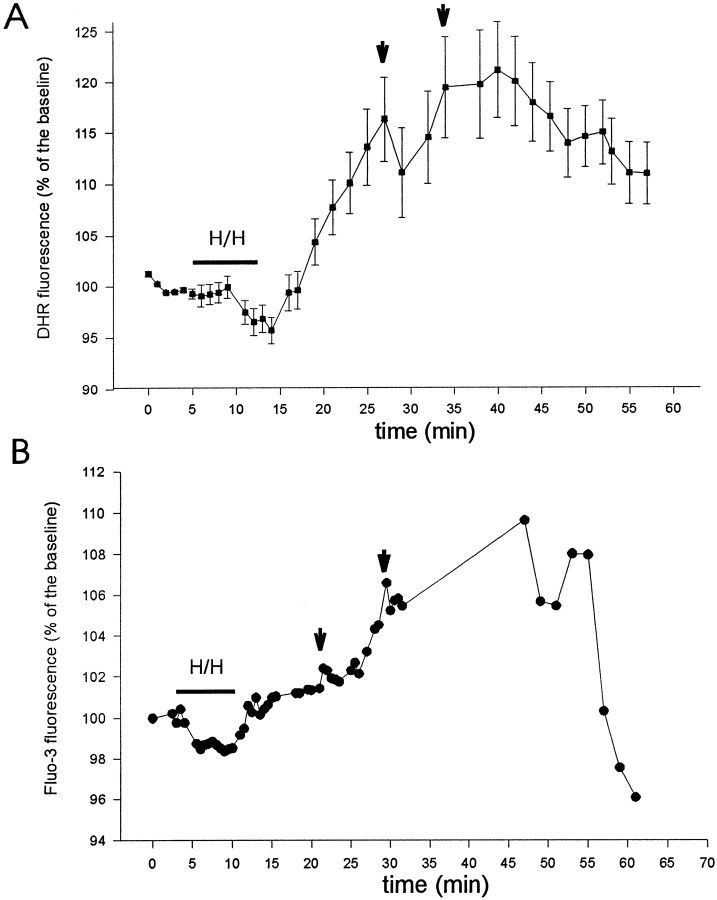
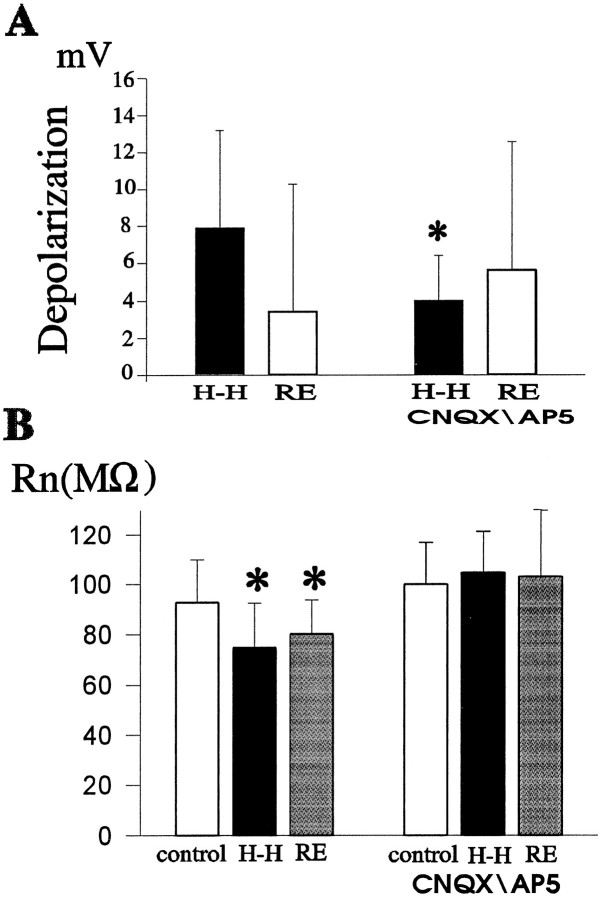
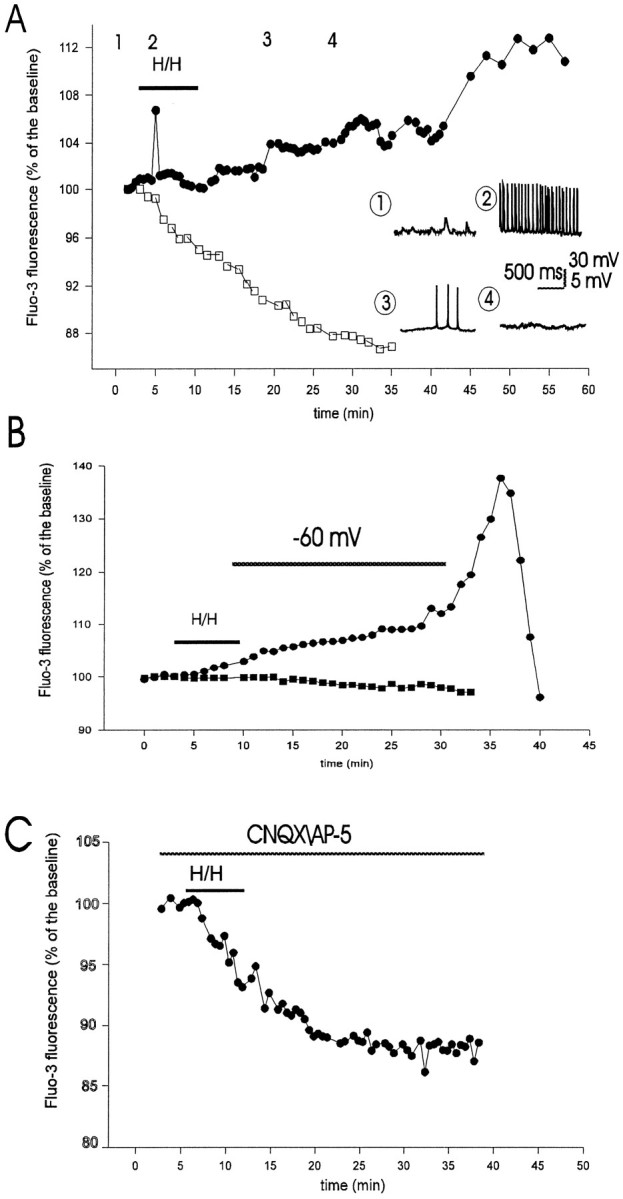
Ischemia-induced cell damage studies have revealed a complex mechanism that is thought to involve glutamate excitotoxicity, intracellular calcium increase, and free radical production. We provide direct evidence that free radical generation occurs in rat CA1 pyramidal neurons of organotypic slices subjected to a hypoxic-hypoglycemic insult. The production of free radicals is temporally correlated with intracellular calcium elevation, as measured by injection of fluo-3 in individual pyramidal cells, using patch electrodes. Free radical production (measured as changes in the fluorescence emission of dihydrorhodamine 123) peaked during reoxygenation and paralleled rising intracellular calcium. Electrophysiological whole-cell recordings revealed membrane potential depolarization and decreased input resistance during the ischemic insult. Glutamate receptor blockade resulted in decreased free radical production and markedly diminished intracellular calcium accumulation, and prevented neuronal depolarization and input resistance decrease during the ischemic episode. These results provide evidence for a direct involvement of glutamate in oxidative damage resulting from ischemic episodes.


Figures

Fig. 1.
Fig. 1.
DHR123 oxidation to RH123 in the CA1 area of organotypic hippocampal slices subjected to a hypoxic–hypoglycemic episode. Slices were loaded for 25–30 min with DHR123 (15 μm). A, Infrared image of the CA1 layer.B, Pseudocolor micrograph showing background fluorescence emission before the ischemic insult. C, Fluorescence during hypoxic–hypoglycemic episode. D, Fluorescence emission during reoxygenation (25 min). Fluorescence increased in 12 of 13 slices after the anoxic episode. Scale bar (shown in B): 20 μm.Pseudocolor bar indicates arbitrary fluorescence units, which also applies to Figures 4 and 7.
Fig. 4.
Fig. 4.
Fluo-3 emission of a CA1 pyramidal neuron during and after hypoxia–hypoglycemia. A, Infrared image showing the pyramidal cell patched with an electrode containing the calcium indicator fluo-3 (10 μm). B, Resting fluorescence signal before the anoxic insult. Scale bar, 25 μm.C, Fluorescence emission increases slightly during hypoxia–hypoglycemia (4–6 min). D, Fluorescence increased continuously during reoxygenation (10 min). E, The cell nucleus is prominently fluorescent 25 min after the hypoxic insult.Graph on the bottom right represents excursion ofVm for this cell, which followed the typical pattern (Table 1): depolarizing during the hypoxic–hypoglycemic insult (H-H), rebound hyperpolarization in the first minutes of reoxygenation, and irreversible depolarization starting 12 min after the insult and continuing until the end of the recording period.
Fig. 7.
Fig. 7.
DHR123 oxidation to RH123 in the CA1 area subjected to a hypoxic–hypoglycemic episode in the presence of glutamate receptor blockers. CNQX (10 μm) andd-AP5 (50 μm) were applied throughout the experiment. Slices were loaded with DHR123 as explained before.A, Infrared image of the CA1 layer. One neuron was patched (center of image) to monitor biophysical characteristics, as detailed in the text and in Figure 3. B, Background fluorescence emission before the ischemic insult. Scale bar, 30 μm.C, Fluorescence during hypoxic–hypoglycemic episode.D, Emission 15–16 min during reperfusion. Fluorescence emission in the presence of glutamate blockers did not increase in most of the cells of six slices (78.5%; n = 208 cells).
Fig. 2.
Fig. 2.
Time course of DHR123 oxidation to fluorescent RH123 during hypoxia–hypoglycemia and reoxygenation. A, Organotypic hippocampal slice cultures were loaded with DHR123 (15 μm), and its oxidation to RH123 was followed in individual cells of the CA1 pyramidal cell layer during hypoxia–hypoglycemia (H/H) and reperfusion with normal oxygenated ACSF. Images were collected every minute. White circles represent the average of 30 cells from two slices in control condition, without anoxic episode. Black squaresrepresent the average of 30 cells from two slices subjected to hypoxia–hypoglycemia for 8 min. The low level background fluorescence (Fig. 1B) was taken as 100% (baseline). There was an increase in fluorescence emission during the first 4–6 min of the hypoxic insult and during reoxygenation. Notice the fluorescence peak during reperfusion, at 11 minutes after the hypoxic–hypoglycemic episode. B, Average fluorescence emission of 40 cells from two slices exposed to the glutamate receptor blockers CNQX (10 μm) and d-AP-5 (50 μm) during and after the anoxic insult. Fluorescence signal decreased in all slices tested under these conditions (see text), and only a few cells showed an increase of fluorescence during reoxygenation (Table2).
Fig. 6.
Fig. 6.
Comparison between DHR123 oxidation (A) and fluo-3 fluorescence emission (B) during and after hypoxia–hypoglycemia (H/H). Graph in A represents the average of 10 cells in one slice, whereas the fluorescence signal of a pyramidal neuron in another slice filled with fluo-3 via a patch electrode is shown in B. This neuron fired action potentials at low frequency (2.5 Hz) during H/H, which normally resulted in no [Ca2+]i elevations. The first and second major fluorescence elevations (arrows) occurred at 12 and 21 min during reoxygenation in A, and at 11 and 20 min in B.
Fig. 3.
Fig. 3.
Changes in intrinsic membrane properties of CA1 pyramidal neurons during hypoxia–hypoglycemia and at the start of reoxygenation (2–4 min). A, Whole-cell recordings from visually identified pyramidal neurons revealed that membrane potential (Vm) depolarized during the hypoxic–hypoglycemic episode (H-H, black bars) as compared with control values (n = 14). Shown in the plot are mean (±SD) values of the depolarization from controlVm monitored in individual neurons (n = 14). In the presence of glutamate receptor blockers (CNQX, 10 μm, and d-AP-5, 50 μm), the depolarization induced by the insult was not statistically significant compared with control values (n = 7) (see text for details). The difference between the mean depolarization with and without blockers is statistically significant (asterisk indicates significance level;p < 0.05). Vm repolarized in most neurons (Table 1) at the start of the reoxygenation (RE, white bars) without drugs; comparison between mean values with and without blockers is not significant (p < 0.4).B, Input resistance (RN) decreased during the first 4–6 min of hypoxia–hypoglycemia (n = 14; p < 0.025) in most of the neurons (for details, see Table 1) and increased in the first 2–4 min of reoxygenation (p < 0.05 compared with control; n = 9). When glutamate transmission was blocked, RN values during the insult and subsequent reperfusion were not significantly different from those of control (n = 6; p < 0.4).
Fig. 5.
Fig. 5.
Time course of intracellular calcium ([Ca2+]i) accumulation measured by fluo-3 fluorescence emission in CA1 pyramidal neurons during and after hypoxia–hypoglycemia. A, Fluo-3 was injected into individual pyramidal cells in the visual field using patch electrodes, as in Figure 4. Images were collected every 30 sec. White squares represent control fluo-3 signal in a pyramidal cell not subjected to hypoxia–hypoglycemia (H/H). Black circles represent fluo-3 emission in another pyramidal neuron during the H/H episode and subsequent reoxygenation with normal ACSF. Increase in fluorescence during H/H was associated with a few seconds of intense action potential firing, as shown in the inset(point 2). Insets show whole-cell recordings from this neuron at four time points. Initially (point 1), the cell did not fire and received postsynaptic potentials; theVm at this point was −58 mV. H/H-induced depolarization caused spike firing (point 2; spike frequency was 15 Hz; Vm = −51 mV); neurons with lower spike frequencies did not present a rise in fluo-3 signal (Fig. 6B). After 15–16 min in normal oxygenated ACSF, the neuron depolarized (V = −46 mV; point 3), but firing was greatly decreased (0.8 Hz); after 22–23 min it stopped firing completely (point 4; Vm = −38 mV). The increase in fluo-3 emission was not uniform during reoxygenation.B, Circles represent the fluo-3 emission of a neuron whoseVm was held at −60 mV by constant injection of hyperpolarizing current. Two of six neurons under these conditions showed an increase in fluorescence signal during reoxygenation. The hyperpolarizing holding current was −0.15 nA initially, −0.22 nA after 10 min, and −1.9 nA at 22 min during reoxygenation, at which time the voltage clamp was removed, which resulted in a large calcium influx. Squaresshow the fluorescence signal of another voltage-clamped neuron that did not present elevation in [Ca2+]i; the clamp in this cell was maintained throughout the time of recording. C, Blocking of glutamate transmission with CNQX (10 μm) andd-AP5 (50 μm) abolished fluorescence increase during H/H and reoxygenation. The fluorescence signal in these cells (n = 7) was similar to those in control as shown inA (white squares).

Similar articles

Cited by

References

    1. Ankarcrona M, Dybpukt JM, Bonfoco E, Zhivotovsky B, Orrenius S, Lipton SA, Nicotera P. Glutamate-induced neuronal death: a succession of necrosis or apoptosis depending on mitochondrial function. Neuron. 1995;15:961–973. - PubMed
    1. Barzilai A, Rahaminoff H. Stoichiometry of the sodium-calcium exchanger in nerve terminals. Biochemistry. 1987;26:6113–6118. - PubMed
    1. Bindokas VP, Miller RJ. Excitotoxic degeneration is initiated at non-random sites in cultured rat cerebellar neurons. J Neurosci. 1995;15:6999–7010. - PMC - PubMed
    1. Cao W, Carney JM, Duchen A, Floyd RA, Chevion M. Oxygen free radical involvement in ischemia and reperfusion injury to brain. Neurosci Lett. 1988;88:233–238. - PubMed
    1. Choi D. Cerebral hypoxia: some new approaches and unanswered questions. J Neurosci. 1990;10:2493–2501. - PMC - PubMed

Publication types

MeSH terms

LinkOut - more resources